República Democrática de Timor-Leste
Fiscal
Year
2010
Budget
Execution
Report
for
First
Quarter
Ministry
of
Finance
Fiscal Year 2010
Budget Execution Report for
TABLE OF CONTENTS
Page
Overview of Financial Position
……… 1
1. Budget
Expenditure
Estimates ………
1
2. Fiscal
Estimates
……… 1
Budget Execution Whole of Government
……… 2
1. Overall
Budget
Execution ………
2
2. Non-Petroleum
Revenue Receipts
………
3
3.
Expenditure by Appropriation
Categories
……… 4
4. Expenditure
by
Items
……… 5
Conclusion
……… 6
Statements
Summary of Revenues
………
7
Statement of Expenditure
………
9
Statement of Expenditure by Items
………
29
Budget Execution Report First Quarter FY 2010
Overview of Financial Posit ion
1.
Budget Estimates
The
Budget
of
Financial
Year
2010
was
approved
on
23
December
2009
vide
Law
No
15/II
of
2009.
The
Appropriations
approved
were
US
$
659.996
million.
The
Non
‐
Petroleum
Revenue
Receipts
for
Financial
Year
2010
are
estimated
at
US
$
87.200
million.
Parliament
approved
transfers
from
the
Petroleum
Fund
of
up
to
US
$
502.000
million
during
the
year.
Approved
Appropriation
can
be
observed
in
the
table
below:
A
comparison
of
previous
year
FY
2009
is
also
shown.
Table 1
Appropriation
Category
Appropriations
FY 2010
(US$ ‘000
Appropriations
FY 2009
(US$ ‘000)
Variation
(US$ ‘000)
Salary & Wages
97,708
93,822
3,886
Goods & Services
210,280
247,262
-36,982
Minor Capital
29,809
38,053
-8,244
Capital Development
216,808
205,371
11,437
Public Transfers
105,391
96,365
9,026
Total
659,996
680,873
-20,877
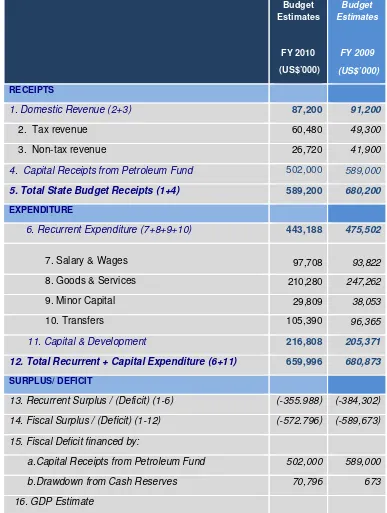
2.
Fiscal Estimates
financed
by
transfers
from
Petroleum
Fund
of
US$
502.000
million
and
by
use
of
cash
balances
of
US$
70.796
million.
Table 2
Budget
Estimates
FY 2010
(US$’000)
Budget
Estimates
FY 2009
(US$’000)
RECEIPTS
1. Domestic Revenue (2+3)
87,200
91,200
2. Tax revenue
60,480
49,300
3. Non-tax revenue
26,720
41,900
4. Capital Receipts from Petroleum Fund
502,000
589,000
5. Total State Budget Receipts (1+4)
589,200
680,200
EXPENDITURE
6. Recurrent Expenditure (7+8+9+10)
443,188
475,502
7. Salary & Wages
97,708
93,822
8. Goods & Services
210,280
247,262
9. Minor Capital
29,809
38,053
10. Transfers
105,390
96,365
11. Capital & Development
216,808
205,371
12. Total Recurrent + Capital Expenditure (6+11)
659,996
680,873
SURPLUS/ DEFICIT
13. Recurrent Surplus / (Deficit) (1-6)
(-355.988) (-384,302)
14. Fiscal Surplus / (Deficit) (1-12)
(-572.796) (-589,673)
15. Fiscal Deficit financed by:
Budget Execution Whole of Governm ent
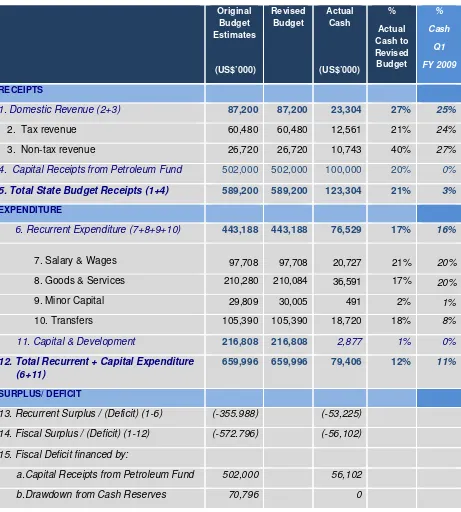
1.
Overall Budget Ex e cution
The
revenue
and
expenditure
figures
provided
in
this
report
are
provisional,
subject
to
reconciliation
and
audit.
Comparison
of
Budget
Execution
for
Q1
of
previous
Fiscal
Year
2009
is
also
shown
as
a
percentage
of
previous
year’s
budget.
Table 3
Original
Budget
Estimates
(US$’000)
Revised
Budget
Actual
Cash
(US$’000)
%
Actual
Cash to
Revised
Budget
%
Cash
Q1
FY 2009
RECEIPTS
1. Domestic Revenue (2+3)
87,200
87,200
23,304
27%
25%
2. Tax revenue
60,480
60,480
12,561
21%
24%
3. Non-tax revenue
26,720
26,720
10,743
40%
27%
4. Capital Receipts from Petroleum Fund
502,000
502,000
100,000
20%
0%
5. Total State Budget Receipts (1+4)
589,200
589,200
123,304
21%
3%
EXPENDITURE
6. Recurrent Expenditure (7+8+9+10)
443,188
443,188
76,529
17%
16%
7. Salary & Wages
97,708
97,708
20,727
21%
20%
8. Goods & Services
210,280
210,084
36,591
17%
20%
9. Minor Capital
29,809
30,005
491
2%
1%
10. Transfers
105,390
105,390
18,720
18%
8%
11. Capital & Development
216,808
216,808
2,877
1%
0%
12. Total Recurrent + Capital Expenditure
(6+11)
659,996
659,996
79,406
12%
11%
SURPLUS/ DEFICIT
13. Recurrent Surplus / (Deficit) (1-6)
(-355.988)
(-53,225)
14. Fiscal Surplus / (Deficit) (1-12)
(-572.796)
(-56,102)
15. Fiscal Deficit financed by:
Budget
execution
for
the
first
quarter
was
US$
79.4
million
which
was
12%
on
cash
basis.
The
inflow
of
domestic
receipts
into
the
consolidated
account
was
US$
23.3
million.
US$
100
million
from
Petroleum
Fund
was
transferred
during
the
first
Quarter.
2.
Non-Petroleum Revenue Rec eipts
The
total
Domestic
Revenue
collections
for
the
first
quarter
were
US$23.3
million.
Excise
Duties
17%
(FY
2009
‐
16%),
and
Withholding
Tax
13%
(FY
2009
‐
11%)
are
the
major
components
of
tax
receipts.
Details
of
User
Fees
&
Charges
and
Other
Non
‐
Tax
Revenues
are
given
in
the
attached
statement.
Sales
Tax
5%
Excise
tax
17%
Import
Duty
5%
Individual
Income
Tax
Government
Employees
1%
Income
Tax
Other
than
Government
4%
Special
Withholding
Tax
13%
Corporate
Business
Tax
5%
Services
Tax
4%
Interest
0%
User
fees,
charges
and
other
non
tax
revenues
9%
Sale
of
Rice
23%
Autonomous
Agency
revenues
14%
Composition
of
Domestic
Revenues
3.
Expe nditure by Appropriation Categories
Salaries
and
Wages
26%
Goods
and
Services
46%
Minor
Capital
1%
Capital
and
Development
4%
Transfers
23%
Category
‐
Wise
Expenditure
4.
Expe nditure by Item s
The
major
items
of
expenditure
were
Salaries
26%
(FY
2009
‐
24
%)
and
Transfers
Payments23%
(FY
2009
–
15%).
Details
of
expenditure
by
items
are
given
in
the
statement
attached
.
Salaries
26%
Public
Grants
14%
Personal
Benefit
Payments
9%
Fuel
for
Generators
9%
Professional
Services
9%
Advances
and
PPA
7%
Overseas
Travel
4%
Other
Misc.
Services
3%
Other
Expenses
3%
Infrastructural
Assets
3%
Oprtnl.
Consum.
Materials
&
Supplies
3%
Vehicle
Operation
Fuel
2%
Vehicle
Maintenance
2%
Others
6%
Conclusion
Revenue Item
Revenue
Estimates
(US$ '000)
Actual
Collections
(US$ '000)
% Actual
Tax Revenues
A. Tax on Commodit ies
48, 340 7, 361
15%
Sales Tax
15, 520
1, 271
8%
Excise Dut ies
14, 650
4, 029
28%
Import Dut ies
15, 110
1, 216
8%
Export Dut ies
3, 060
844
28%
B. Ot her Taxes
12, 140 5, 200
43%
Individual Income Tax
60
223
371%
Individual Income Tax (Ot hers)
3, 410
970
28%
Corporat e Tax
4, 170
2, 960
71%
Wit hholding Tax
4, 490
1, 047
23%
I. Total Tax Revenues (A +B)
60, 480 12, 561
21%
Non-Tax Revenues
C. Int erest
- 11
Int erest
11
D Taxas e Pagament os de Ut ilização e Out ras Receit as Não Fiscais
16 220 7 400
46%
REPÚBLICA DEMOCRÁTICA DE TIMOR-LESTE
Summary of Revenues
First Quarter Fiscal Year 2010
D. Taxas e Pagament os de Ut ilização e Out ras Receit as Não Fiscais
16, 220 7, 400
46%
Business Regist rat ion Fees
300 180
60%
Post al Fees
30 -
0%
Rent al of Propert ies
2, 500 556
22%
Wat er Fees
70 14
20%
Nat ional Universit y Fees
600 -
0%
Vehicle Regist rat ion Fees
1, 200 195
16%
Vehicle Inspect ion Fees
300 -
0%
Driver Licence Fees
250 -
0%
Public Transport
-
Transport Fines
-
Ot her Transport Fees
20 -
0%
Telecommunicat ion Fees
-
ID Card and Passport Fees
450 128
28%
Visa Fees
1, 200 314
26%
Medical and Hospit al Fees
70 16
23%
Court Fees
80 -
0%
Revenue Item
Revenue
Estimates
(US$ '000)
Actual
Collections
(US$ '000)
% Actual
REPÚBLICA DEMOCRÁTICA DE TIMOR-LESTE
Summary of Revenues
First Quarter Fiscal Year 2010
Mining Operat ion Royalt ies
- 36
Ot her Non-Tax Revenues
150 429
286%
Dividends, Prof it s and Gains
1, 900 10
1%
Bid Document s Receipt s
100 17
17%
Radio & Television f ees
- -
Auct ions
- 93
Sale of Rice
7, 000 5, 414
77%
II. Total Non-Tax Revenues (C + D)
16, 220 7, 411
46%
III. Total Domestic Revenues (I + II)
76, 700 19, 972
26%
IV. Pet roleum Fund Capit al Receipt s
502, 000 100, 000
20%
Tot al Treasury Revenues (III + IV )
578, 700 119, 972
21%
AUTONOMOUS AGENCIES
EDTL Revenue
8, 400 2, 377
28%
EDTL int erest
1
EDTL int erest
- 1
Port Fees and Rat es
1, 400 592
42%
Port Int erest
- -
Aviat ion Service Rat es
700 345
49%
Aviat ion Int erest
- -
Inst it ut e of Equipment Management Revenues
- 16
V. Tot al Aut onomous Agencies Revenue
10, 500 3, 332
32%
Total Revenues (Domestic + Self-Funded ) III + V
87,200 23,304
27%
Total Revenues (Domestic + Petroleum Fund + Self-Funded )
589,200 123,304
21%
Original Budget Virements Current Budget Cash % Obligations % Cash + Obligations %
Original Budget Virements Current Budget Cash % Obligations % Cash + Obligations % REPÚBLICA DEMOCRÁTICA DE TIMOR-LESTE
Statement of expenditure First Quarter Fiscal Year 2010
Aviation CFTL 792,000 - 792,000 69,521 9% 13,727 2% 83,247 11%
Salary & Wages 355,000 - 355,000 59,376 17% - - 59,376 17% Goods & Services 299,000 - 299,000 10,144 3% 13,727 5% 23,871 8%
Minor Capital 138,000 - 138,000 - - - - - 0%
EDTL CFTL 23,235,000 - 23,235,000 311,383 1% 91,933 0% 403,315 2%
Salary & Wages 863,180 - 863,180 244,764 28% - - 244,764 28% Goods & Services 2,080,820 - 2,080,820 29,244 1% 22,333 1% 51,577 2%
Minor Capital 991,000 - 991,000 - - 69,600 7% 69,600 7%
Capital & Development 19,300,000 - 19,300,000 37,375 0% - - 37,375 0%
PIEM CFTL 11,250,500 - 11,250,500 89,257 1% 23,200 0% 112,456 1%
Salary & Wages 344,000 - 344,000 78,651 23% - - 78,651 23% Goods & Services 915,000 - 915,000 10,606 1% 22,200 2% 32,806 4% Minor Capital 9,991,500 - 9,991,500 - - 1,000 0% 1,000 0%
TOTAL SELF FUNDS 39,125,500 - 39,125,500 507,994 1% 935,435 2% 1,443,428 4% TREASURY FUNDS SUMMARY 620,870,372 - 620,870,372 78,898,141 13% 103,780,027 17% 182,678,168 29%
Salary & Wages 95,990,136 - 95,990,136 20,309,083 21% - - 20,309,083 21% Goods & Services 206,625,410 (196,000) 206,429,410 36,538,436 18% 30,890,372 15% 67,428,808 33% Minor Capital 18,606,387 196,000 18,802,387 490,824 3% 3,783,295 20% 4,274,119 23% Capital & Development 194,257,867 - 194,257,867 2,839,528 1% 5,437,348 3% 8,276,876 4% Transfers 105,390,572 - 105,390,572 18,720,271 18% 63,669,011 60% 82,389,283 78%
SELF FUNDS SUMMARY 39,125,500 - 39,125,500 507,994 1% 935,435 2% 1,443,428 4%
Salary & Wages 1,718,180 - 1,718,180 418,348 24% - - 418,348 24% Goods & Services 3,654,820 - 3,654,820 52,271 1% 64,835 2% 117,106 3% Minor Capital 11,202,500 - 11,202,500 - - 70,600 1% 70,600 1%
Capital & Development 22,550,000 - 22,550,000 37,375 0% 800,000 4% 837,375 4%
Capital & Development 22,550,000 - 22,550,000 37,375 0% 800,000 4% 837,375 4%
Transfers - - - - - - -
-SUMMARY ALL FUNDS
Salary & Wages 97,708,316 - 97,708,316 20,727,431 21% - - 20,727,431 21%
Goods & Services 210,280,230 (196,000) 210,084,230 36,590,707 17% 30,955,207 15% 67,545,914 32%
Minor Capital 29,808,887 196,000 30,004,887 490,824 2% 3,853,895 13% 4,344,719 14%
Capital & Development 216,807,867 - 216,807,867 2,876,903 1% 6,237,348 3% 9,114,250 4%
Transfers 105,390,572 - 105,390,572 18,720,271 18% 63,669,011 60% 82,389,283 78%
Salaries and Wages
Goods and Services
Minor Capital
Capital and
Development Transfers TOTAL
% OF TOTAL General Public Services 2,403 17,875 56 494 9,673 30,50 1 38.4% Defence 1,294 1,787 37 3,118 3.9% Public Order and Security 3,581 2,835 122 6,538 8.2% Economical Affairs 2,741 5,661 209 2,305 4,441 15,356 19.3 % Environmental Protection 66 45 - 110 0.1% Housing and Community - 0.0% Health 2,192 4,659 46 38 154 7,089 8.9% Recreation, Culture and Religion 237 726 53 1,015 1.3% Education 7,872 2,470 1 2,133 12,476 15.7% Social Protection 343 532 20 40 2,268 3,203 4.0% Overall 20,728 36,591 491 2,877 18,720 79,406 100.0%
REPÚBLI CA DEMOCRÁTI CA DE TI MOR-LESTE CASH EXPENDI TURE BY FUNCTI ON
First Quarter Fiscal Year 2010