Gadjah Mada International Journal of Business September-December 2010, Vol. 12, No. 3, pp. 377–391
Gudono
Faculty of Business and Economics, Universitas Gadjah Mada University
According to the UN, air pollution kills more than 3 million people each year (UN-Habitat 2007). Despite the magnitude of the impact, delays in making decisions about the environment are quite common among governments worldwide. The purposes of this study are twofold. First, the study is to investigate the relative strength of attributes of environmental policy such as methods of vehicle restriction, percentage of reduction in lead (and CO2) content, and percentage of subsidy reduction. Sec-ond, the study is to test government choice when it faces conservative, “scientific,” and popular policy alternatives. To achieve both objectives this research uses an experimental method. The orthogonal design is adopted for stimuli presenta-tion and conjoint analysis is used for data analysis. The re-search participants are students of an accounting graduate program of a state university in Java (Indonesia).
The results suggest CO2/lead reduction has the strongest effect on policy maker preference. In addition, those policy makers tend to prefer the status quo condition which indicates conservative views. This is demonstrated by the tendency of their choice on an alternative policy package which requires
mini-THE APPLICATION OF CHOICE-BASED
CONJOINT MODEL TO STUDY
GOVERNMENT AUTHORITIES
PREFERENCE
mum changes compared with the existing policies (a maximum utility of 64.3 percent vs. 28.6 percent and 7.1 percent of other alternatives). In addition, bureaucrats tend to play “safe” (namely the reduction of lead content in gasoline) when the possibility of resistance is imminence. Some consequences of the research findings are also discussed.
Keywords: conjoint analysis; mixed environmental; public policy; utility function
Background
The Government of Indonesia, especially under the regime of Susilo Bambang Yudhoyono (SBY), has been frequently criticized for being slow in making strategic decisions, including decisions about issues that can have serious repercussions on the environ-ment (WaspadaOnline 2010; PME-Indonesia.Com 2008). This can be seen from the SBY government’s inaction on reducing fuel subsidies (an issue that has remained pending for more than 2 years) and the restriction of motorized vehicles on the highway. The impact of inaction is devastating. For example, fuel subsidy increases year by year (AntaraNews.Com 2008). In addition, traffic congestion in big cities is getting worse (RakyatMer-dekaOnline 2010).
Slowness in making decisions re-lated to saving the environment also seems prevalent in many countries (UNFCCC 2010). The fact that the Kyoto Protocol can only be accepted fully 20 years after its declaration is real evidence that many governments use a slow adoption strategy when they evaluate more stringent standards
re-garding air pollution. Implications of the problem can be seen from the following data: according to the UN, air pollution kills more than 3 million people each year (UN-Habitat 2007), 925 million people are experiencing a hun-ger (FAO 2010), and 1.4 billion people in 2005 earned less than $ 1.25 per day (World Bank Development Indicators 2008). UN data showed that CO2 emissions would increase 60 percent between 1997 and 2010 and 60 percent of the increase would be contributed by developing countries.
extractive by nature: sucking resources from Mother Nature and exhausting them. Examples may include coal min-ing for energy creation in Northeast Asia countries (e.g., China, South Ko-rea, North KoKo-rea, and Mongolia) and deforestation which today is still hap-pening in Indonesia and Brazil. If the extractive activity is reduced, those governments are worried they will lose their source of income from the tax on those activities and that consequently it would reduce their ability to grow the economy. Another economic reason might relate to the shift in national economic ideology which has become pro-market. For example, the change in China from a socialist system to a pro-market system has led to the emer-gence of consumerist life styles. While the move increases economic growth, simultaneously the move also boosts the exploitation of natural resources.
Indonesia is not an exception. After the fall of Suharto in 1998, many fundamental changes occurred in Indonesia’s economic and political sys-tem. The implementation of Law No. 32/2004 on regional autonomy and Law No. 25/1999 on fiscal balance moti-vates local governments to become more responsive to what is needed by their people. Despite major change in many areas, Indonesia’s environmen-tal condition remains constant, if not getting worse, due to lack of compre-hensive regulations that protect the environment from excessive exploita-tion. Law No.32 has resulted in pres-sure to raise “local original revenues” (PAD) which consequently forces
lo-cal authorities (i.e., regents, mayors, and governors) to adopt more innova-tive maneuvers in exploiting areas un-der their control at all costs.
This explains why, when local governments face the two alternatives of either raising revenues to fund their expenditure or preserving the environ-ment for future generations, the choice seems to them to be obvious: they are more likely to deplete the natural re-sources. The fact that the central gov-ernment and many local authorities are not politically strong makes the situa-tion even worse, since they are also afraid of facing a hostile response from people when making policy that is not popular. The fact that in the era after the Suharto regime there has been no single ruler whose mandate was backed by a majority vote – SBY’s party itself is supported only by 35 percent of votes – might explain delays and weak adop-tion of strong environmental policies.
de-population is a direct threat to the environment. In accordance with the concept of “ecological footprint” (Wachernagel and Rees 1995), green plants are an essential requirement to clean up carbon dioxide (and the “green-house effect”, etc.) resulting from eco-nomic development to support the con-sumption of the population (such as burning coal for electrical energy). But to clear the negative impact of one person’s consumption, acres of planta-tion are needed. Note the following measure of ecological footprint: for one person in North America needed 20-25 acres of crops to provide food and assimilate waste. Wachernagel and Rees (1995) argue that the world ecological footprint already exceeds the world’s supply of productive land. The above problems become more complex when social variables such as health, social justice and politics are taken into account in the study of the devastating impact of population growth. Research shows that poor sanitation — as a result of population growth again as well as the pollution — is directly related to the level of child mortality: in Africa every year five million children die (Unicef 2008). In Brazil the estimated proportions of res-piratory deaths attributed to CO, SO2, and PM10, Pls — considered individu-ally — are around 15, 13, and 7 percent, respectively (Conceicao et al. 2001). Linking environment and justice prob-lems, we witness cases where people in water rich areas in Latin America are short of water (Beeson 2008). It seems the problem is also caused by spite the serious effects of the
govern-ment inaction, until now there has not been much research focused on the topic.
Consequently, how people con-sider mixed environmental factors and make up their minds, remain a mystery. The main objective of this study is to investigate the preferences of public officials in making choices related to air pollution reduction policies. In par-ticular, this study analyzes the utility function of government officials when they evaluate features of environment-related policies. Another aim is to intro-duce the use of a choice-based model using conjoint analysis in environmen-tal policy analysis (Elrod et al. 1992). This is an exploratory study since very little is known regarding the utility func-tion of government officials in the area of environmental policy analysis. De-spite the exploratory nature of this study, the issue being studied and the approach being used in this research could later be adopted to extend to issues and methodologies in the areas of governmental strategic management, psychology of economics, as well as governmental management account-ing.
Literature Review
Population, Economic, and
Environmental Degradation
political problems surrounding water, where several governments in Latin America (e.g., Uruguay) are forced to negotiate with the IMF about conduct-ing privatization of water systems.
Events that are not so much dif-ferent in fact can also be found in Indonesia. For example, water pollu-tion in major cities in Indonesia has caused high rates of infant mortality (World Bank 2008). Furthermore, the entry of foreign investors into the busi-ness of providing drinking water has happened in Jakarta and Surabaya. Not so long ago, a market leading, state-owned water company was ac-quired by a multinational company (as in the case of PT Golden Mississippi purchased by DANONE). ADB data in 2008 states that water pollution in Indonesia is causing a loss of Rp48 trillion per year. It appears that the link between “population” affects “eco-nomic development” affects “envi-ronmental problems” affects “social problems” also threatens Indonesia.
In addition to water, air is also adversely affected by the growing size of the Indonesian population. With in-creasing population, the number of ve-hicles has also increased, so worsening air quality. Besides this, budget pres-sures are also increasing because the infrastructure (roads and bridges) that the government should provide is in-creasing. On the other hand, govern-ments also face pressure to provide large quantities of gasoline and this depletes oil fields of Indonesia. The data show that from the year 2001 to
2008, the number of vehicles increased from 3,5 million to 9,6 million (Vivanews.Com 2010). For all of Indo-nesia in the year 2008 there are more than 70 million vehicles (Statistics In-donesia 2009). The number is growing at about 24 percent per year. With the increasing number of vehicles is not surprising that government subsidies for fuel are also getting bigger (Rp80 trillion and will soon increase to Rp120 trillion, after parliament approved the increase in subsidy).
Complexity Surrounding
Environmental-Related
Decision Making
Many factors must be considered in making such decisions and this leads to difficulty in determining which op-tion is the best. Public officials often have to determine priorities (trade-offs) between economic reasons ver-sus environmental reasons. For ex-ample, to decide which is the more important between an increase in fuel prices or a reduction on the number of vehicles? In addition a decision pack-age can also contain a combination of features simultaneously, so the pack-age of decisions that can be compared with another which is preferred in ac-cordance with the composition of ex-isting features. In the context of policy issues related to the impact of popula-tion on the number of vehicles, some aspects that are often considered in-clude:
1. How to reduce the number of ve-hicles on the highway; such as whether to increase gasoline prices by making sales quotas or vehicle. 2. How big is the target of reducing the content of CO2 that need to be set?
3. By how much should subsidies be reduced?
Due to the nature of these fea-tures, which are not easily assessed objectively, the judgment of the deci-sion maker plays a dominant role. It is not impossible that the actual suitability of a policy depends on the subjective decision-maker preference of features related to policy choices.
Information Integration and
Decision Maker Preference
In the private sector, business fail-ures, e.g. bankruptcies, are often stud-ied using the agency theory framework because the failure is thought to be caused by moral hazard or adverse selection of the management (the agent, see Barney 2002). The framework is appropriate when the principal-agent relationship is well defined and infor-mation asymmetry does exist. How-ever, in the context of public policy, such as those related to the implemen-tation of sustainable development pro-grams, principal-agent relationship is often vague. One might think that the people’s representatives (members of The House) are the principals. In many (if not all) cases, it is not true because the departmental ministers and/or other government officials are subordinate to the president. Furthermore, in reality parliament cannot really control, or even effectively monitor, the govern-ment officials. In fact, news media shows that in many cases members of the parliament are successfully co-opted by bureaucrats (executives who should be supervised). In this regard, understanding the psychology of public officials in choices related to develop-ment programs is important to investi-gate.
theory (Anderson 1991). Information integration theory explores how atti-tudes are formed and changed through the integration (mixing, combining) of new information with existing cogni-tions or thoughts. According to infor-mation integration theory, every piece of information will have value and weight such that the attitude of some-one which is formed, after considering all information, can be modeled as
i= number of pieces of information, w = weight, and
v = value of the information. Since the “w” and “v” could resemble information from different areas, the model is suitable for studying the effect of mixed factors on decision makers’ attitudes. This study uses part worth func-tion (= utility funcfunc-tion) as a representa-tion of the informarepresenta-tion integrarepresenta-tion theory’s model. Hence, the part worth function is basically a model of how government officials evaluate the at-tributes of the policy package and make their decisions. To conduct such sis a technique known as conjoint analy-sis (conjoint is the acronym ‘Consid-ered jointly’) is implemented. The tech-nique is commonly used in marketing research area (e.g., Rosko et al. 1985; Schaupp and Belanger 2005). The con-joint analysis model is classified as a
discrete-choice model where the pref-erence or the choice made by respon-dents (= decision makers) is consid-ered as an additive function of the contribution of all attribute levels in influencing the perceptions of decision makers. The model is as follows.
1 1 K= the level of attributes, M= the number of attributes,
km= the contribution of each attribute
level,
km= 0, if an attribute is not relevant
level (not considered) and
km= 1, if an attribute level
consid-ered.
con-tains an optimal combination of fea-tures.
Research Methods
Nature of Study and Sampling
Method
This study is an experiment using a sample of civil servants (PNS) who were pursuing their master degree in accountancy in a state university in Java (Indonesia). The sampling pro-cess is not random and the researcher established two criteria. First, the ex-periment participants should have been working as civil servants for a mini-mum of 5 years or should have served as a fourth echelon in his/her institu-tion. Second, the subject should have taken a course in management ac-counting, strategic management, or management control system. Non ran-dom sampling is implemented to ensure efficient process of selecting research participants who satisfy both sample requirements. Five years of working experience was required to assure that participants are reasonable represen-tation of true government officials. A sample of eight students participated in the experiment, but after reviewing their responses, one student was dropped from the sample due to the incompleteness of her response. Un-like the other parametric statistics, in CA small sample size (8-1 = 7) would not be a barrier (Hair et al. 1995, see also Kotri 2006).
Experimental Design,
Instrumentation, and Validation
Rather than using a full factorial design, to reduce the complexity of the experiment, the researcher used a frac-tional design, or more precisely, an orthogonal design to ensure the effi-ciency in research design. In addition, researchers used four holdouts and 3 groups of simulations.
For instrumentation the researcher used “full profile card-sort” approaches (Hair et al. 1995; Gudono, upcoming) in which respondents were asked to ob-serve cards that contain descriptions about various attribute levels of pollu-tion control related to a policy package and thereafter were to express the level of their preference by using the ordinal scale (ranking). Before the spondents answers were taken, re-searchers observed their answers at a glance to find errors in the answer sheets. If errors were found then the students were asked to correct them. Note that in CA, similar (double) an-swers in more than one card are not allowed. Likewise, the rankings over the maximum number of options must be dropped. To detect the validity of the answers, researchers used a cross validation by utilizing holdouts data.
Scenarios and Stimuli
car-bon dioxide and lead in the air. Stimuli are experimental treatments consisting of combinations of attributes of an object (e.g. policy). Researcher choice upon the emission reduction policy package is done with some consider-ation, namely: (1) the burden of pre-mium subsidies (gasoline with higher lead levels) was considered too high by the ministry of finance (Antara News.Com 2008), (2) the UN and some developed countries encourage implementation of programs of CO2 reduction ‘carbon trading’ (IPCC 2007), and (3) the issue of traffic con-gestion has been the subject of wide-spread discussion in Indonesia (Vivanews.Com 2010).
In the experimental scenarios, par-ticipants of this study were assumed to be members of a team drafting “toxic air pollution reduction policy” that will soon be implemented in large cities. The policy is basically a package of programs that are characterized by three attributes the participants must be assessed, namely:
1. Type of vehicle restrictions: (A) setting appropriate number of ve-hicles in which the even and odd numbers should not be in the street at the same time (daily schedule for even and odd motor vehicle numbers), (B) implementing gaso-line price discrimination by raising the price of gasoline for noncom-mercial vehicles, and (C) establish quotas to restrict number of ve-hicle sales in Indonesia.
2. Reduction of lead content, by re-ducing at a level of: (K) 15 percent, (L) 30 percent, (M) 45 percent, and (N) 60 percent of present lev-els.
3. Economic incentives from the gov-ernment in the form of policy: (X) the overall elimination of subsidies, (Y) 50 percent removal of subsi-dies granted now, (Z) to maintain the amount of government subsi-dies that exist today.
In addition to assessing the strength of each factor’s effect, officials’ pref-erences on three combinations of policy elements are also tested. These combi-nations (“policy packages”) are as fol-lows:
(1) Status quo policy. This policy will consist of policy elements that re-quire the least change from exist-ing condition, i.e. A+K+Z
(2) “Radical” Change Policy. This policy could be the most “scien-tific” and the most supported by environmentalists because it re-quires major departure from
cur-rent conditions simply to satisfy the demand of environmental views. It consists of a combination among C+X+N.
(3) Popular policy (which consists of B+K+Z). It is a popular policy be-cause it tries to comply with popular demand: low gasoline price and not much change from the current situa-tion. While from the political stand point this policy might gain support from low to middle income elements of society, it could be a financial burden for the government.
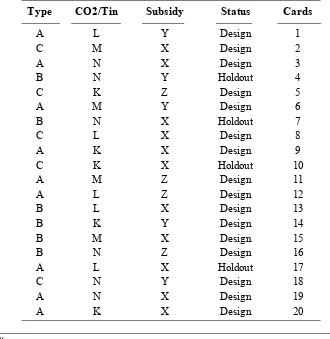
Table 1. Orthogonal Design
Type CO2/Tin Subsidy Status Cards
A L Y Design 1
C M X Design 2
A N X Design 3
B N Y Holdout 4
C K Z Design 5
A M Y Design 6
B N X Holdout 7
C L X Design 8
A K X Design 9
C K X Holdout 10
A M Z Design 11
A L Z Design 12
B L X Design 13
B K Y Design 14
B M X Design 15
B N Z Design 16
A L X Holdout 17
C N Y Design 18
A N X Design 19
Orthogonal Design
If all combinations of the stimuli are given (i.e., implementing “full fac-torial design”) then there will be thirty six (= 3x4x3) combinations of stimuli which should be evaluated by the re-search participants. By considering the cognitive burden to be borne by the subjects, the full factorial design was clearly not feasible (Maddala et al. 2003). Therefore in this study the re-searcher used a fractional design (Gudono, upcoming 2011) with stimuli arranged orthogonally. The following is the orthogonal design being used:
Results
Utility Function
Table 2 shows the officials’ utility estimates of CA outputs. Based on Table 1 the utility function of the toxic gas emission reduction public policy can be developed as follows:
U = 0.286(A)+0.5(B) - 0.786(C)+0.143(K) - 1.107(L)+0.107(M)
+0.857(N) - 0.333(X) 0286 (A) +0.5 (B)- 0786 (C) +0143 (K) -1107 (L) +0107 (M) +0857 (N) -0333 (X) -0.619(Y) + 0.952(Z) +8.512 -0619 (Y) +0952 (Z) + 8512…………..(2) where,
U = total utility; A, B,.., Z are the attribute levels being tested.
Some utility coefficients in Model 2 are negative values (disutility) which indicates that the level of such features (e.g., C) is less preferred. However, if the attributes are combined as a pack-age with other policy attributes, it is still possible that the value of overall com-bination would be positive.
Attribute Comparison and
Validity Check
The CA outputs also show a com-parison of the importance of each fea-ture as follows.
type = 31.843 CO2/lead = 47.152 subsidy = 21.005
The data above show that the policy of reducing lead level has the Table 2.Overall Utility Estimate
Overall Utility Estimate Utility Estimate Std. Error
most important weight (47.152%) than the “type of restriction” (31.843%) and “subsidies” (21.005%). This fact indi-cates that the public officials prefer to “play safe,” because compared to other options, this policy is the most “control-lable” and the government could ex-pect least resistance.
From the correlations in Table 3, it seems that the goodness of fit model is relatively good (Pearson’s R = 0.477, significant at = 0.05). Evidence score Kendall’s tau also supports this
conclu-sion (=0.37, p=0.024, significant at = 0.05). Cross validation absolute value of Kendall’s tau) of holdouts data is 0.548, but it is not significant.
Choice Simulator
One of the advantages of CA is that researchers can compare several policy packages that do not even exist yet. In this case the researcher may conduct simulations of the most valued policy by respondents. In this study the researcher was also interested in evalu-ating the utility of (a) “status-quo policy”, (b) “radical change policy”, and (c) popular (according to the ap-praisal of low to medium income groups), and the results are presented in Table 4 (A) and 4 (B).
Table 4 (A) and (B) list the results of the simulation of the three packages. From the simulation results in Table 4 (A) it is obvious that package II is the most preferred choice (Pref= 7.964, the smallest among the three alterna-tives). However, it is still unclear whether at the end this package would ultimately be selected. The data in Table 4 (B) shows the three assess-ment criteria. Based on the criteria, package I is possibly the policy that is
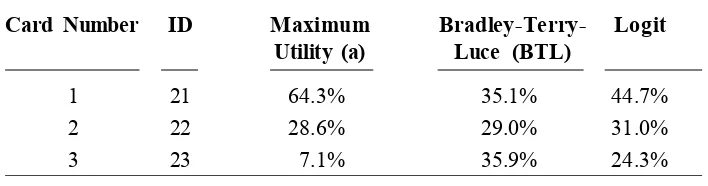
Table 4 (B). Probability Preference
Card Number ID Maximum Bradley-Terry- Logit
Utility (a) Luce (BTL)
1 21 64.3% 35.1% 44.7% 2 22 28.6% 29.0% 31.0% 3 23 7.1% 35.9% 24.3% Table 3. Correlation
Value Sig.
Pearson’s R .470 .033 Kendall’s tau () .370 .024 Kendall’s tau ()
for Holdouts .548 .139
Table 4 (A). Preference Score
Card ID Score
Number
finally selected (according to the method of “maximum utility” and “logit”). If the BTL method is used, the value of package I is only slightly smaller than the value of package III. The simulation results may explain why, based on prior experience, The Indo-nesian government tends to avoid dras-tic changes regarding the removal of fuel subsidies and/or is reluctant to implement radical ways of coping with traffic congestion. It is quite reason-able that public dissatisfaction (espe-cially among those of low and medium income groups) is increasing.
Conclusions
The results of this study indicate that public officials tend to be reluctant to make radical changes related to the issue of CO2 as well as to reductions in tin/lead emissions into the air, although individually they liked the idea of dras-tic change. This result indicates that there is cognitive dissonance: govern-ment officials individually perceive that they are doing something that is not right or in conflict with their moral views. How this phenomenon would affect their behavior in the long run is not known. Of the three policy at-tributes, namely “reduction of vehicles on the road,” “lead reduction” (through
the production of higher quality gaso-line), and “subsidies,” government offi-cials primarily prefer the second at-tribute (lead reduction). It seems that participants felt that the policy is most easily controlled and they could expect the least resistance from public. This is also an indication that public officials tend to “play safe” in dealing with environmental issues. As a conse-quence, Indonesian should not expect that there will be drastic changes in government policy that is associated with the problem of CO2/lead pollution as well as traffic congestion.
References
Anderson, N. H.. 1991. Contributions to Information Integration Theory. Mahwah, N.J: Erlbaum, USA.
AntaraNews.Com. 2008. Hasil Pembahasan Awal RAPBN 2009 (26 September). Aronson, E., R. D. Akert, and T. D. Wilson. 2006. Social Psychology (6th ed.). Upper Saddle
River, NJ: Pearson Prentice Hall, USA.
Barney, J. B. 2002. Gaining and Sustaining Competitive Advantage. USA: Prentice Hall. Binder, S., and E. Neumayer. 2005. Environmental pressure group strength and air Pollution:
An empirical analysis. Ecological Economics 55 (4). Elsevier: 527-538. Enicef. 2008. The state of Africa’s children 2008. Unicef Report.
Elrod, T., J. J. Louviere, and K. S. Davey. 1992. An empirical comparison of Ratings-based and choice-based conjoint models. Journal of Marketing Research, 29.
FAO. 2010. The State of Food Insecurity in The World. http://www.fao.org/publications /sofi/en/
Gudono (upcoming 2011). Analisis Data Multivariat. Indonesia: BPFE.
Hair, J. F., R. E. Anderson, R. L. Tatham, and W. C. Black. 1995. Multivariate Data Analysis, with Readings. USA: Prentice Hall.
IPCC . 2007. Glossary J-P, in (section): Annex II Glossary. In (book) Pachauri, R. K. and A. Reisinger, Climate Change 2007: Synthesis Report. Contribution of Working Groups I, II and III to the Fourth Assessment Report of the Intergovernmental Panel on Climate Change (Core Writing Team). IPCC, Geneva, Switzerland
Kotri, A. 2006. Analyzing Costumer Value Using Conjoint Anaysis: The Example of Packaging Company. Estonia: Tartu University Press.
Maddala, T., A. P. Kathryn, and J. Reed. 2003. An experiment on simplifying conjoint analysis designs for measuring preferences. Health Economics 12 (12): 1035-1047. Klein, N.2000. No Logo, Taking Aim at The Brand Bullies. Canada: Knpf.
PME-Indonesia.Com. 2008. Warga Tuntut SBY Tegas Soal Lapindo (November 11). RakyatMerdekaOnline. 2010. Gubernur DKI Jakarta Saat Ini Lebih Buruk Dari Gubernur
Sebelumnya (January 11).
Rosko M. D., H. DeVita, W. F. McKenna, and L. R. Walker. 1985. Strategic marketing applications of conjoint analysis: An HMO perspetive. Journal of Health Case Marketing 5: 27-38.
Rubinstein, A. 1998. Modeling bounded rationality. USA: MIT Press.
Schaupp, L. C. and F. Bélanger. 2005. Conjoint analysis of online consumer satisfaction. Journal of Electronic Commerce Research 6 (2): 95-111.
United Nations Framework Convention on Climate Change. 2010. Legal Considerations Relating to A Possible Gap between the First and Subsequent Commitment Periods. FCCC/KP/AWG.
Vivanews.Com. 2010. Jumlah Kendaraan di Jakarta 9,6 Juta (January 12).
Wachernagel, M. and W. E. Rees. 1995. Our Ecological Footprint: Reducing Human Impact On Earth. Canada: New Society Publisher.
WaspadaOnline. 2010. Amin Rais: SBY Selalu Lamban (April 8).
World Bank. 2006. Third Water Supply and Sanitation for Low Income Communities Project (June 2006).