Volume Stability of Bitumen Bound Building Blocks
Thanaya, I.N.A.1)
Abstract: This paper covers results of laboratory investigations on the volume stability of masonry units incorporating waste materials bound with bitumen (Bitublocks), due to moisture adsorption, thermal exposure and vacuum saturation. The materials used were steel slag, crushed glass, coal fly ash, and 50 pen bitumen. The samples were produced in hot mix method, compacted, then exposed to moist and temperature. It was found that moisture adsorption from the environment caused the Bitublock to expand. The samples with less intense curing regime experienced lower expansion and became stable faster, and vice versa. Under thermal condition (at 70°C), the samples with less intense curing regime underwent higher expansion, and vice versa. They were also highly reversible. Their volume stability was found unique under water exposure. The expansion on first vacuum saturation cycle was irreversible, then largely reversible on the following cycles.
Keywords: bitublocks, moisture adsorption, thermal exposure, vacuum saturation, volume stability.
Introduction
Housing industry continuously needs more masonry wall materials in order to meet the increasing demand on housing in many parts of the world. One alternative masonry material is Bitublock, a masonry units incorporating waste materials bound with bitumen. Various types of waste aggregate materials can be incorporated such as steel slag, crushed glass, municipal solid waste incinerator bottom ash (MWSIBA), coal ashes, incinerator sewage sludge ash, etc. Incorporation of waste materials supports the strategy of reducing demand on natural aggregate material [1,2].
Long term durable and stable masonry units are essential. However, there is no masonry material totally stable in various conditions. This is because of the movement that can be caused by temperature, moisture movement, creep, horizontal and vertical deflections etc. Masonry walls (clay bricks and concrete blocks) move both horizontally and vertically due to changes in temperature and moisture content. When a brick wall is heated it gets larger and when it cools it gets smaller. When brick gets wet, it expands. However, when the brick dries it does not shrink completely to its original dimensions, due to the inherent nature of the brick [3].
1 Civil Engineering Department, Faculty of Engineering, Udayana University, Denpasar-Bali, Indonesia.
Email: [email protected]
Note: Discussion is expected before November, 1st 2010, and will be published in the “Civil Engineering Dimension” volume 13, number 1, March 2011.
Received 3 December 2009; revised 20 January 2010; accepted 3 April 2010.
In order to accommodate the movement of masonry walls, a system of movement joints can be made to eliminate cracks and the problems they cause. Movement joints can be designed by estimating the magnitude of the several types of movements which may occur in masonry and other building materials. The way to minimize risk of cracks is to make the length of the walls meeting at the corner short by placing control joints near the corner. Cracks can also occur on two long perpendicular walls, on walls with wide, tall and long sizes. The size of the control joint or expansion joint can be estimated from the volume stability properties of the materials and the type of sealant used [3].
The objective of the investigation was to study the volume stability (expansion and shrinkage) of Bitublocks due to moisture adsorption, thermal exposure and vacuum saturation.
The Material Used
Previous works by the author incorporated various waste materials, namely steel slag, crushed glass, coal fly ash, coal bottom ash, municipal solid waste incinerator bottom ash, and incinerator sewage sludge ash [2,4]. In this paper the type of Bitublocks investigated were the one that incorporated steel slag, crushed glass and coal fly ash. The properties of the materials selected are shown in Table 1. The material proportion which was based on modification of aggregate grading for hot rolled asphalt [5] is shown in Table 2.
coating, waste aggregates with lower absorption properties is used for this investigation.
Table 1. The properties of the aggregate materials
Materials Density (gr/cm3)
Water Absorption (%)
Coarse aggregates (CA)
Steel slag 3.39 1.9
Crushed glass 2.51 < 0.5 Fine Aggregates (FA)
Crushed glass 2.51 < 1
Filler Fly ash Ferrybridge 2.16 -
Table 2. Proportion of aggregate used
Aggregates % Materials
Coarse aggregates:
In principal all types of bitumen (hard/penetration grade or bitumen emulsion) can be used as a binder. However, it is preferable to use softer grade bitumen as this requires a lower handling temperature. Also, as the samples will be heat cured in order to improve their resistance to long-term deformation, the use of harder grade bitumen would not provide a significant improvement to the end product [2]. The type of bitumen used for this investigation was 50 penetration grade (50 pen or 40/60 bitumen) with a specific gravity of 1.03 and a softening point of 47°C. This bitumen was used as it is widely available, hence ease of supply in the United Kingdom, where this research was done.
Production of the Mixtures
The manufacture of Bitublock has been reported previously [1]. Briefly, to facilitate mixing the aggregate materials and the 50 pen bitumen were pre-heated at 160-180 °C for 3 hours [6]. The loose mix was then placed in a mould and compacted. The size of the samples was 100x100x65 mm.
Following compaction, the Bitublock samples were cured in an oven. Curing regime had previously been found to play a very significant role. When using a 50 pen bitumen and cured at 160°C, the curing duration required to satisfy creep performance was 72 hours [2]. In order to reduce curing duration, in this investigation the samples were cured at 200°C for 24 hours and was found to give satisfactory results (creep test result, i.e. les than 100 microstrain) [2,11].
The performance of Bitublock is influenced by porosity and the heat curing regime. A lower porosity
(higher compaction), improves aggregate interlock which increases the potential compressive strength. However, more efficient heat curing (at higher porosity–greater depth of bitumen oxidation/ hardening) improves the long-term stability of Bitublock (i.e. reduces the creep potential). In this investigation, the curing regime was fixed and the compaction level applied was 1, 2 and 4 MPa, and bitumen content was varied from 5 to 6.5% with 0.5% increment. The bitumen content and compaction level were determined based on the minimum content and lower compaction level but yet gave satisfactory results. It was found that compaction level of 2 MPa and bitumen content of 6% was adequate [7].
The Properties of the Bitublocks
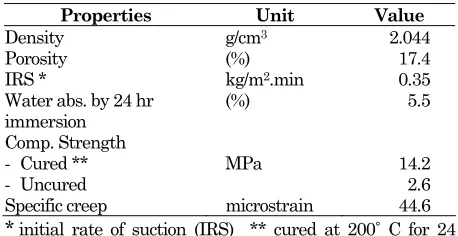
The Properties of the Bitublocks that gave satisfactory results are shown in Table 3 [4].
Table 3. The properties of the mixtures at 6% bitumen content, compacted at 2 MPa.
Properties Unit Value
Density g/cm3 2.044 Specific creep microstrain 44.6
* initial rate of suction (IRS) **cured at 200˚ C for 24 hours
Referring to Table 3, the initial rate of suction (IRS) test was carried out by immersing the sample in 3 mm depth of water for 60 second. The weight of water absorbed by the sample was then calculated and divided by the area in contact with water [8]. IRS is a parameter that can provide an indication of the effect of the unit on the sand cement mortar. Units with high IRS require very plastic mortar (high water/cement ratio), while units with lower IRS need stiffer mortar [9]. The IRS values of the Bitublock were found at lower range compared to IRS values for clay brick found in the United Kingdom (between 0.25-2.0 kg/m2/min). Low IRS
values were obtained because the aggregates were evenly coated by bitumen which has hydrophobic character. This suggest that the Bitublocks tested in this experiment would require stiffer mortar.
Stra
in (m
icros
tra
in)
The Size of the Samples for the Expansion Test
Inspired by the intention for knowing the effect of different heat curing regime applied on the expansion of the samples, thinner samples were produced with size 100x100x35 mm (Figure 1). With thinner samples, more severe heat curing effect to the samples would occur.
Figure 1. The samples for the moisture adsorption (MA) test.
Expansion Due to Moisture Adsorption (MA) at Room Environment
The author had done MA test on cured samples, and found that the volume stability (expansion) of the Bitublocks was affected by environment relative humidity (RH). The samples gave larger expansion at higher RH and vice versa [4].
For the MA test in this investigation, the samples were tested at the same relative humidity, and were prepared as: uncured, 12 hours and 24 hours cured in oven at 200°C. After heat curing, a pair of Demec point was pasted on the samples by means of super glue (on each of the four vertical faces). The strain was measured using a 50 mm Demec gauge as shown in Figure 2.
It was meant to carry out expansion tests at an actual environment condition, where the temperature slightly changed (21 ± 1°C), and the relative humidity (RH) fluctuated (54 ± 4% RH).
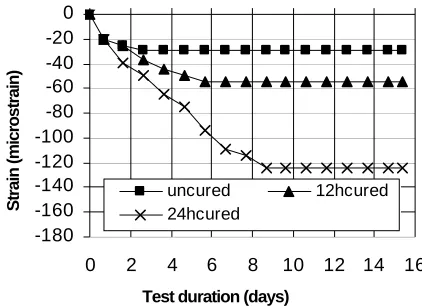
The results of the MA test are presented in Figure 3. In order to distinguish results on volume stability, in this paper strain due to expansion movement is given negative values, and strain due to shrinkage is given positive values. It is shown that the expansion and time required to stabilize are in line with the curing regime. The uncured sample underwent lowest expansion and stabilized fastest, and vice
versa. The samples heat cured for 24 hours required about 9 days to stabilize. The results suggested that the expansion was due to moisture absorption from the environment. The sample with longer (more intense) curing regime would be drier hence adsorbed more moisture; therefore it gave higher expansion and require longer time to become stable.
Figure 2. The 50 mm Demec gauge set.
-180 -160 -140 -120 -100 -80 -60 -40 -20 0
0 2 4 6 8 10 12 14 16
uncured 12hcured
24hcured
Test duration (days)
Figure 3. The expansion on the first MA test (21 ± 1°C and 54 ± 4% RH).
Thermal Expansion at 70°C
samples: uncured, 12 hours, and 24 hours cured at 200 °C were subjected to thermal expansion test at 70 °C as described in the following sections.
Sample Preparation
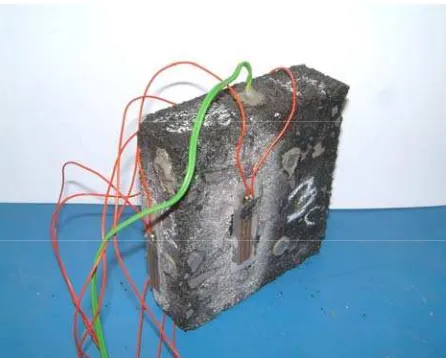
The expansion was monitored using electric resistant strain (ers) gauges. Before pasting the ers gauges, a thin layer mixture of chemical plastic padding glue paste and hardener was applied onto certain area of the sample. The glue paste was left to dry for 15-20 minutes, then smoothened using a piece of sand paper. After that the smoothened surfaced was cleaned with cleaning solvent, then the ers gauges were stuck (on four faces of the samples in vertical direction) by means of a transparent super glue. Into one of the three samples, a thermocouple was inserted to monitor the temperature within the core of a sample as shown in Figure 4. Then electric cable was welded to the ers gauges and connected to an Orion data logger, then the samples were put into an air circulated and temperature controlled oven, as shown in Figure 5.
Figure 4. Preparation of sample completed with ers gauges and a thermocouple.
Figure 5. Strain measurement by means of ers gauge recorded by a data logger and computer.
The Thermal Expansion Test at 70°C
The test was run for three cycles using a timer. The heating time was set for two and a half hours, which was found sufficient to reach a heat of 70°C in the core of the sample. The cooling time was set for 6 hours to ensure sufficient time to achieve room temperature as the door of the oven was kept closed. The strain data was electronically and automatically recorded every 15 minutes. The temperature profile during the test is shown in Figure 6.
The thermal expansion test results of the uncured, 12 hours cured, and 24 hour cured samples are presented in Figures 7, 8 and 9 respectively.
0 10 20 30 40 50 60 70 80
0 4 8 12 16 20 24 28
Test duration (hour)
T
em
p
er
at
u
re
(
d
e
g
C
)
Figure 6. The temperature profile of the thermal expansion test.
-2000 -1500 -1000 -500 0 500 1000 1500 2000
0 4 8 12 16 20 24 28
Test duration (hour)
S
tra
in
(
m
ic
ro
s
tra
in
)
f1 f 2 f3 f4
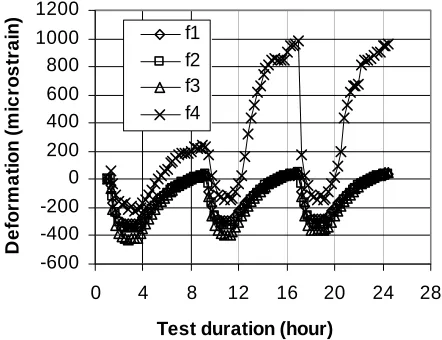
Figure 7. The thermal expansion of the uncured sample.
-600
Figure 8. The thermal expansion of the 12 hour cured sample.
Figure 9. The thermal expansion of the 24 hour cured sample.
All ers gauges on the test results as shown in Figure 9, gave a reasonable trend with result on face1 (f1) much smaller than others. If the rest of the results were averaged, the expansion was about 220 microstrain.
Highest expansion occurred on the uncured samples. This is due to the nature of the uncured bitumen when exposed to intense heat. Larger portion of the volatile component of the bitumen were forced to be evaporated, that resulted in larger expansion. The samples that had been heat cured before they were subjected to thermal expansion test, underwent less asphalt component evaporation; hence less expansion occurred compared to the uncured samples. This matter is shown in Figures 7 to 9 where the samples that had been given heat curing regime before they were subjected to thermal expansion test, gave lower expansion. The samples that had been heat cured for 24 hours gave less expansion than the samples cured for 12 hours, as had been described in the previous paragraphs.
Figure 9 revealed that the coefficient of thermal expansion of the 24 hour cured samples was between 180-200 microstrain (10-6) per 70°C or about 2.6-2.9
x10-6/°C, which is lower than the coefficient of
thermal expansion of clay bricks: 4.5 to 7.2 x 10⁻⁶ /°C,
and of concrete masonry unit: 7.2 to 9.0 x 10⁻⁶/°C [12].
This means that the Bitublock would give a relatively lower expansion (more stable).
In general the results indicated that the volume expansion due to heat exposure was highly reversible.
Expansion due to Thermal (110°C), Vacuum Saturation, and Air Drying Cycles
The samples used within this experiment were two cured (200°C for 24 hours) thin samples, similar to the one shown in Figure 1. Every cycle of strain reading/measurement of the samples were done using a 50 mm Demec gauge, with timing of strain reading step as mentioned below.
a. Initially strain reading was done at room temperature (21± 1°C and relative humidity (RH) of 54 ± 4%).
b. After heating at 110 ± 5°C for 2 hours.
c. After cooling down over night (20-22 hours) in room environment.
d. After vacuum saturation (total time of 1.5 hours, with detailed procedure described on the next sub section: Vacuum Saturation Process).
e. After air drying over night (20-22 hours) in room environment. This is the end of the first cycle (coded step a1 to e1). The step e1 of the first cycle became step a2 for the start of the second cycle, and then strain reading step b2 to e2 were continued. The same procedure was applied for the following cycles.
After each of the strain measurement the samples were weighed. During air drying, the samples were put above three layers of paper towel for absorbing their water content (with position similar to Figure 1).
The heating temperature of 110 ± 5 °C was selected in order to ensure that the water adsorbed by the samples could be totally dried out within a short time (2 hours).
Vacuum Saturation Process
Figure 10. The vacuum saturation equipment.
Hose and connectors
Hose Valve
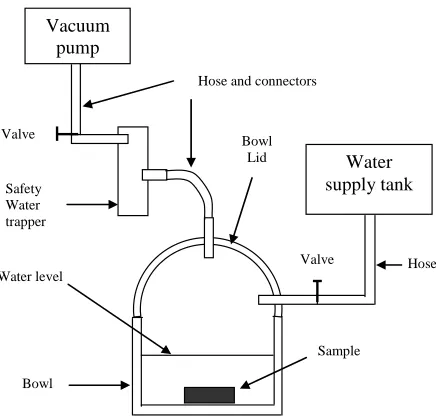
Figure 11. Diagrammatic representation of the vacuum saturation equipment.
The vacuum saturation was done by utilizing equipment as shown in Figures 10 and 11. The equipment consists of a bowl with its lid, a water supply tank, and a vacuum pump completed with a safety water trapper and a valve. They are connected with plastic hose and connectors.
The vacuum saturation was done in the following procedure. Initially the sample was placed in the bowl and vacuumed without water for 30 minutes, then water was supplied by releasing the water valve until the sample is fully immersed. The immersed sample was then vacuumed for a further 30 minutes. This process sucks out air bubbles trapped within the samples, which cause intense water penetration into the samples. After that they were left soaked for 30 more minutes. The total process required one and a half hour.
The lowest vacuum pressure that can be applied in line with the equipment used was 70-80 kPa. This
pressure is far larger than 5 kPa (50 mbar) recommended in the BS 812, for evacuating the trapped air bubbles in testing the density of filler [14].
It had been experienced by the author that in line with the nature of the samples (with 15-20% porosity), the effectiveness of the vacuum saturation test method mentioned above was found equal to the water absorption value obtained by water immersion for 24 hours as shown in Table 3. So this method gave a significant time saving.
Figure 12 shows weight change profile of the samples during thermal, vacuum saturation, and air drying cycles in line with procedure mentioned earlier (step a to e) of each cycle. The vacuum saturation caused water adsorption of around 6%. There was no significant weight change occurred during thermal exposure of the samples.
Referring to Figure 13, the first five data points were the results of the first strain reading cycle (step a1 to e1), with sequences as described the first paragraph of this section.
Test duration Day -2
Figure 12. Weight change profile of the samples during thermal, vacuum saturation, and air drying cycles.
-2800
Figure 13 shows that after step d1 (after vacuum saturation), then step e1 (air drying) of the first cycle, the samples underwent large portion of permanent (irreversible) expansion. This matter was found unique. Effort had been made, but no similar results yet obtained for comparison from other researchers. From the second and the following cycles, the samples gave almost constant/regular expansion and shrinkage pattern.
Due to water exposure (vacuum saturation and expansion during air drying), the Bitublocks, on the first cycle the samples expanded to around 1000 microstrain (10-6), i.e. from step c1 to e1, then on the
following cycles (c2 to e2 and so on), it expanded between 400-500 microstrain (10-6). This moisture
expansion is comparable to clay bricks moisture expansion of 280-6000x10-6 [12, 15].
In addition to the results shown in Figures 7, 8, and 9; Figure 13 also revealed that the Bitublocks were highly reversible due to thermal exposure. The expansion due to vacuum saturation on the first cycle was found totally irreversible, but largely reversible on the following two cycles. This volume stability behaviour of the Bitublocks was found unique.
It was also found interesting that during over night air drying after vacuum saturation, regardless of moisture loss (Figure 12) the Bitublocks experienced expansion.
The expansion occurred due to the effect of moisture. This suggests that the volume stabilities of the Bitublocks were in line with the mechanism of shrinkage and swelling in concrete technology. Free water surfaces in the capillary will be in surface tension. When water evaporates due to a lowering of ambient vapour pressure, the surface tension increases and causes increases of tensile stress. This will be balanced by compressive stresses in the surrounding solid which results in shrinkage [16]. The cause of shrinkage shall be sought in the physical structure of the gel rather than in its chemical and mineralogical character [17].
Meanwhile, due to adsorption of water molecules onto the surface of the particles reduces the surface energy, hence reducing the balancing internal compressive stress leading to volume increase or swelling [16]. During water absorption, the water molecules act against cohesive forces and tend to force the cement gel particles further apart. The ingress of water also decreases surface tension, and results in swelling [17].
Conclusions
Considering the results and the analysis, some conclusions can be drawn:
a. At environment condition, the samples with less intense curing regime experience lower expansion and became stable faster, and vice versa. The results suggest that the expansion was caused by moisture adsorption from the environment.
b. Under thermal condition (at 70°C cycles), the samples with less intense curing regime, underwent higher expansion, and vice versa. c. Thermal expansion of the Bitublocks was found
highly reversible, with coefficient of thermal expansion slightly lower than clay brick and concrete masonry block.
d. The volume stability of the Bitublocks was found unique under water exposure. The expansion on first vacuum saturation cycle was irreversible, then largely reversible on the following two cycles.
f. The moisture expansion of the Bitublocks was comparable to clay bricks
Acknowledgment
The author would like to express his gratitude and appreciation to the Engineering and Physical Sciences Research Council (EPSRC)-United Kingdom for providing funds, and to his research supervisors Dr. S.E. Zoorob and Dr. J.P. Forth who had given guidance during the author’s post doctoral research at The School of Civil Engineering, Leeds University-United Kingdom, in the year of 2004-2007.
References
1. Forth, J.P., Zoorob, S.E., Thanaya, I.N.A., Development of Bitumen-Bound Waste Aggregate Building Blocks, Proceedings of the Institution of
Civil Engineers, Construction Materials, 2006,
Volume 159, Issue1, Thomas Telford-London, February 2006, pp 23-32.
2. Thanaya, I.N.A., Forth, J.P., Zoorob, S.E., Incorporation of Fly Ash and Furnace Bottom Ash in Bitublock, Proceedings of AshTech, 2006, International Coal Ash Technology Conference, The Birmingham Hippodrom Theatre, Birmingham, West Midlands, UK, Sunday 15th –
Wednesday 17th May 2006, ISBN CD-Rom
0-9553490-0-1, 978-0-9553490-0-3, Editted by Dr. Lindon Sear, Paper ref: A16.
3. Brick Industry Association (BIA), Technical Notes
4. Thanaya, I N.A., Building Blocks Incorporating Waste Materials Bound With Bitumen, The Civil
Engineering Dimension, Petra Christian
University, Surabaya, Indonesia, Volume 12, no 1, March 2010., pp. 36-43.
5. British Standard (BS) 594-1, Hot Rolled Asphalt
and Other Pave Areas, Part 1, 2003.
6. Whitheoak, The Shell Bitumen Handbook, 1991.
7. Forth, J.P., Zoorob, S.E., Thanaya, I.N.A., The Time-Dependent Performance of Bitublock Single Leaf Masonry, CD Proceedings of 14th
International Brick and Block Masonry
Conference, Manly Pacific Hotel, Sydney,
Australia, 17-20 February 2008, Session 9A: Masonry Durability, 14IBMAC_192.pdf.
8. British Standard (BS) 3921, Specification for Clay Bricks, 1985.
9. Vekey de, R.C., Brickwork and Blockwork, Construction Materials, Their Nature and
Beahviour, Third Edition, Editted by J.M. Illston
and P.L.J. Domone, Spon Press, London and New York, 2001.
10. British Standard (BS) 6073-1, Precast Concrete
Masonry Units, 1981.
11. Tapsir, S.H., Time-Dependent Lost of
Post-Tensioned Diaphragm and Fin Masonry Wall,
PhD Thesis, Civil Engineering Department, University of Leeds, UK, 1985.
12. Drysdale, R. G., Hamid, A. A., and Baker, L. R.,
Masonry Structures: Behaviour and Design,
Prentice-Hall, 1994.
13. Wilson, M. A., Carter, M. A., and Hoff, W. D., British Standard and RILEM Water Absorption Tests: A critical evaluation, Journal of Materials
and Structures, Vol. 32, October 1999, pp.
571-578.
14. British Standard (BS) 812, Testing Aggregates, Part 2: Methods of Determination of Density, 1995.
15. Advance Structural Design (ADS), How do I
Design Joints in Brickwork and other Masonry?,
2007, http://www.structuraldesigns.com.au/FAQs/
Masonry/How%20do%20I%20design%20Expansion%
20Joints.htm, Visited: 21-09-07.
16. Domone, P.L., Part Three: Concrete, In Construction Materials Their Nature and
Behaviour, Edited by J.M. Illston, Second
Edition, E&F Spon, 1994.
17. Neville, A.M, Properties of Concrete, 3rd Edition,