Issues
ISSN: 2146-4138
available at http: www.econjournals.com
International Journal of Economics and Financial Issues, 2018, 8(1), 1-8.
Effect of Investment on Employment in the Formal Small Industries
In the District/City of South Sumatra Province, Indonesia
Saadah Yuliana
1, Bernadette Robiani
2, Mukhlis
3*
1Department of Economic, Economic Faculty, Sriwijaya University, South Sumatra, Indonesia, 2Department of Economic, Economic Faculty, Sriwijaya University, South Sumatra, Indonesia, 3Department of Economic, Economic Faculty, Sriwijaya University, South Sumatra, Indonesia. *Email: [email protected]
ABSTRACT
This study aimed to analyze the effect of the investment on employment in the formal small industries in the district/city of South Sumatera Province. The data used are secondary data obtained from the publication of the Department of Industry and Trade of South Sumatera Province. The analytical
method used is a quantitative analysis of panel data regression analysis equipment. The results showed that investment signiicantly positive effect
on employment in the formal small industries in the district/city of South Sumatera Province.
Keywords: Investment, Employment, Formal Small Industry
JEL Classiication: L00
1. INTRODUCTION
Development in developing countries is generally focused on the economic development. This is because economic development can support the achievement of objectives and encourage the
development of other ields. Economic development is also a
multidimensional process that covers the transformation process marked by changes in the economic structure and framework in
the economic structure of society (Todaro and Smith, 2003).
The process of economic development in a country naturally leads to equal opportunities for all kinds of economic activities, including industries of all sizes. Small-scale industries, especially in developing countries is often associated with problems of economic and social poverty, unemployment, unequal distribution of income, the process of uneven development, and urbanization. The existence or growth of the small-scale industry is expected to contribute positively to the reduction efforts of these issues.
One way to implement the overall economic development and sustainable by increasing investment. Investments in essence
are also the irst step in economic development. Investment
is an important factor for economic growth and development
(Mipango, 2015). Rizvi and Nishat (2009) state that the very
important and sensitive thing in developing countries is the
foreign direct investment (FDI). Currently the FDI not only the transfer of money but a combination of inancial and intangible
assets such as technology, managerial ability, marketing skills
and other assets. Meanwhile Matthew and Johnson (2014) stated
that on one side of FDI in a will add new resources with regard to capital, technology, managerial capabilities and technical skills in the country concerned, and another side foreign investment may as “imperialistic predators” that would exploit the country and would make political and economic dependency.
Investment is a component of aggregate demand, investment also has a role in production capacity in the economy. The amount of
production capacity in the economy can be relected by the many
businesses in the economy, both large-scale enterprises,
medium-scale, micro, and small-scale enterprises. Pettinger (2017) stated
that the investments affect economic growth, because investment is a component of aggregate demand, and more importantly that the investment would affect production capacity in the economy.
successful achievement of the welfare state can be measured by the ability in solving various problems, including the problem of employment. This is in line with one of the main objectives of
development, namely the creation of new jobs in suficient quantity
and quality to be able to absorb the additional labor force continued to enter the labor market.
The number of workers absorbed by the economic sector can describe the absorptive capacity of that sector of the workforce. Likewise, the small-scale industry in Indonesia, its existence has a strategic role in the national economy that is as one important source for increasing employment opportunities.
Indonesian government’s attention to the development of
small-scale industry has been started since the 70s. This is relected in the many programs of development of small-scale
industries by the government such as the small investment credit; permanent working capital loans; national movement partnership; empowerment of micro sector, small and medium enterprises; smallholder credit program, etc.
As shown in Table 1 based on Constitution No. 20 of 2008 about micro, small and medium enterprises, there are several criteria
scale enterprises can be classiied into micro, small businesses,
and medium-sized businesses as follows:
A microenterprise is a productive enterprise belonging to individuals and/or individual business entity, has a net worth of
at most 50 million rupiahs excluding land and buildings, and has annual sales of up to 300 million rupiahs. Small businesses are
productive economic activities that stand alone, carried out by an individual or business entity that is not a subsidiary or branch of the company is not owned, controlled, or be a part either directly or indirectly from medium or large business; have a net worth
of more than 50 million rupiah up to at most 500 million rupiah;
excluding land and building or have an annual sales turnover of
more than 300 million rupiah up to 2.5 billion rupiah.
Medium-sized businesses are productive economic activities that stand alone, carried out by an individual or business entity that is not subsidiaries or branches of companies owned, controlled, or be a part either directly or indirectly with small business or big
business; have a net worth of more than 500 million rupiah up to a maximum of 10 billion rupiah excluding land and buildings or having an annual sales turnover of more than 2.5 billion rupiah up to at most 50 billion rupiah (Ministry of Cooperatives of the Republic of Indonesia, 2011).
Micro, small and medium enterprises is one of the strategic sectors
of the Indonesian economy. This is relected in the employment by the sector. In 2012 the number of workers in the sector of micro,
small and medium enterprises as much as 107.6 million workers, or about 97% of the number of workers in Indonesia (Abidin, 2015). In 2016, the presence of small micro-enterprises in the province of South Sumatra able to absorb as much as 1,796,639 workers (CBS, 2017).
Indonesia is an archipelago with a very wide area. Based on the
growth of the central division of the industrial area, South Sumatra Province entered the zone of regional industrial growth center. This brings the consequence that South Sumatra province need to undertake the development of the industrial sector, including the development of small industries. The industrial sector in the province of South Sumatra, especially formal small industry is divided into
the business ield of the food industry; clothing and leather industries
of rubber; chemical industry and building materials; metal industry and services; as well as the craft industry and the public.
Relating to small industries, employment and investment, a phenomenon in South Sumatra Province in 2016 showed that of the 11229 units of small industries formal scattered in 17 districts/ city as much as 67% were in 6 districts/city is the Palembang city; MUBA district; Muara Enim district; East OKU district;
Pagar Alam city; and Lubuk Linggau city. Likewise, the number
of workers, of which there are 60006 workers in the formal small industries, as many as 61% are in the 6 district/city. Meanwhile, of the total investment of formal small industry in 2016, as much as 40.7% or 913.1 billion were in 6 district/city.
The above phenomenon different from the situation in 2011
which showed that employment in the formal small industry in
Palembang city; MUBA district; Muara Enim district; East OKU
district; Pagar Alam city; Lubuk Linggau city absorb as much as
60.2% of the total workforce in this sector. Meanwhile, the value of investments in 6 district/city in 2011 amounted to 80.5% of
total investment in the formal small industry sector.
Thus during the period 2011-2016 a significant decline in
investment in formal small industries in 6 districts/cities, namely
from 80.5% in 2011 to 40.7% in 2016. The absorption of labor relatively ixed from 60.2% in 2011 to 61% in 2016. This situation
is interesting to study in order to determine the relationship between investment and employment.
2. LITERATURE REVIEW
Economic development in addition to addressing socio-economic problems, as well as to improve the welfare of the community. The successful achievement of the welfare state can be measured by the ability in solving various problems, including the problem of
Table 1: Criteria for micro, small and medium enterprises
Businessmen Net worth (rupiah) Annual sales results (rupiah)
Microbusiness Small business Medium enterprises
Up to 50,000,000 >50000000-500000000 >500000000-10000000000
Up to 300 million >300000000-2500000000 >2500000000-50000000000
employment. Employment is one important factor in overcoming the problem of employment.
Employment is a fundamental aspect of human life, as it includes economic and social dimensions. Employment is the number of people that can be accommodated to work in a business unit or job. Employment will accommodate all workers when business
units or jobs would be suficient or balanced with the number of
the existing workforce.
Investment is an investment activity on a variety of economic
activities (production) in the hope to gain an advantage in the future. Investments, in essence, are also the irst step in economic
development. Investment is an important factor for economic
growth and development (Mipango, 2015).
The economic theory stated that investment as expenditures for the purchase of capital goods and production equipment for the purpose of replacing and especially add modal goods in the economy that will be used to produce goods and services in the
future (Sukirno, 2010).
Investment activity allows a society constantly increase economic activity and employment, increase national income and improve the welfare of society.The role of such investments come from three important functions of investment activity is the investment is one of the components of aggregate expenditure so that the increase in investment will increase aggregate demand, national income, and employment opportunities. Added capital goods as a result of the investment will increase production capacity; Investment is always
followed by the development of technology (Riezky, 2013).
Investment has an important role in employment, because of the investments will create employment opportunities, and in turn will be able to absorb the labor force. Dewi and Sutrisna
(2015) concluded that investment signiicantly and a positive
effect on employment through economic growth. The increase in employment is done by increasing investment in labor-intensive
industries. In line with these studies is Bustam (2016) found that
the investments in micro, small and medium enterprises have a
signiicant effect on employment.
3. THEORETICAL FRAMEWORK
One way to implement the overall economic development and sustainable by increasing investment. This is because investment
is the irst step of a production activity.
The number of workers absorbed by the economy can describe the absorptive capacity of the sector of the workforce. Likewise, the small-scale industry in Indonesia, its existence has a strategic role in the national economy that is as one important source for increasing employment opportunities.
Investment in the formal small industry will increase the production process and make the production process requires human labor, so the company will require additional manpower. This shows that the investment is an important variable in increasing employment.
4. MATERIALS AND METHODS
This study analyzed the effect of the investment on employment
in the formal small industry. Researchers conducted an empirical
study on the object of research is districts/city in South Sumatera
Province of Indonesia in 2006-2016.
The study population was 17 districts/cities, while the study sample
as many as 35% of the population, or as many as 6 districts/city. The 6 districts/city comprises 3 districts areBanyuasin; Muara Enim; Ogan Komering Ulu; and 3 cities are Palembang; Pagar
Alam; Lubuk Linggau. Location of research on those district/ cities that has a number of formal small industry relatively large compared with other district/cities.
This study uses quantitative analysis. To analyze the effect of the investment on employment in the formal small industry use panel
data regression. As the data analysis unit sides cross (cross-section) is 6 district/city and time series data (time series) in the period 2006-2016. The reason for the use of cross-section data is to better
understand the behavior of employment in each district/city. In general, the research model expressed in the equation:
Y=f(X) (1)
Where, Y is a labor, and X is an investment.
The labor force is deined as the amount of labor that exist in formal small industries in each district/city, this also relects the
value of the variable employment.
Investment is deined as the value of the investment per year in
formal small industry in each district/city.
Equation (1) above can be expressed in the econometric equation
as follows:
Yit=α0+α1Xit+eit (2)
Where,
i=district/city to i, where i=1,…, 6
t=year to t, where t = 2006,…, 2016
Equation (2) is a common form of panel data regression equation.
In the panel data regression known 3 estimation method, namely
common effects, ixed effects and random effects. Effects common
methods performed by combining all the cross-section data and time series irrespective of differences in the two types of data. This
Fixed effects method assumes that inter-unit cross section (in
this study, namely district/city) has an average value of different
employment. It will be represented by the difference between the value of the intercept district/city. Fixed effects model identical to the dummy regression model. Fixed effects model in this study can be stated as follows:
Yit=α0+α1Xit+α2D1 α3D2+α4D3+ α5D4+ α6D5+eit (3)
Where D1=1, for Musi Banyuasin; D1=0, for another districts/city; D2=1, for Muara Enim; D2=0, or another districts/cities; D3=1, for
OKU Timur; D3=0, for another districts/cities; D4=1, for Pagar Alam; D4=0, for another districts/cities; D5=1, for Lubuk Linggau; D5=0, for another districts/cities.
Random effects method is a panel data estimation where possible residual interrelates time (t) and an individual (t). At random
effects method assumes that the intercept is a random variable. The regression equation for a method of random effects when expressed in this study are:
Yit=(α0+μi)+α1Xit+eit (4)
Yit=α0+α1Xit+ei+μi (5)
Where, eit=Residual overall (combined cross section and time
series); μi=Residual individually which is a random characteristic
of the ith observation unit and ixed all the time.
In order to choose the most appropriate model, there are some
testing: Chow test; Hausman test; and Breusch-Pagan test or Lagrange Multiplier (LM) test.
Chow test is a test to determine the model of the Common Effects
or Fixed Effects are most appropriate for estimating panel data;
(2) The Hausman test (Hausman and Wise, 1978) is a statistical test to determine the model of ixed effects or random effects are most appropriately used in estimating panel data; (3) LM test
used to test whether common effects or random effects are most appropriately used in estimating panel data.
5. RESULTS AND DISCUSSIONS
Micro, small and medium enterprises is a strategic sector and potential in Indonesia, so the government is trying to continue
to maintain its growth. Business operators choose the micro,
small and medium enterprises due to several reasons such as: Does not require capital that is too large, the technology used is relatively simple, and in terms of labor does not always require qualifications specific requirements such as level of education and skills of workers so as to absorb the force working optimally.
5.1. Formal Small Industry in District/City of South Sumatra Province
Formal small industry in the district/city of South Sumatera
Province are grouped into ive, namely products produced by the
food industry; clothing and leather industries of rubber; chemical
industry and building materials; metal industry and services; as well as the craft industry and the public.
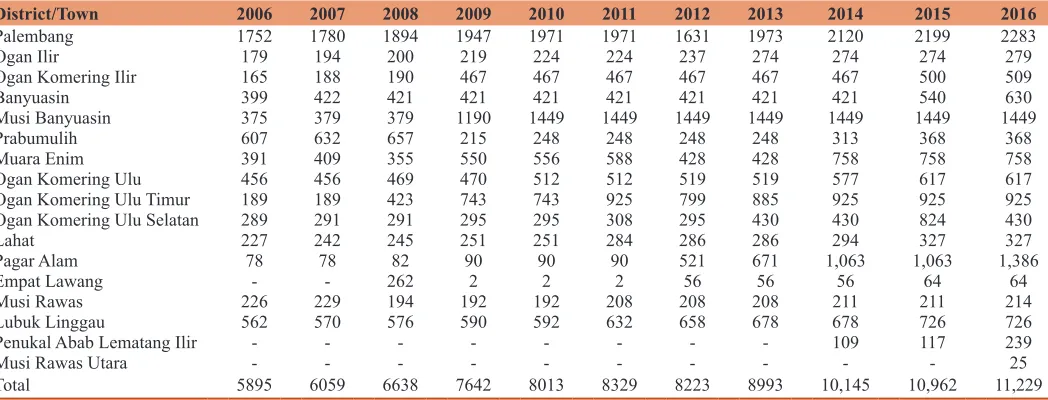
As shown in Table 2, palembang, MUBA, and Pagar Alam is a district/city having a number of formal small industry business
over a thousand units in 2014-2016. During from 2006 to 2016
Palembang is a district/city by the most number of formal small
industry, average 24.2% of total formal small industry in the
province of South Sumatra. Palembang has a large number of small industries because Palembang is the capital of the province due to more quickly receive the innovation and new things from outside the region, especially from Java to further developed in Palembang.
District of MUBA in 2009 has signiicant growth in the formal small industry that is equal to 214 percent compared to 2008. The number of formal small industry increased again in 2010 amounted to 21.8% compared to 2009 but after that the numbers stagnant at 1449 units. Stagnantly number of small industries in this district indicate that the MUBA society during 2010 to 20116 uninformed about new things, and lack of innovation of
new products.
Pagar Alam has signiicant growth in 2012, namely from 90 units in 2011 to 521 units in 2012. Likewise in 2014 nominally signiicant growth that is from 671 business units in 2013 to 1063 units in 2014. The signiicant growth of business formal small industry in Pagar Alam in 2012 and 2014 because this area began much
visited by tourists, especially to enjoy nature.
The number of formal small industry in East OKU district is signiicant growth in 2008 and 2009 but decreased in 2012, increased again in 2013 and 2014. The number of formal small industry in East OKU district stagnant as much as 925 units during 2014 to 2016. The luctuation formal small industry growth in East OKU, due to this relatively new area became a separate district with OKU district, so the economy is not yet stable condition.
Number of formal small industry in MuaraEnimis luctuating growth over the period 2006-2013, but there was a signiicant increase in 2014. LubukLinggau has a number of formal small industry which continued to increase during 2006-2016, although
the increase is small relatively.
Among the formal small industry in the province of South Sumatera, judging from the number of its business units, the type of industry that dominates is sought in the food industry; chemical industry and building materials; as well as metal industries and
services. In 2011 there were 8329 business units, where as many as 34.9% of the food industry; 32.7% of the chemical industry and buildings; and 21.3% of the metal industry and services. This phenomenon is found also in 2016 where from as many as 11 229 business units, amounting to 34.6% (3,889 units) is the
food industry; chemical industry and building materials businesses
as much as 3384 units or 30.1%; as well as metal industries and services as much as 2,367 business units or 21.1%. Food industries
5.2. Labor in Small Industry Formal in Regency/City South Sumatra Province
Labor is one of the factors of production is very important in producing goods and services. Demand employers or labor against different manufacturers with consumer demand for goods
and services. Consumers buy goods because such goods give satisfaction (utility), while manufacturers employ labor for to help
produce goods and services.
During the 2006-2016 Palembang is an area where small industries
formal absorb the most labor compared with other districts/ cities. This absorption reached over ten thousand people every
year. In 2006 the number of workers in the formal small industry in Palembang is 13669 people (35.8%), and in 2011 nominally increased to 15283 people (32.5%). In 2016 nominally increased again to 18698 people, but the percentage dropped to 31.2%.
This indicates that the workforce in the formal small industry in the city of Palembang in number to dominate from the entire workforce is in formal small industries in the district/city of South Sumatera Province.
All districts/city in South Sumatera Province has a formal small
industry that can create jobs over a thousand people in 2016 unless EmpatLawang (247 persons or 0.4%); Pali District (386 people, or 0.6%); and district of Muratara (248 persons or 0.4%). It is
very reasonable considering the three districts is a new district of the division.
Among the ive groups of formal small industry in the Province
of South Sumatera, judging from the number of workers absorbed, the chemical industry and building materials most labor-intensive, followed by the food industry; metal industry and services; clothing and leather industries of rubber; as well
as the craft industry and the public. In 2016 total labor force absorbed in the formal small industry that is 60006 people. Of these, 34% is absorbed in the chemical industry and building materials, amounting to 33.5% absorbed in the food industry, and as many as 9995 people or 16.7% absorbed in the metal
industry and services, the rest is absorbed in the clothing and
leather industry of rubber (10.5%) and the craft industry and the public (5.3%).
5.3. Investment in Small Industry Formal in District/ City of South Sumatra Province
Investment is a major component in driving the economy. Investments enabling people continuously increase economic activity and employment, increase national income and improve the welfare of society. Investment by the company will affect the expansion of employment opportunities. This is because of the investment it will increase the production process and to make the production process requires human labor, so the company will require additional manpower.
The investment made by all the formal small industries in the district/city of South Sumatera Province nominally show
continuous improvement that is from 133.3 billion rupiahs in 2006, rising to 296 billion rupiahs in 2011, and amounted to 913 billion rupiahs in 2016. Signiicantly increases occurred in 2016 the investment increase of 31% compared to 2015 amounted to 6975
billion rupiahs. Increased investment in formal small industry, once again indicates the economic growth in the district/city of South Sumatera Province.
In 2016 Lahat is a district/city where the formal small industry has the highest investment, that is 396.3 billion rupiah or 43.4%
of the total investment of formal small industries throughout the district/city of South Sumatera Province. Although the highest
investment, but in 2016 Lahat has a number of formal small industrial relatively little as many as 327 business units or 2.9%
of total formal small industry business units. Meanwhile, the
number of workers absorbed in Lahat in 2016 as many as 2254 people or 3.8%. The relatively small number of formal small
industry business units, as well as the relative size of the labor that is absorbed in the small industry, in line with the characteristic of Lahat district as an agroindustry area.
Table 2: Formal small industrial in district/city of South Sumatera Province, 2006-2016
District/Town 2006 2007 2008 2009 2010 2011 2012 2013 2014 2015 2016
Palembang 1752 1780 1894 1947 1971 1971 1631 1973 2120 2199 2283
Ogan Ilir 179 194 200 219 224 224 237 274 274 274 279
Ogan Komering Ilir 165 188 190 467 467 467 467 467 467 500 509
Banyuasin 399 422 421 421 421 421 421 421 421 540 630
Musi Banyuasin 375 379 379 1190 1449 1449 1449 1449 1449 1449 1449
Prabumulih 607 632 657 215 248 248 248 248 313 368 368
Muara Enim 391 409 355 550 556 588 428 428 758 758 758
Ogan Komering Ulu 456 456 469 470 512 512 519 519 577 617 617
Ogan Komering Ulu Timur 189 189 423 743 743 925 799 885 925 925 925
Ogan Komering Ulu Selatan 289 291 291 295 295 308 295 430 430 824 430
Lahat 227 242 245 251 251 284 286 286 294 327 327
Pagar Alam 78 78 82 90 90 90 521 671 1,063 1,063 1,386
Empat Lawang - - 262 2 2 2 56 56 56 64 64
Musi Rawas 226 229 194 192 192 208 208 208 211 211 214
Lubuk Linggau 562 570 576 590 592 632 658 678 678 726 726
Penukal Abab Lematang Ilir - - - 109 117 239
Musi Rawas Utara - - - 25
Total 5895 6059 6638 7642 8013 8329 8223 8993 10,145 10,962 11,229
The greatest investment of the total investments in formal small
industries in the districts/city of South Sumatera Province in 2016
was in the food industry, followed by investment in the chemical industry and building materials, as well as metal industries and services. The value of investments in the food industry amounted
to 577.8 billion rupiahs or 63.3% of total investment. In 2016,
the chemical industry and building materials, as well as metal industries and services have an investment value amounting to
152.4 billion rupiahs (16.7%) and 107 billion rupiahs (11.7%) of
the total investment. The investment of the food industry is large
enough that 63.3% of the total investment, this suggests that the
food industry is an industry that is required by the community to meet their needs.
5.4. Estimation Model
In order to select the best model of panel data regression of the
three approaches used, namely common effects; ixed effects; and random effects then tested Chow; Hausman test; and LM test. The
results are as follows.
5.4.1. Chow test
This test is used to select the model on panel data regression of
choosing ixed effects (ixed effects model) or select common effects (ixed coeficient models). Initial hypothesis of this test is as good ixed effects model with ixed coeficient models (Baltagi, 2005).
As shown in Table 3, chow test show that the value of Chi-square
cross section 0.000<0.05 with 95% signiicance level (α = 5%), then Ho is rejected, therefore, according to Chow test model used is the ixed effects model.
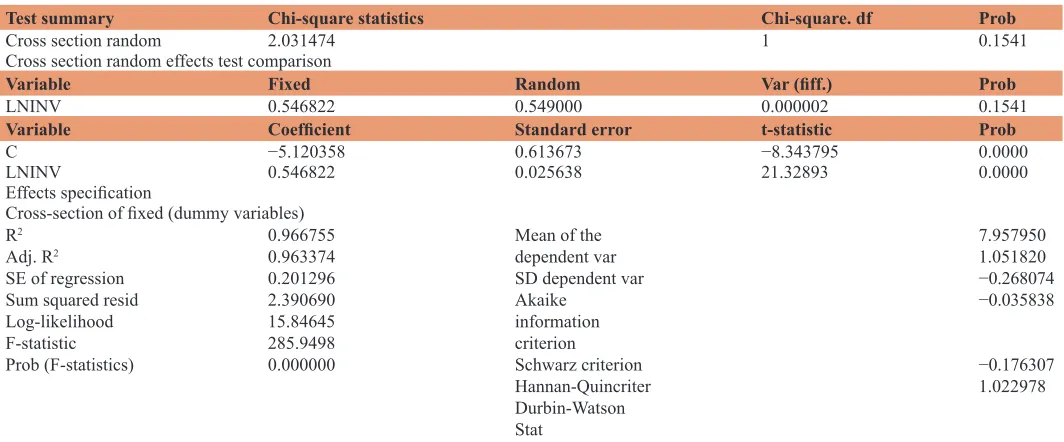
5.4.2. Hausman test
Hausman test performed to select a random effects model or ixed
effects model. The test is to see whether there is a relationship
between the error in the model (composite error) with one or more explanatory variables (independent variables) in the model. Her
null hypothesis is there is no relationship between error models
with one or more explanatory variables (Baltagi, 2005).
As shown in Table 4 Hausman test shows that the value of a
random cross-section of 0.1541>0.05 then the null hypothesis is accepted, so the Hausman test according to the model used is
random effect model.
5.4.3. LM test
LM test is used to ensure that the model will be used. The basis of
the Hausman test is done when the ixed and random test results are not consistent. For example, the Chow test, a suitable model
is the ixed effects model, but at the time of the Hausman test, a
suitable model is random effects model (Table 5).
So as to decide the model that will be used to test the LM.
The LM test indicate that the value of the cross-section of
one-sided Breusch-Pagan at 0.0000 <0.05, the null hypothesis is
rejected, so according to the LM test that the model used in this study is the random effects model.
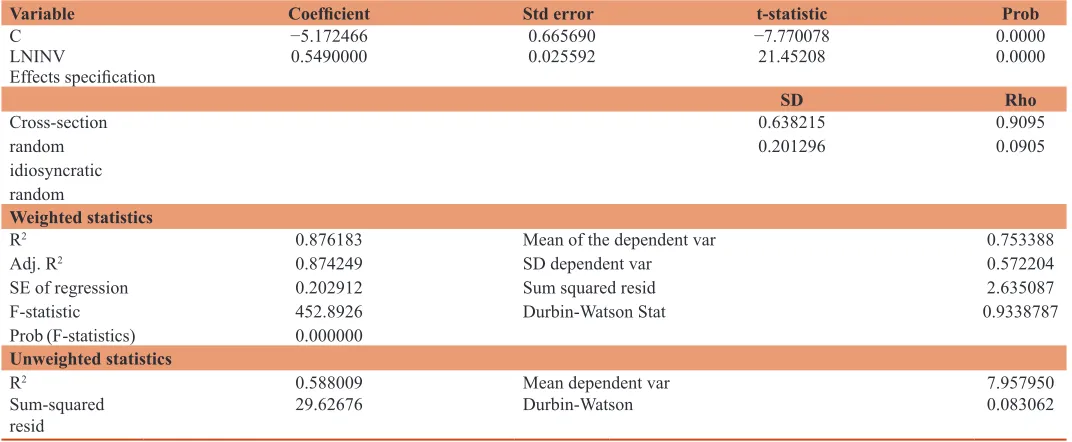
5.4.4.Random effects model
In any part will be showed the Random Effects estimation as
shown in Table 6.
The results of the panel data estimation using Random Effects can
be expressed by the following equation:
LNTK=−5.172466+0.549000 LNINV (6)
Based on the Equation (6) can be analyzed the inluence of the
independent variable on the dependent variable. The average value
Table 4: Hausman test
Test summary Chi-square statistics Chi-square. df Prob
Cross section random 2.031474 1 0.1541
Cross section random effects test comparison
Variable Fixed Random Var (iff.) Prob
LNINV 0.546822 0.549000 0.000002 0.1541
Variable Coeficient Standard error t-statistic Prob
C −5.120358 0.613673 −8.343795 0.0000
LNINV 0.546822 0.025638 21.32893 0.0000
Effects speciication
Cross-section of ixed (dummy variables) R2
Adj. R2 SE of regression Sum squared resid Log-likelihood F-statistic
Prob (F-statistics)
0.966755 0.963374 0.201296 2.390690 15.84645 285.9498 0.000000
Mean of the dependent var SD dependent var Akaike
information criterion Schwarz criterion
Hannan-Quincriter
Durbin-Watson Stat
7.957950 1.051820 −0.268074 −0.035838
−0.176307 1.022978
Source: The estimation results, the data is processed Table 3: Chow test
Effects test Statistics df Prob
Cross Section F
Cross section Chi-square 121.800265160.165679 (5, 59)5 0.00000.0000
of the components to random error (random error component) amounted to 5.172466. A positive sign in the independent variable coeficient indicates that the variable investment has a positive
effect on employment in the formal small industry districts/city
of South Sumatera province with a coeficient of 0.549. This
means that any investment growth rates by one percent will result
in employment increased by 0.549%, while other factors held constant (ceteris paribus).
Marked negative constants mean that if there is no investment there is no employment or labor absorption is zero. This implicitly means that the investment is an important factor affecting employment in the formal small industries in the district/city of South Sumatera Province. Without investment means no production activity, and at the same time, there is no meaningful employment.
Based on estimates in Table 6 the value of the coefficient
determination was 0.87, which means employment variable variation determined by the variable investment of 87%, while the remaining 13% variation of the variable employment in the formal
small industry is determined by other variables to exist in the model.
Figures intercept indicates the estimated coeficient random effects model, which means that the formal small industries in 6 regency/
city location study had the different employment. The difference
of the value of the intercept in each district/city. Here the value of
the intercept each regency/municipal research sites:
Table 7 shows that the value of the highest intercept is Palembang and the low one is Pagar Alam. This shows how much difference the random error component of Palembang and Pagar Alam with an average intercept value of 6 district/city other research areas. This also shows that compared with 6 district/cities the formal small industry in Palembang able to absorb most of the workforce is high, while the formal small industry in Pagar Alam has the employment rate is the lowest.
During the 2006-2016 formal small industry in Palembang able
to absorb the labor force over ten thousand people every year.
In 2006 the number of workers in the formal small industry in Palembang is 13 669 people (35.8%), and in 2011 nominally increased to 15 283 people (32.5%). In 2016 nominally increased again to 18 698 people, but the percentage dropped to 31.2%.
This indicates that the workforce in the formal small industry in the city of Palembang in number to dominate from the entire workforce is in formal small industries in 6 districts/city of South Sumatera Province.
5.4.5. t-test
The t-test is a statistical test equipment to see the partial regression
coeficients of independent variables affect the dependent variable.
The t-test can be seen by comparing the value of the t statistic with t-table or compared the probability of t statistic with the
signiicance level (α = 5%). The hypothesis used in the t-test is
as follows:
Ho: Investment has no signiicant effect on employment in the
formal small industries in the district/city of South Sumatra Province
Ha: Investments have a signiicant effect on employment in the
formal small industries in the district/city of South Sumatra Province
Table 6: Results of estimation random effects model
Variable Coeficient Std error t-statistic Prob
C −5.172466 0.665690 −7.770078 0.0000
LNINV 0.5490000 0.025592 21.45208 0.0000
Effects speciication
Mean of the dependent var SD dependent var
29.62676 Mean dependent varDurbin-Watson
7.957950 0.083062
Source: The estimation results, the data is processed. SD: Standard deviation Table 5: Test LM
Null (no rand. effect) alternative
(0.0000) −1.471000(0.9294) 9.577197(0.0000) King-Wu 15.01520
(0.0000) −1.471000(0.9294) 11.41058(0.0000)
Based on estimates in Table 6 shows that investment has Prob.
t-stat 0.000 <0.05 with 95% signiicance level (α=5%), so Ho rejected and Ha accepted. This may imply that the investment
variables have a significant effect on employment in small industry district/city of South Sumatera Province. Investment is a major component in driving the economy. Investments enabling people continuously increase economic activity and employment, increase national income and improve the welfare of society. Investments made formal small industry in the district/city of South Sumatera Province affect the expansion of employment opportunities.
6. CONCLUSION
The partial test indicates that investment has a signiicantly
positive effect on employment in the formal small industries in the district/city of South Sumatera Province. Labor in the formal small industry in the city of Palembang dominate the entire workforce is in formal small industries in 6 district/city of South Sumatera Province.
The result of the test showed that the variation of the variable
employment by 87% is determined by the variation of the variable investment, while the rest of 13% is determined by a variety of
other variables that are not listed in the model.
7. ACKNOWLEDGMENT
This article’s publication is partially supported by the
UniversitasSriwijaya for Professional Prime Research.
REFERENCES
Abidin, M.Z. (2015), Fiscal Policy and Economic Increasing Role of
Micro, Small and Medium Enterprises. Available from: http://www. kemenkeu.go.id.
Baltagi, B.H. (2005), Econometric Analysis of Panel Data. Chichester:
John Willey & Sons Publishers.
Bustam, N.H. (2016), Effect of number of units, gross domestic product,
investment and micro, small and medium enterprises of the
Indonesian labor absorption in the period 2009-2013. Kutubkhanah: Religious Social Research Journal, 19(2), 250-261.
Central Bureau of Statistics. (2017), Enlistment Results Data Business/ Corporate Economic in 2017, Census 2016 South Sumatra Province. Constitution No. 20. (2008), Micro, Small and Medium Enterprises. Constitution No. 13. (2003), Manpower.
Dewi, N.M.S., Sutrisna, I.K. (2015), The effect of investment and export
to the labor absorption through economic growth. E-Journal of
Development Economics Udayana University, 4(6), 608-745. Hausman, J.A., Wise, D.A. (1978), A conditional probit model for
qualitative choice decisions discrete recognizing interdependence
and heterogeneous preferences. Econometrica, 46, 403-406. Ministry of Cooperatives and Small and Menengah. (2011), Statistics for
Micro, Small and Medium Enterprises.
Matthew, O.H., Johnson, A.A. (2014), Impact of foreign direct investment
on employment generation in Nigeria: A satistical investigation.
IOSR Journal of Business and Management, 16(3), 44-56. Mipango, P. (2015), The Role of Investment in Economic Development
and Growth Strategy of Tanzania: The Case of the Lake Tanganyika
Zone, The Lake Tanganyika Investment Forum. Available from: http://www.mipango.go.tz/index.php?Option=com.
Pettinger, T. (2017), Investment and Economic Growth. Available from:
http://www.economicshelp.org/blog/495/economics/investment-and-economic-growth.
Riezky, N. (2013), The Role of Investment Development Performance Indonesia. Available from: http://www.ardana45.wordpress. com/2013/05/14/the
role-investment-in-development-economic-in-indonesia-byi-ketut.
Rizvi, S.Z.A., Nishat, M. (2009), The impact of foreign direct investment
on employment opportunities: Panel data analysis: Empirical
evidence from Pakistan, India, and China. The Pakistan Development Review, 48(4), 841-851.
Sukirno, S. (2010), Macroeconomics, Introduction to the Theory. 3rd ed.
Jakarta: Raja Graindo Perkasa.
Todaro, M.P., Smith, S.C. (2003), Economic Development in the Third
World. 8th ed. Jakarta: Erland.
Table 7: Value intercept of 6 district
District/city Intercept value
Palembang 1.248625
MUBA 0.310793
MuaraEnim −0.488494
East OKU −0.262431
PagarAlam −0.670530
LubukLinggau −0.137963