International Review of Economics and Finance 8 (1999) 253–265
Managing banks’ duration gaps when interest rates are
stochastic and equity has limited liability
J. Duan
a, C.W. Sealey
b,* Y. Yan
caDepartment of Finance, Hong Kong University of Science and Technology, Clearwater Bay, Kowloon, Hong Kong, Peoples Republic of China
bDepartment of Finance and Business Law, University of North Carolina-Charlotte, 9201 University City Blvd., Charlotte, NC 28223, USA
cDivision of Banking and Finance, Nanyang Technological University, Nanyang Ave., Singapore 639798
Received 4 November 1996; accepted 9 February 1998
Abstract
Interest rate risk is an important consideration in both the management and regulation of depository financial institutions. Although the market value of equity is the most often used target of gap management, the conventional tools employed in the literature ignore a crucial characteristic of equity, viz., limited liability. In this article, we compare conventional techniques used to measure the duration gap for depository institutions with the limited liability techniques recently developed in the literature. Our results show that conventional models may over-estimate banks’ interest rate risk exposures, especially during times when interest rate volatility and credit risk are at above average levels. This over-estimation may lead banks to make errors in their gap management. 1999 Elsevier Science Inc. All rights reserved.
JEL classification:G13; G21
Keywords:Interest rate risk; Bank management; Applications of option pricing; Stochastic interest rates; Bank regulation
1. Introduction
The problem of interest rate risk at depository financial institutions has received considerable attention in both the theoretical and empirical literature. Such attention is understandable because the topic is of great importance to both the managers
* Corresponding author. Tel.: 704-547-2063.
E-mail address: [email protected] (C.W. Sealey)
and regulators of deposit-taking institutions. First, it has been argued that maturity mismatching, in conjunction with increased interest rate volatility in the 1980s, was a major factor in precipitating the Savings and Loan debacle.1 Second, in response to
legislation, the Federal Reserve Board and the Office of Thrift Supervision have implemented regulations to link banks’ capital requirements to their interest rate risk exposures, a development that makes the problem of managing interest rate risk increasingly important to both banks and regulators.2
To manage interest rate risk, banks choose asset and liability portfolios to control changes in the value of a target variable that result from changes in interest rates. Although a number of target accounts are discussed in the banking literature, a useful and widely employed target is the market value of bank equity.3 This target gains
added importance because it is the exposure of equity value to changes in interest rates that bank regulators target when adjusting capital standards for interest rate risk. Unfortunately, conventional models of bank interest rate risk management do not take into account an important characteristic of equity, viz., limited liability. The reason is that conventional models of bank interest rate risk exposure largely rely on tools adapted from the management of interest rate risk for portfolios of default-free, fixed-income securities.4Existing research implies, however, that limited liability may
play an important role in interest rate risk management.
In this paper, we compare the conventional and limited liability models and their implications for gap management at banks. As the prototype of the limited liability case, we adopt the options-based model of bank interest rate risk exposure developed by Duan, Moreau, and Sealey (1995; cited hereafter as DMS), where bank equity is valued as a call option and interest rates are stochastic.5We present numerical
compari-sons of the options-based and the conventional models. The results show that the two approaches can give significantly different values for a bank’s interest rate risk expo-sure, especially during periods with above-average interest rate volatility, and/or for banks with above average credit risk.
The remainder of the paper is organized as follows: Section 2 presents a brief overview of the DMS measure of a bank’s interest rate risk exposure, which is based on their model of bank equity valuation under limited liability and stochastic interest rates. A comparable version of the conventional model is also developed. Section 3 discusses some comparative properties of the options-based and the conventional models. Specific numerical comparisons of the models are presented in Section 4. The conclusions and implications are discussed in Section 5.
2. Alternative models of bank interest rate risk
2.1 The options-based model of bank interest rate risk
The options-based model employed here is developed primarily in the work of DMS (1995).6In their model, bank equity has limited liability and is valued as a call
option where the instantaneous interest rate,rt, follows a mean-reverting stochastic
process such as that employed by Vasicek (1977) and others.7Banks have a planning
horizon that extends over the period [0,T], hold assets with market valueA, equity capital with market valueE, and deposit liabilities with at50 value ofLand maturity T.Deposits are assumed to be insured and earn a fixed, risk-free rate of return denoted by R, and equity has limited liability in the event of bankruptcy. At maturity, the bank’s liability to depositors isX; LeRT.
The DMS (1995) valuation equation for bank equity, at timet, is as follows:
Et5 AtN(ht) 2 rXP(rt,t)N(ht2 dt), (1)
wA is the instantaneous interest rate elasticity of bank assets;c is the instantaneous
credit risk of bank assets;y is the instantaneous volatility of the interest rate; q is a positive constant measuring the magnitude of the mean-reverting force of the interest rate; andris a slack variable used to account for different closure rules enforced by regulators.8Note that d
tis the pricing-relevant risk for bank assets.9
LetwO
Edenote the instantaneous interest rate elasticity of bank equity derived from
the equity pricing model in Eq.(1). Then, the bank’s interest rate risk can be expressed as follows:
wO
Et 5Xt[wA2 wL(t)]1 wL(t) (2)
where Vt ; [N(ht)](At/Et), and wL(t) is the instantaneous interest rate elasticity of
bank liabilities with maturityt.10Note thatw
AandwL(t) are elasticities and are negative
in sign.
The interpretation of Eq. (2) is based on the intuition behind option pricing with stochastic interest rates.11The pricing-relevant risk for an option contract with
stochas-tic interest rates is the risk exhibited by the asset value process in a nume´raire economy, where the price of a zero-coupon, default-free instrument, withtto maturity, is used as the nume´raire. The underlying asset and the nume´raire instrument have interest rate elasticities ofwA and wL(t), respectively. Thus, the interest rate risk exposure at
time t of the normalized asset is [wA 2 wL(t)], referred to here as the interest rate
elasticity, the first term on the RHS of Eq. (2) is the interest rate risk exposure of equity in the nume´raire economy. Adding the interest rate elasticity of the nume´raire bond yields the interest rate risk exposure of equity in the original economy.
2.2 The conventional measure of interest rate risk
In this section, we derive an expression for the conventional measure of the interest rate elasticity of bank equity. As discussed above, the focus of our investigation is the impact of limited liability on a bank’s interest rate risk exposure, a property that the conventional model does not take into account. There are two possible approaches to the derivation of the conventional model, both of which lead to expressions of similar form.12 To maintain continuity with the options-based model of DMS (1995)
shown above, and to make the subsequent comparisons as straightforward as possible, our derivation here is based on the assumptions used by DMS (1995), adapted to the case of unlimited liability.
In Eq. (1), limited liability is reflected through the option pricing termsN(ht) and
N(ht2 dt), both of which are equal to one in the absence of limited liability. Thus,
the equity valuation equation for the conventional model, can be written as follows:
Et5 At2 rXP(rt,t), (3)
where all terms are defined earlier. Applying Ito’s lemma to Eq. (3) yields
dEt 5Qtdt1 wAAtdrt2 rX
]P(rt,t)
]rt
drt1 cAtdWt, (4)
where Wt is a Weiner process independent of the interest rate, and Qt is used to
denote all terms associated with dt, which are all locally deterministic and are not related to changes in the interest rate.
LetwC
Et denote the instantaneous interest rate elasticity of equity as measured by
the conventional approach. Then, Eq. (4) can be rearranged to yield:
wC Et 5 wA
A Et
2 rP(rt,t)
X Et
wL(t), (5)
wherewL(t) ;
3
]P(rt,t)/P(rt,t)
]rt
4
. Finally, substituting for rXP(rt, t) from Eq. (3) andsimplifying yields
wC Et 5
At
Et
[wA 2 wL(t)] 1 wL(t). (6)
Eq. (6) can be interpreted as a continuous time version of the conventional model of bank interest rate risk exposure when interest rates follow a mean reverting stochastic process.13 Comparing equations Eqs. (2) and (6), it is evident that the conventional
model is identical to the options-based model when N(ht) 5 1, that is, unlimited
3. Comparative properties of the options-based and conventional models
An examination of Eqs. (2) and (6) reveals several potentially important differences between the options-based and conventional measures of interest rate risk. The most important difference is the absence of the termN(ht) from Eq. (6). Loosely speaking,
N(ht) arises because of the probability of insolvency for the bank, and any variable
that influences that probability will impact the bank’s interest rate risk exposure. Thus, bank decisions such as credit risk exposure, as well as exogenous variables such as the parameters of the interest rate process and the closure policy of the regulator, as reflected in the parameterr, will effect the value of N(ht).
Note also that both the options-based and conventional measures are equal when the elasticity gap is set equal to zero, that is, when [wA2 wL(t)]50. The reason for
this equality is straightforward: If [wA2 wL(t)]50, the influence of gap management
is eliminated from Eq. (2), and bank equity behaves like a risk-free bond with respect to the interest rate, thus eliminating the influence of limited liability.
It would be of interest to compare the formal comparative-static properties of
wO Et and w
C
Et. For a number of variables, however, the signs are not determinant for
arbitrary parameter values, although the numerical analysis presented later shows thatwO
Etis a well-behaved function over a wide range of parameter values. As a result,
rigorous comparative-static results are, for the most part, not useful; however, it is possible to rely on the numerical results to make some general statements about the relative behavior of wO
Et and wCEt.
The two models have the following general comparative properties: 1. wO
Et and wCEt are monotonic and increasing in the bank’s interest rate elasticity
gap, [wA2 wL(t)].
2. For a given value ofT, wC
Et is linear in the interest rate elasticity gap, whereas
wO
Etis convex for negative values for the gap, and concave for positive values of
the gap.
3. For any given value of the bank’s interest rate elasticity gap,
*
wOEt
*
#*
wCEt*
.Other general properties ofwO
Etare as follows:
Etmay be either increasing or decreasing inq, depending on model parameters.
For example, Kaufman (1992) points out two potential problems that relate to the options-based model used here. First, the model is based on an assumption that the risk of the bank’s assets are exogenous and constant over the life of the equity option. However, as the equity option gets close to the face value of debt (i.e., as the bank gets close to economic insolvency), moral hazard increases and banks may be tempted to increase asset risk in an attempt to shift risk to the deposit insurer. In the options-based model, banks can shift risk by increasing credit risk, interest rate risk, or both. The effect of either of these actions is to increase the volatility of the asset underlying the bank’s equity option. Although this change in volatility is a violation of the assumptions of the option pricing model, it nevertheless has a predictable impact on the relationship of the conventional and options-based models. Specifically, the difference in interest rate risk exposure as measured by the two models becomes greater.
Kaufman’s second criticism is that the exercise price of the bank’s equity option is not necessarily constant, but rather depends on the willingness of the regulatory authorities to close the bank when it actually become insolvent, which in turn depends on the regulator’s closure policy. It is widely recognized that in years past regulators were reluctant to close insolvent banks and widely practiced capital forbearance by allowing insolvent banks to remain open. As noted earlier, empirical applications of the options-based model to banks have included a slack variable to account for a closure policy that includes capital forbearance.
Ronn and Verma (1986) assume that the regulator will forebear and close insolvent banks only after their asset value has deteriorated 3 percent below the face value of deposits, and DMS (1992; 1995) adopt this assumption as well. Although the 3 percent value chosen for these studies is somewhat arbitrary, an assumption of forbearance seems reasonable for the time periods that they use.
In more recent years, however, with the passage of the FDIC Improvement Act of 1991, capital forbearance no longer seems to be an option for regulators. In fact, FDICIA requires regulators to practice prompt corrective action that may effectively amount to early closure. As suggested by Kaufman (1992), closure policy may be difficult to quantify and may lead to errors when implementing the options-based approach.
4. Numerical comparisons
interest rate elasticities, and leverage for a sample of individual banks are presented in Simonato (1994). Third, we further obtained some unpublished parameter estimates from the DMS (1995) study for individual banks and averages for individual quarters. The individual bank and quarterly estimates demonstrate considerable variability, suggesting that the averages presented in DMS (1995) result in a great deal of smooth-ing of the estimates. For the numerical results discussed below, we use parameter values that vary within the range of estimates reported in these sources.
For parameters of the interest rate process, q and y, DMS (1995) report sample values of 1.0 and 1.05 percent, respectively. As expected, interest rate volatility varies a great deal over this sample, reaching an average high for the sub-period 1980–83 of approximately 2.0 percent. Based on individual quarterly estimates, interest rate volatility reached a quarterly high of 3.2 percent during the first quarter of 1981, and often exceeded 2.0 percent during this period.
For bank-specific parameters, the estimates presented in DMS (1995) suggest an overall sample average for credit risk of approximately 1.1 percent, with an increasing trend over the sample period, particularly for small and medium size banks. Individual bank data show considerable variation across banks and time, with credit risk varying from lows near zero to highs above 10 percent. Market value leverage ratios average
approximately 98 percent over the DMS (1995) sample period.15 For the numerical
examples below, we adopt a leverage ratio of 0.96 for the debt-to-value ratio.16
To be consistent with Ronn and Verma (1986) and DMS (1992; 1995), we adopt a value ofT51. Moreover, all calculations are made att50, so thatwL(t) is always
evaluated att 51, and is hereafter denoted aswL.17All other time subscripts are also
eliminated.
As discussed above, Ronn and Verma (1986) and DMS (1992; 1995) employ a parameterr 50.97 to control for the practice of capital forbearance by the regulatory authorities. This parameter value assumes that a bank would not be declared insolvent and closed by the regulator until the market value of assets falls below the face value of liabilities. Over the sample periods used in these studies, the policy of capital forbearance by regulators was thought to be widespread; thus,r ,1 could be justified. In recent years, however, with the passage of FDICIA and greatly increased regulatory requirements and scrutiny, forbearance is now thought to be obsolete. Thus, in the numerical examples presented below, we dispense with the assumption of forbearance. Although 2 percent in regulatory capital is the threshold for regulatory action, to account for slippage in the regulatory system and differences between book and market values, we adopt a more conservative value ofr 5 1.01, indicating the bank could be closed while equity has a small positive value.
The specific numerical comparisons are shown in Tables 1–3.18In Tables 1 and 2,
three functions are presented, one for the conventional model and two for the options-based model. For ease of comparison, the conventional model is calculated for the same parameter values in both Tables. Two of thewO
E functions, one in each Table,
are computed for the same parameter values, which are the average estimates fory
and c reported in DMS (1995). The remaining wO
E functions in Tables 1 and 2 are
Table 1
Bank interest rate risk as measured by the options-based and conventional models
wv-wL wOE(c1) wOE(c2) wCE
21.000 223.803 227.149 233.527
20.900 221.536 224.693 230.237
20.800 219.258 222.200 226.948
20.700 216.968 219.668 223.658
20.600 214.667 217.093 220.369
20.500 212.355 214.474 217.079
20.400 210.032 211.809 213.790
20.300 27.698 29.094 210.501
20.200 25.353 26.327 27.211
20.100 22.998 23.507 23.922
0.000 20.632 20.632 20.632
0.100 1.744 2.300 2.657
0.200 4.129 5.291 5.947
0.300 6.523 8.340 9.236
0.400 8.927 11.447 12.526
Interest rate volatility and credit risk are set as follows:y 50.0105,c150.05,c250.0108.
presents a comparison of the conventional and options-based models when credit risk and interest rate volatility are at above average values. For all three Tables, the range of the elasticity gap used is21.00 to 0.40, a range within which empirical estimates show a majority of average elasticity gaps fall.
In terms of general observations, first note that, as expected, the numerical results
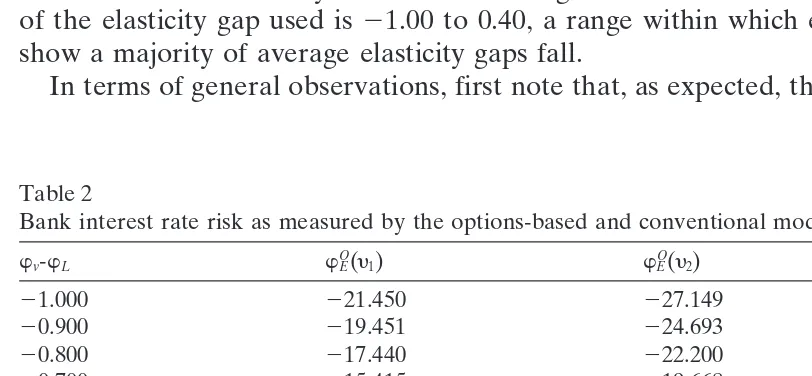
Table 2
Bank interest rate risk as measured by the options-based and conventional models
wv-wL wOE(y1) wOE(y2) wCE
21.000 221.450 227.149 233.527
20.900 219.451 224.693 230.237
20.800 217.440 222.200 226.948
20.700 215.415 219.668 223.658
20.600 213.373 217.093 220.369
20.500 211.313 214.474 217.079
20.400 29.231 211.809 213.790
20.300 27.126 29.094 210.501
20.200 24.994 26.327 27.211
20.100 22.831 23.507 23.922
0.000 20.632 20.632 20.632
0.100 1.607 2.300 2.657
0.200 3.891 5.291 5.947
0.300 6.229 8.340 9.236
0.400 8.628 11.447 12.526
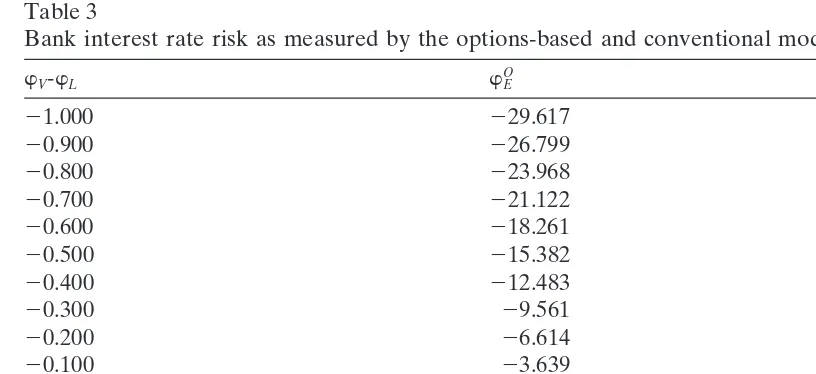
Table 3
Bank interest rate risk as measured by the options-based and conventional models
wV-wL wOE wCE
21.000 229.617 248.709
20.900 226.799 243.901
20.800 223.968 239.094
20.700 221.122 234.286
20.600 218.261 229.478
20.500 215.382 224.671
20.400 212.483 219.863
20.300 29.561 215.055
20.200 26.614 210.248
20.100 23.639 25.440
0.000 20.632 20.632
0.100 2.410 4.176
0.200 5.493 8.983
0.300 8.619 13.791
0.400 11.795 18.599
Interest rate volatility and credit risk are set as above average values,c 50.30,y 50.30, andr 51.02.
show that the measure of interest rate risk using the conventional approach is greater than or equal in absolute value than the values suggested by the options-based model. Second, for the overall average parameter values reported in DMS (1995), i.e.,c 5
1.08 percent and y 5 1.05 percent, the conventional estimate is approximately 14
percent greater than the options-based estimate at an elasticity gap of 20.200, and this difference increases to approximately 24 percent at a gap of21.00. On the other hand, at a gap of20.10, the difference falls to approximately 11 percent.
Tables 1 and 2 show that, as the parameters y and c increase, the differences
between the conventional and options-based measures become greater. In Table 1, for example, for a level of credit risk of 5 percent (a value of credit risk that is considerably above average but well within quarterly estimates for individual banks), the conventional measure is 35 percent greater than the options based measure for an elasticity gap of20.200, and this difference increases to 41 percent for a gap of
21.00.
In Table 2, we showwO
E for interest rate volatility levels of 1.05 percent, the DMS
(1995) sample average, and 3.2 percent, the average value for interest rate volatility in the high interest rate environment of the first quarter of 1981. As in the case of credit risk, higher degrees of interest rate volatility increase the divergence between the options-based and conventional measures. For an interest rate elasticity gap of
20.200 and interest rate volatility of 3.2 percent, the conventional measure is 44 percent greater than the options-based measure. This difference increases to 56 percent for an elasticity gap of 21.00.
percent. In such a high-risk environment, much larger differences can be observed in the interest rate risk exposure as measured by the two models. For an elasticity gap of 20.200, the conventional measure is 43 percent greater than the options-based
measure, and at a gap of 21.00, the difference becomes 64 percent. Thus, during
periods of high volatility in financial markets in general, the conventional model yields measures of interest rate risk that are potentially serious overestimates of bank interest rate risk exposure.19
5. Conclusions and implications
This paper compares options-based and conventional models for measuring a bank’s interest rate risk exposure. The options-based model combines the limited liability of equity with stochastic interest rates to provide a specific relationship between a bank’s gap management and the interest rate risk exposure of equity. The results show that the conventional model may over-estimate a bank’s interest risk exposure, particularly when credit risk and/or interest rate volatility are at above average levels. As a result, the conventional model may lead banks to over-hedge their interest rate risk.
As a caveat to the above conclusion, it is important to note that, even though there may be important differences between the two models, it is not possible to say that one is always best. While it is true that the options-based model does consider limited liability, an important feature of bank equity, the approach has shortcomings that may have an impact on its usefulness under certain circumstances.
For example, as discussed above, Kaufman (1992) points out two potential problems that relate to the options-based model used here. An additional disadvantage with the options-based model is that it has greater information requirements than the conventional model. Thus, for implementation, a greater number of parameter esti-mates must be used, each introducing the possibility of error.
Notes
1. See Green and Shoven (1986), Baer (1990), Benston (1985), Benston et al. (1986), and Kane (1985) for discussions of the role of interest rate volatility on the solvency of financial institutions.
2. The Federal Deposit Insurance Corporation Improvement Act of 1991 autho-rizes regulators of insured institutions to base capital requirements on interest rate risk.
3. There are a number of target variables for the interest rate risk management of banks discussed in the literature. Bierwag and Kaufman (1985), for example, propose four target variables including the market value of equity. Others who employ the market value of equity include Belongia and Santoni (1984), Santoni (1984), Dermine (1985), and Duan, Moreau, and Sealey (1995).
(1938), Hicks (1938), and Redington (1952). Specific examples of the conven-tional model as applied to banks are largely developed by Bierwag (1987), Bierwag and Kaufman (1985; 1992), Kaufman (1984), and Toevs (1983). 5. The use of option-pricing in the banking literature began with Merton’s (1977)
paper on deposit insurance. Variations of his model are found in Marcus and Shaked (1984), Ronn and Verma (1986), Giammarino, Schwartz, and Zechner (1989), and Duan, Moreau, and Sealey (1992; 1995). The work of Duan, Moreau, and Sealey (1995) is in the spirit of Cox, Ingersoll, and Ross (1979), where interest rate dynamics play an important role.
6. The model of Duan, Moreau, and Sealey (1995) is in turn based on the work of Merton (1977), Ronn and Verma (1986) and Rabinovitch (1989).
7. The interest rate and bank assets are assumed to follow the stochastic processes used in DMS (1995), Eqs. (1) and (2), respectively.
8. Ronn and Verma (1986) were the first to introduce the slack variable r to
account for capital forbearance. They assume a value for r of 0.97, indicating that banks will be closed only after their market value falls below the value of their liabilities. Since forbearance is now prohibited by FDICIA, and banks can be closed with positive capital, realistic figures in today’s regulatory environment would be r $1.0.
9. As usual in option pricing, the term N(ht) is the delta (the partial derivative
ofEwith respectA) of the equity option. The interpretation ofhtis similar to
that of Hull and White (1990), where one asset’s price is normalized relative to the price of another asset. For further elaboration on this point, see Rabinovitch (1989).
10. The instantaneous interest rate elasticity of bank liabilities is given bywL(t) ;
2[1 2e2qt]/q. Note that when interest rates are stochastic, the duration (i.e., the negative of the instantaneous interest rate elasticity) of any fixed income, pure discount instrument like bank deposits will be less than the time to maturity. 11. See DMS (1995) for an alternative interpretation of Eq. (2).
12. An alternative to our approach here is to derive equity elasticity following Bierwag and Kaufman (1985; 1992). This approach results in an equation for the interest rate elasticity of equity that is of the same form as the equation we derive, with the exception that their duration measures are interpreted as Macaulay duration. To be consistent with the options-based model, we do not interpret duration in terms of the Macaulay measure. See also Note 19. 13. In the conventional model, the negative of each interest rate elasticity is usually
interpreted as Macaulay duration, which Bierwag, Kaufman, and Toves (1983) show is consistent with a single factor model of interest rate dynamics. 14. Our version of the conventional model, as shown in Eq. (6), can be put into
the same form as Eq. (5) in Bierwag and Kaufman (1992). To see this, first assume that assets and liabilities are discounted by a common interest rate, and divide both sides of our Eq. (6) by (1 1 r)/E. The result is then of the same form as their equation (5), which is in discrete time.
not the same as regulatory capital. Market-value leverage ratios may be less than the risk-adjusted capital ratios used for regulatory purposes. In fact, as noted, DMS (1995) estimates show a sample average of 0.98 for the market debt-to-value ratio. Ronn and Verma (1986) and Simonato (1994) show even greater leverage ratios.
16. In recent years, because of strict capital regulation, it is likely that market value leverage has increased relative to the estimates for the 1980s. Thus, we adopt a value of 0.96 for this ratio.
17. Note that att50, due to deposit insurance, the present value of the exercise price, XP(rt,t), precisely equals the face value of deposit liabilities,L.
18. To check our model for consistency with the DMS (1995, Tables 1 and 2) estimates, we calculated equity elasticity using their average parameter values for all banks over the period 1976–89. Specifically, we used their average esti-mates of c 50.0108 andy 50.0105; their closure policy ofr 50.97; and their average elasticity gap of20.201. The value we obtained forwO
Efrom our model
was 24.596. They report an average equity elasticity of 24.531.
19. Note that if Macaulay duration were adopted as the duration measure in the conventional model, as is most common in the literature, the differences between the options-based and conventional models would be greater than those re-ported above.
References
Baer, H. (1990). What we know about the deposit insurance problem.Chicago Fed Letter July, 1–3. Belongia, M., & Santoni, G. (1984). Hedging interest rate risk with financial futures: some basic principles.
Economic Review, Federal Reserve Bank of St. Louis, 15–25.
Benston, G., Eisenbeis, R., Horvitz, P., Kane, E., & Kaufman, G. (1986).Perspectives on Safe and Sound Banking: Past, Present, and Future.Cambridge, MA: MIT Press.
Benston, G. (1985).An Analysis of the Causes of Savings and Loan Association Failures.Monograph Series in Banking and Finance. New York: New York University.
Bierwag, G. (1987).Duration Analysis: Managing Interest Rate Risk.Cambridge, MA: Ballinger. Bierwag, G., & Kaufman, G. (1985). Duration gaps for financial institutions.Financial Analysts Journal
41, 68–77.
Bierwag, G., & Kaufman, G. (1992). Duration gaps with futures and swaps for managing interest rate risk at depository institutions.Journal of Financial Services Research 5, 217–234.
Bierwag, G., Kaufman, G., & Toevs, A. (1983). Immunization strategies for funding multiple liabilities.
Journal of Financial and Quantitative Analysis 18, 113–123.
Cox, J., Ingersoll, J., & Ross, S. (1979). Duration and the measurement of basis risk.Journal of Business 52, 51–61.
Dermine, J. (1985). The measurement of interest rate risk by financial intermediaries.Journal of Bank Research 15, 86–90.
Duan, J., Moreau, A., & Sealey, C. (1992). Fixed-rate deposit insurance and risk-shifting behavior at commercial banks.Journal of Banking and Finance 16, 715–742.
Duan, J., Moreau, A., & Sealey, C. (1995). Deposit insurance and bank interest rate risk: pricing and regulatory implication.Journal of Banking and Finance 19, 1091–1108.
Green, J., & Shoven, J. (1986). The effects of interest rates on mortgage payments.Journal of Money, Credit, and Banking 18, 41–59.
Hicks, J. (1938).Value and Capital.Oxford: Clarendon Press.
Hull, J., & White, R. (1990). Pricing interest rate derivative securities.Review of Financial Studies 3, 573–592.
Kane, E. (1985)The Gathering Crisis in Federal Deposit Insurance.Cambridge, MA: MIT Press. Kaufman, G. (1984) Measuring and managing interest rate risks: a primer.Economic Perspectives, Federal
Reserve Bank of Chicago, 16–29.
Kaufman, G. (1992). Some shortcomings of analyzing deposit insurance as a put option: a communication.
Journal of Financial Engineering 1, 376–383.
Macaulay, F. (1938).The Movements of Interest Rates, Bond Yields and Stock Prices in the United States since 1856.New York: National Bureau of Economic Research.
Marcus, A., & Shaked, I. (1984). The valuation of FDIC deposit insurance using option-pricing estimates.
Journal of Money, Credit and Banking 16, 446–460.
Merton, R. (1977). An analytic derivation of the cost of deposit insurance and loan guarantees.Journal of Banking and Finance 1, 3–11.
Rabinovitch, R. (1989). Pricing stock and bond options when the default-free rate is stochastic.Journal of Financial and Quantitative Analysis 24, 447–457.
Redington, F. (1952). Review of the principles of life-office valuations.Journal of the Institute of Actuaries 78, 286–315.
Ronn, E., & Verma, A. (1986). Pricing risk-adjusted deposit insurance: an option-based model.Journal of Finance 41, 871–895.
Santoni, G. (1984). Interest rate risk and the stock prices of financial institutions.Economic Review, Federal Reserve Bank of St. Louis, 12–20.
Simonato, J., (1994).Three essays on the term structure of interest rates.Unpublished Ph.D. dissertation. Montreal, Quebec, CA: McGill University.
Toevs, A. (1983). Gap management: managing interest rate risk in banks and thrifts.Economic Review, Federal Reserve Bank of San Francisco, 20–35.