www.elsevier.com / locate / econbase
A nonparametric analysis of income convergence across the US
states
*
Paul A. Johnson
Department of Economics,Vassar College, Maildrop 324, 124 Raymond Ave., Poughkeepsie, NY 12604, USA
Received 13 December 1999; accepted 19 May 2000
Abstract
In this paper I apply the nonparametric methods proposed by Quah to data on US state relative income levels. In contrast to Quah’s results using cross-country data I find no evidence of polarization in the cross-state income distribution. The long-run density implied by the estimates is strongly unimodal. This finding is consistent with the results of previous analyses of convergence in state income levels using other methods. 2000 Elsevier Science S.A. All rights reserved.
Keywords: Convergence, US states, Kernel estimation
JEL classification: O41; O47; C22
1. Introduction
Interest in the behavior of US state incomes is both intrinsic as well as providing a useful check on convergence tests as this is surely the group of ‘‘countries’’ that is most likely to converge. Barro and Sala-i-Martin (1995) find the behavior of per capita personal incomes in the states over the period 1880 to 1990 to be consistent with both the b ands-convergence hypotheses. Quah (1996a, 1996b, and 1997), for example, has commented that these approaches to convergence focus on average
1
behavior rather than on the dynamics of the cross-country income distribution. He has proposed an approach to convergence empirics that captures the behavior of the entire income distribution as it evolves over time. Suppose that the cross-country income distribution at time t can be described by the density function, f (x). In general, the income distribution will evolve over time so that the densityt
prevailing at time t1t for t.0 is ft1t(x). Assuming that the process describing the evolution of the
*Tel.:11-914-456-0548; fax: 11-914-437-7576.
E-mail address: [email protected] (P.A. Johnson).
1
See Durlauf and Quah (1999) for a review of the different approaches to the convergence hypothesis.
220 P.A. Johnson / Economics Letters 69 (2000) 219 –223
distribution is time-invariant and first-order, the relationship between the two distributions can be `
written ft1t( y)5e0 g ( yt ux)f (x) dx where, conditional on an income of x, g ( yt t ux) is the density of, y,
2
income t periods later. In this paper I estimate a g ( yt ux) for the US states and so provide a generalization for the states of the findings in Quah (1996a) in that the income space here is
3
continuous rather than discrete. Quah (1996b, 1997) pursues this generalization for the cross-country income distribution.
The data are annual estimates of nominal per capita personal income in each of the 48 contiguous states of the US and in the US as a whole from 1929 to 1993 as provided by the Regional Economic Measurement Division of the Bureau of Economic Analysis (1994). The income level in each state is divided by that for the US so that the analysis is performed using the per capita personal income in the
4
states relative to the US average. Apart from removing the common growth and business cycle effects, under the assumption of a common US-wide price level, this transformation of the data circumvents the problem caused by the absence of data on prices that could be used to compute real
5
personal income per person.
I follow Quah’s cross-country studies in settingt515 and so use that data from 1948, 1963, 1978
6
and 1993 to give observations on three 15-year transitions for each state to estimate g ( y15 ux). The year 1948 is the starting point in order to avoid the turmoil of the depression and WWII. The
7
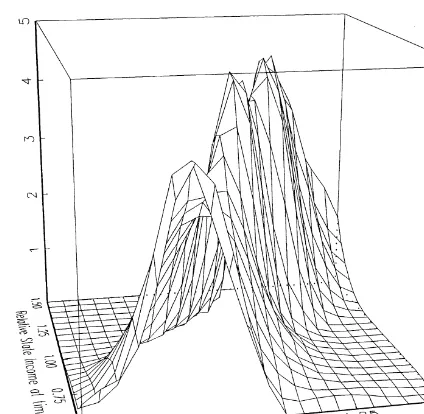
adaptive kernel method described in Silverman (1986, Section 5.3) is used to estimate g ( y15 ux). While the estimated g ( y15 ux), shown in Fig. 1, does exhibit some ‘‘peaks’’ as typically do those estimated for cross-country data (see Fig. 5.1 in Quah (1997) for example) it does not imply the same ‘‘twin-peaks’’ behavior in the long run. The key difference can be seen more clearly in Fig. 2 which shows the contour plot of the surface in Fig. 1. The corresponding figure for the country data is Fig. 5.2 in Quah (1997). Note that the peaks lie below the 458 line for values of relative state income less than 1.0 and above the line for values greater than 1.0. This means that states with incomes below the US average tend to have increasing relative income over the 15-year horizon. Similarly, states with incomes above the average tend to have decreasing relative incomes. In other words, low income states tend to grow more quickly than high income states. In the case of the estimates for
2
I simplify the presentation here by assuming that the marginal and conditional income distributions have density functions. Quah’s development of the approach avoids these assumptions and is far more general.
3
Quah (1996a) estimates a 5-state Markov transition matrix for relative state per capita income over the period 1948 to 1989. The results here are entirely consistent with Quah’s findings.
4
Note that the per capita personal income figure is that for the US as a whole and not simply the average of the figures for the 48 contiguous states.
5
The results in Roberts (1979) and Izraeli and Murphy (1997) suggest that the failure of the assumption of a common price level biases the findings here against the convergence hypothesis.
6
The qualitative conclusions of the paper are robust to settingt equal to either 5 or 10.
7
The adaptive kernel estimator is a kernel estimator with a window width that decreases with the local density of the data. It is a 2-step estimator. In the first step a ‘‘pilot’’ estimate of the density is found. In the second step this density is used to vary the window width in an otherwise standard kernel estimator. I use an Epanechnikov kernel estimator with a (fixed) window width as given on pages 86–7 of Silverman (1986) to find the pilot estimate of the joint density. The adaptive kernel estimator of the joint density of y and x also employs the Epanechnikov kernel. Thoughout, Silverman’s suggested value of the ‘‘sensitivity parameter’’, 0.5, is used. The estimated joint density of y and x is integrated over y to give the marginal density of x. The ratio of the former to the latter provides the estimate of g ( yt ux) presented below. All computations in this
Fig. 1. Estimated g ( yu15 x) for the US states 1948–93.
cross-country data there are peaks on the 458 line for low income countries and for high income countries. This implies a tendency for countries with relatively low (high) incomes to stay in the lower (upper) tail of the distribution. Importantly, the state data produces the tallest peak of all right on the 458 line in the center of the distribution implying a tendency for state incomes to congregate there. The country data exhibits a dip in the center producing a tendency for countries to leave there.
222 P.A. Johnson / Economics Letters 69 (2000) 219 –223
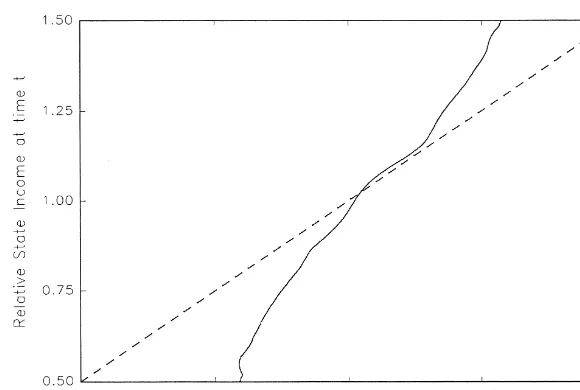
Fig. 3. Median income at t115 conditional on income at t.
Additional guidance is provided by Fig. 3 which plots the estimated median value of relative state
8
income at time t115 conditional on the value at time t.
For those values of income at time t where the solid line lies below the dashed 458 line, the median income at time t115 exceeds the actual value at time t so that the probability of higher relative income 15 years hence is greater than that of lower income. Similarly, for those values of income at time t where the solid line lies above the dashed line, the median income at time t115 is less than the actual value at time t so that the probability of lower relative income 15 years hence is greater than that of higher relative income. Thus, the fact that the solid line crosses the dashed line only once and
9
from below implies a tendency for state incomes to move towards the center of the distribution. Inspection of Fig. 5.2 in Quah (1997) suggests that the corresponding line for the country data would have a shape so that it crosses the 458three times — twice from below and once from above. One of the crossings from below occurs at low income values and one at high income values implying a tendency for countries to move toward one end of the income distribution or the other. The crossing from above occurs near the middle of the distribution implying a tendency for countries to leave the center. Hence the emergence of ‘‘twin peaks’’ with the passage of time that Quah documents.
The putative long-run tendency for the state incomes to gravitate toward the average suggested by Fig. 3 is exhibited in Fig. 4 which plots the long-run (ergodic) density of relative state incomes
`
implied by the estimated g ( y15 ux). That is, Fig. 4 shows f ( y), the solution to f ( y)` ` 5e0 g ( yt ux)f (x)` dx. This density is strongly unimodal with a mean close to unity. There is no evidence of the sort of polarization or convergence clubs found in the country data. This finding is consistent with the results of previous analyses of convergence in state income levels using other methods.
8
For any value of relative income at time t, x, this is the median of g ( y15 ux). I have reversed the conventional orientation
of the axes in Fig. 3 in order to maintain conformity with that in Fig. 2.
9
Fig. 4. Estimated ergodic density, f ( y).`
Acknowledgements
Parts of this paper were written while I was visiting the University of Massachusetts, Amherst MA. Their hospitality is gratefully acknowledged.
References
Barro, R.J., Sala-i-Martin, X., 1995. Economic Growth. McGraw-Hill, New York.
Bureau of Economic Analysis, 1994. State annual summary tables 1929–93 for the States and regions of the nation, Department of Commerce, Washington DC.
Durlauf, S.N., Quah, D., 1999. The new empirics of economic growth. In: Taylor, J.B., Woodford, M. (Eds.). Handbook of Macroeconomics, Vol. 1A. North Holland, Amsterdam, pp. 231–304.
Izraeli, O., Murphy, K., 1997. Convergence in state nominal and real per capita income. Public Finance Review 25, 555–576.
Roberts, C.A., 1979. Interregional per capita income differentials and convergence: 1880–1950. Journal of Economic History XXXIX, 101–112.
Silverman, B.W., 1986. Density Estimation For Statistics and Data Analysis. Chapman & Hall, London. Quah, D., 1996a. Empirics for economic growth and convergence. European Economic Review 40, 1353–1375.
Quah, D., 1996b. Convergence empirics across economies with (some) capital mobility. Journal of Economic Growth 1, 95–124.