Preponderance of Bioactive Medicinal Compounds and ATR-FTIR Spectroscopy
of Coriander and Mustard Floral Honey from
Apis mellifera
Ishan Ullah Khan
1,*, Widhi Dubey
1, and Vedprakash Gupta
2 1School of Science, JECRC University, Jaipur-303905, Rajasthan, India 2Agricultural Research Station, Agriculture University Kota, Rajasthan, IndiaReceived March 23, 2017; Accepted August 7, 2017
ABSTRACT
The physicochemical, total phenolics, flavonoids, and antioxidant activity were evaluated for biochemical characterization of coriander and mustard floral honey. The total phenolics, flavonoids and antioxidant activity were analyzed using UV-VIS spectrophotometer. Fourier transform infrared spectroscopy (FT-IR) was used to evaluate the chemical characteristic of coriander and mustard floral honey. The total phenolics content was ranged from 294 to 462 mg gallic acid equivalent kg-1of honey. The total flavonoid content was ranged from 43 to 53 mg quercetin
equivalent kg-1of honey. Antioxidant activity results were expressed as inhibitory concentration (IC
50) value ranged
from 4.58 to 5.54 mg mL-1. FT-IR spectra showed the presence of alcohols, carboxylic acids, esters, ethers, phenols,
and amines in both floral honey samples. This study discovered that coriander floral honey is more affluent than mustard floral honey in nutritional as well as medicinal aspects. At a glance the processing of honey by heating did not affect the phenolics, flavonoid, and antioxidants of honey; even processed honey contains higher phenols and antioxidants. The FT-IR spectra showed the similarity in both kinds of honey refers to chemical constituents. This study will help the researcher and honey consumer to find out the higher bioactive medicinal compounds containing honey.
Keywords:antioxidants; honey; nectar; phenolics; FT-IR spectroscopy
ABSTRAK
Fisikokimia, total fenolat, flavonoid, dan aktivitas antioksidan telah dievaluasi untuk karakterisasi biokimia dari ketumbar dan madu bunga mustard. Total fenolik, flavonoid dan aktivitas antioksidan dianalisis dengan menggunakan spektrofotometer UV-VIS. Spektroskopi infra merah transformasi Fourier (FT-IR) digunakan untuk mengevaluasi karakteristik kimia ketumbar dan madu bunga mustard. Kandungan total fenolat berkisar antara 294 sampai 462 mg setara asam gallat per-kg madu. Kandungan flavonoid total berkisar antara 43 sampai 53 mg setara kuersetin kg-1 madu. Hasil aktivitas antioksidan dinyatakan sebagai nilai konsentrasi inhibitor-50 (IC
50) berkisar
antara 4,58 sampai 5,54 mg mL-1. Spektra FT-IR menunjukkan adanya alkohol, asam karboksilat, ester, eter, fenol,
amina, dan sebagainya pada kedua sampel madu bunga. Studi ini menemukan bahwa madu beraroma bunga lebih kaya dari pada madu bunga mustard dalam nutrisi dan juga aspek obat. Sekilas pengolahan madu dengan pemanasan tidak mempengaruhi fenolat, flavonoid, dan antioksidan madu; Bahkan madu yang diolah mengandung fenol dan antioksidan yang lebih tinggi. Mengacu pada komponen kimia, spektrum FT-IR menunjukkan kesamaan pada kedua jenis madu. Penelitian ini akan membantu peneliti dan konsumen madu untuk mengetahui senyawa obat bioaktif yang lebih tinggi yang mengandung madu.
Kata kunci:antioksidan; madu; nektar; fenolat; spektroskopi FT-IR
INTRODUCTION
Coriander (Coriandrum sativum L.) seed contains several bioactive compounds while mustard oil is also having medicinal importance [1-2]. Honey bees collect nectar from flowers to produce honey. Coriander and mustard crops are having blooming flowering during crop season. Honey has been used by humanity for millions of years for nutrition and medicinal purposes. It is a
of cancer, heart disease, different inflammatory processes, wound healing, etc.
Volatile constituents are mainly responsible for aroma, which in concert with other factors such as taste and physical factors contribute to the flavor [6]. An emphasis on the origin of aroma constituents should lead to a better understanding of factors causing flavor differences in honey. Also, to distinguish the aroma of honey from different geological areas of origin, considerations should be made based on the variability of weather conditions, proximity to the water bodies and beekeeping practices [7].
Honey contains different biological properties, which includes antioxidant characteristic. The main antioxidants in this apiary product are phenolics and flavonoids [8-9]. Studies demonstrate that number of fruits, leaves, medicinal and aromatic herbs, and of some plants biosynthetic chemicals possessing antioxidant activity and may be used as a natural source of free radical scavenging compounds [10]. The majority of these plants flowers are used by the honey bees to collect nectar; consequently, floral origin bioactive components can be transferred to honey [11-12]. It is reported that the antioxidant activity and composition of honey depend on the floral source of nectar collected by the honeybee. Climatic factors and honey processing may also affect antioxidant activity [13].
Phenolics contents are responsible for free-radical scavenging and antioxidant activity. The important classes of bioactive compounds in honey are flavonoids [14-15].
Coriander essential oil contains several bioactive compounds while mustard oil also has medicinal importance. These bioactive metabolites may be transferred to honey. So, this study is conducted to evaluate the bioactive medicinal compounds in coriander and mustard floral honey which were not reported earlier in literature. In the present study total phenolics, total flavonoids, antioxidant activity and other physicochemical properties of coriander and mustard floral honey were investigated.
EXPERIMENTAL SECTION
Materials
Sample collection
The Unifloral Honey samples of Coriander (Coriandrum sativumL) and Mustard fromApis mellifera
were collected from AICRP on Honeybee and Pollinator, Centre of Agricultural Research Station Kota, Rajasthan, India. Uniformity of the honey sample was checked by cross-checking of honey slides with previously prepared pollen slide of coriander and mustard.
Sample processing
For honey processing, the honey sample was liquefied by heating the entire container containing raw honey in a hot water bath (70 °C), followed by cooling to room temperature. Next, liquid honey was centrifuged at 3500 rpm to separate the liquid honey from the beeswax. After centrifugation, the beeswax at the top of the liquid honey was removed, and the remaining liquid honey was filtered through a straining cloth [16].
Procedure
pH
The pH of honey samples was determined by taking sample in a clean beaker and pH was determined using a pH meter (Toshcon, CL 54+Model). The pH meter was calibrated with buffers at pH 4 and 7 [17].
Electrical conductivity
The electrical conductivity of honey samples were determined by taking a sample in a clean beaker using a conductivity meter (Labtronics, Model LT-16) [18].
Total ash content
Five gram of honey sample was weighed in a pre-weighed porcelain crucible dish; the organic matter was charred by igniting the sample on a hot plate in the fume hood. The crucibles were then transferred to muffle furnace maintained at 600 °C for 6 h after then cooled in a desiccator and weighed immediately [18].
Refractive index
Abbe type refractometer prism was opened (make: icon) and clean with soft cotton. A drop of the sample was placed on the lower part of the prism and closes the refractometer. The eyepiece was observed and turned the dispersion correction knob until the indistinct colored boundary seen between the light and dark field becomes a sharp line. Refractive index was read from the magnifier in the pointer and recorded the reading. The apparatus was calibrated against the distilled water which has a refractive index of 1.3325 at 25 °C [19].
Sugar content
boiled for 5 min. On cooling, the solution was neutralized with 10% NaOH and kept in a 250 mL volumetric flask. This solution was used for titration against Fehling’s solution [20].
Reducing sugar. Twenty-five gram of the sample was taken and transferred to 250 mL volumetric flask then 10 mL of neutral lead acetate solution was added to it and diluted to volume with water and filtered. An aliquot of 25 mL of the clarified filtrate was transferred to 500 mL volumetric flask containing about 100 mL water. Potassium oxalate was added in small amounts until there was no further precipitation and makeup to volume. The solution was well mixed and filtered through Whatman No. 1 filter paper then was transferred to 50 mL burette and titrated against 5 mL of each of Fehling A and B solution into 250 mL conical flask. As much as 2-3 drops of methylene blue were added for indication. The solution was added continuously dropwise until the blue color disappears to a brick-red endpoint [20]. Non-reducing sugar.It was estimated as the difference between the total sugar content and reducing sugar content on subtraction (total sugar-reducing sugar).
Moisture content
Moisture content was determined using AOAC official method 969.38, 2000 vacuum oven method 5 g honey sample was weighed in a pre-weighed aluminum drying dish and dried in a vacuum oven for constant weight at 70 °C and 25 mmHg pressure, then transferred in a desiccator and weighed after room temperature was attained [21].
Total solid content
Percent of total solids was determined using equation 1:
Total solids (%) = 100 - Moisture content % (1)
Total phenolics content
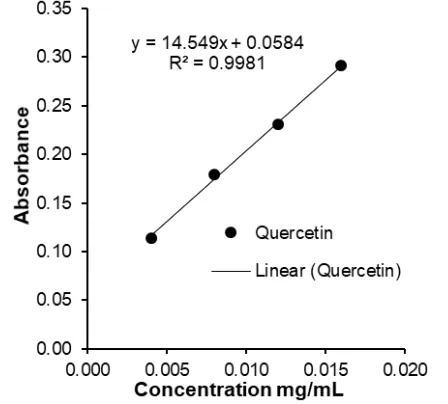
The total phenolic content was determined by the Folin-Ciocalteu method and the outcomes were expressed as mg gallic acid kg-1honey. Honey solutions were prepared at a concentration of 0.2 g mL-1. One mL of the stock solution was mixed with 1 mL of the Folin-Ciocalteu reagent and 4 mL of 20% sodium carbonate solution. Distilled water was added to make up final volume 25 mL. After incubation at room temperature for 30 min, the absorbance of the reaction mixture was measured at 765 nm using Thermo Scientific make spectrophotometer against a blank of distilled water. Gallic acid was used as the standard. The amount of total phenolic was calculated by using the standard curve (Fig. 1) of gallic acid drawn inside a concentration range of 8.0 x 10⁻⁴to 4.0 x 10⁻³mg mL-1having R2value 0.994 and was expressed as mg gallic acid equivalents kg-1(mg GAE kg-1) honey [11-12,15,22].
Fig 1.Linear curve of gallic acid reference standard
Fig 2.Linear Curve of Quercetin Reference Standard
Total flavonoid content
having R2 value 0.998 and was expressed as mg quercetin equivalents kg-1(mg QE kg-1) honey [15].
Antioxidant activity DPPH assay
There are several methods usually used to determine the antioxidant activity of natural products, we have preferred the 2,2-diphenyl-1-picryl-hydrazyl (DPPH) free radical reagent because it is an easy, precise, and accurate method. 2,2-Diphenyl-1-picryl-hydrazyl DPPH is a free radical and produces a violet solution in alcohol. It is reduced in the occurrence of an antioxidant molecule. Antioxidant activity of the Honey and standard was assessed by the radical scavenging effect of the stable 2,2-diphenyl-1-picrylhydrazyl hydrate radical (DPPH). The diluted test samples were prepared in methanol solvent. Gallic acid was used as the reference standard. A calibration curve was plot ranging from 5x10⁻⁴to 4x10⁻³mg mL-1. 0.135 mM DPPH solution was prepared in methanol. Then, 2 mL of this DPPH solution was mixed with 2 mL of honey sample solutions (ranged from 1 mg mL-1 to 8 mg mL-1), and the gallic acid standard solution was tested separately [9,23]. These solution mixtures were kept in the dark for 30 min, and optical density was measured at 517 nm using a Thermo Scientific make spectrophotometer against methanol blank. Two mL methanol along with 2 mL of 0.135 mM DPPH solution was used as a control. The optical density was recorded and percentage of inhibition was calculated using the equation 2:
Percent of inhibition of DPPH activity = (A–B/A) × 100 (2) where A is the optical density of the control and B is the optical density of the sample.
The IC50 values were calculated using linear regression of plots where the abscissa represented the concentration of the honey solution, and the ordinate was the percent of antioxidant activity [8,24-25].
ATR-FTIR spectroscopy
IR spectra were recorded using a Thermo Scientific Nicolet iS 10 series FTIR spectrophotometer with ATR (Attenuated total reflection) attachment and Thermo Omnic software. A drop of honey sample was placed on the surface of the ATR accessory. 100 scans were then recorded for each spectrum in the wavelength range between 4000-550 cm-1. After each measurement, the accessory was thoroughly washed with demineralized water and dried with a soft tissue [26-27].
Simple linear regression was used for statistical analysis in total phenolics, total flavonoids, and antioxidant activity determination. The coefficient of determination (R2) was calculated by simple linear regression equation in Microsoft Excel.
RESULT AND DISCUSSION
pH
The pH of honey samples was analyzed as API 2001 method. Coriander and Mustard honey had pH 4.54 and 3.93, respectively (Table 1). The pH value of both honey types was within the acidic pH range, complied the results reported by Lawal et al. [18].
Electrical Conductivity
Electrical conductivity of coriander honey was 0.211 mS cm-1while mustard honey had conductivity of 0.201 mS cm-1. M. Krpan et al. [11] reported electric conductivity of acacia honey i.e. 0.20 mS cm-1.
Ash Content
The coriander and mustard honey contained very small amount of ash (Table 1) as compare to Nigeria honey [28] acacia, sunflower, lime and multi flora honey [15].
Refractive Index
The coriander and mustard honey Refractive Index were 1.484 and 1.482, respectively.
Sugar Content
Sugar content of honey was analyzed by AOAC method. Results were presented in Table 1. The total sugar content of coriander and mustard honey was 65.52 and 59.30%, respectively; coriander honey contained 52.57% reducing sugar while mustard honey contained 54.85%. Non-reducing sugar in coriander honey was 12.94% while mustard honey had 4.45% non-reducing sugar.
Moisture Content
Table 1.Physico-chemical properties of coriander and mustard floral honey
Parameter Coriander floral honey Mustard floral honey
pH 4.57 ± 0.023 3.93 ± 0.025
Electrical conductivity (mS/cm) 0.211 ± 0.008 0.201 ± 0.009
Refractive index 1.484 ± 0.001 1.482 ± 0.001
Total ash (%) 0.18 ± 0.022 0.13 ± 0.027
Total sugar (%) 65.52 ± 0.546 59.30 ± 0.738
Reducing sugar (%) 52.57 ± 0.526 54.85 ± 1.059
Non reducing sugar (%) 12.94 ± 0.412 4.45 ± 0.892
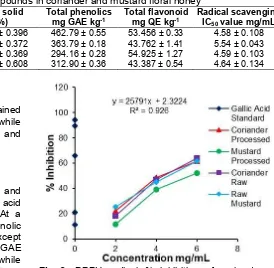
Table 2.Bioactive medicinal compounds in coriander and mustard floral honey
Honey type Moisture (%)
Total solid (%)
Total phenolics mg GAE kg-1
Total flavonoid mg QE kg-1
Radical scavenging IC50value mg/mL
Coriander processed honey 17.49 ± 0.396 82.51 ± 0.396 462.79 ± 0.55 53.456 ± 0.33 4.58 ± 0.108
Mustard processed honey 18.26 ± 0.372 81.74 ± 0.372 363.79 ± 0.18 43.762 ± 1.41 5.54 ± 0.043
Coriander raw honey 18.34 ± 0.369 81.66 ± 0.369 294.16 ± 0.28 54.925 ± 1.27 4.59 ± 0.103
Mustard raw honey 24.32 ± 0.608 75.68 ± 0.608 312.90 ± 0.36 43.387 ± 0.54 4.64 ± 0.134
Total Solid Content
Processed coriander and mustard honey contained 82.51 and 81.74% (w/w) total solids, respectively while raw coriander and mustard honey contained 81.66 and 75.68% (w/w) total solids.
Total Phenolics Content
The phenolic concentration of coriander and mustard honey ranged from 200 to 462 mg gallic acid equivalent kg-1 of honey (GAE kg-1) (Table 2). At a glance, coriander honey contained more phenolic compounds than mustard honey in all samples except raw honey. Highest phenolic content of 462.79 mg GAE kg-1 was recorded in coriander processed honey while raw coriander honey had 294.16 mg GAE kg-1. In mustard honey, the processed honey contains slightly more phenolic content than raw honey. Processed mustard honey had 363.79 mg GAE kg-1 phenolic and raw honey contained 312.90 mg GAE kg-1.
The total phenolic content of some honey samples has been previously determined. For example, Gheldof et al. [29] reported that total phenols of acacia honey were 4.6 mg GAE 100-1 g. Khalil et al. [22] evaluated Malaysian Tualang honey samples for phenolic content and reported 305.47 to 419.86 GAE kg-1. Jasicka-Misiak et al. [30] analyzed phenolics in Polish yellow sweet clover honey and reported 54.06 mg to 55.51 mg GAE 100-1 g of honey. The current study revealed that coriander honey contained more phenols than acacia and Tualang honey and slightly low phenols than Polish yellow sweet clover honey.
Total Flavonoid Content
The total flavonoid content in coriander and mustard honey ranged from 43.39 to 54.92 mg QE kg-1
Fig 3. DPPH radical % inhibition of coriander and mustard floral honey samples
(Table 2). At a glance, coriander honey contained more flavonoid compounds than mustard honey in all samples. Highest flavonoid content in coriander raw honey recorded 54.92 mg QE kg-1 which was closely followed by coriander processed honey (53.45 mg QE Kg-1). In mustard honey, the processed honey contained slightly more flavonoid content than raw honey. Processed mustard honey had 43.762 mg QE kg-1flavonoid and raw honey contained 43.387 mg QE kg-1.
As earlier reported in literature flavonoids content in Burkina Fasan honey was 0.17 to 8.35 mg of QE100-1g [31]. Paul et al. [32] analyzed twelve samples from different geographical areas of Bangladesh and
reported flavonoid ranged from 9.52–124.40 mg of
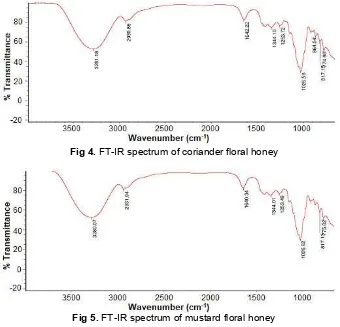
Fig 4.FT-IR spectrum of coriander floral honey
Fig 5.FT-IR spectrum of mustard floral honey
Table 3.FT-IR spectrum result of coriander and mustard floral honey
Wave number (cm-1)
Functional group Type of vibration Coriander floral
honey
Mustard floral honey
774.98 775.02 1°, 2° amines N–H wag
817.15 817.13 1°, 2° amines N–H wag
864.54 1°, 2° amines N–H wag
1026.58 1026.62 alcohols, carboxylic acids, esters, ethers C–O stretch
1253.72 1253.49 aromatic amines C–N stretch
1344.10 1344.01 nitro compounds N–O symmetric stretch
1642.22 1640.34 alkenes –C=C– stretch
2930.86 2931.94 alkanes C–H stretch
3281.18 3280.07 alcohols, phenols O–H stretch, H–bonded
Antioxidant Activity DPPH Assay
The evaluation of the antioxidant activity of each honey sample was determined based on the scavenging activity against the free radical 2,2-diphenyl-1-picryl-hydrazyl (DPPH) through the IC50 parameter, which represents the concentration of the material necessary to inhibit 50% of free radicals. Thus, a lower IC50value in honey indicates a greater ability to neutralize free radicals.
The scavenging ability of honey samples expressed as IC50on the DPPH˙ radical was shown in Table 2 which ranged from 4.58 to 5.54 mg mL-1.
Coriander processed honey had the highest antioxidant activity (4.58 mg mL-1) with at par to raw honey (4.59 mg mL-1). Mustard raw honey showed more antioxidant activity (4.64 mg mL-1) comparing to mustard processed honey (5.54 mg mL-1). Percent inhibition of DPPH radical by honey solution was presented in Fig. 3.
have low antioxidants with reference to coriander honey. Meda et al. [30] analyzed antioxidants activity of 27 honey samples which results in IC50 value ranging from 1.63 to 29.13 mg mL-1. Out of 27 samples only 2 samples rich in pollen content had low IC50comparing to coriander and mustard honey, three samples contains at par value and rest had higher IC50than coriander honey. This study strongly recommended coriander and mustard floral honey originated from the Rajasthan State of India as a potential source of antioxidants comparing to other floral honey. The current study demonstrated that the phenolic contents were partially responsible for antioxidant and antiradical activity of honey. The results were attributed to the differences in the phenols, flavonoids, and antioxidants which were dependent on the honey floral origin.
ATR-FTIR Spectroscopy
The IR spectra were recorded using a Thermo Scientific Make FT-IR equipped with a single reflection ATR accessory. The interpretation [34-36] of FT-IR spectrum of Coriander and Mustard floral honey shows the chemical composition of honey (Fig. 4 and 5). They contained alcohols, carboxylic acids, esters, ethers, phenols, amines, etc. (Table 3). Gok et al. [25] suggested that botanical origin of the nectar predominantly affects the chemical composition of honey. In this study, an attempt has been done for characterization of the coriander and mustard floral honey which differed from other floral honey [37-38]. But there no difference was found in both honey samples with respects to functional groups.
CONCLUSION
The current study demonstrated that the phenolic contents were partially responsible for antioxidant and antiradical activity of honey. The results were attributed to the differences in the phenols, flavonoids, and antioxidants which are dependent on the honey floral origin.
This was the first study to evaluate phenolics, flavonoids, and antioxidants from coriander and mustard floral honey. This study showed that the coriander and mustard floral honey from Rajasthan State of India contained phenolic compounds and had an excellent antioxidant and antiradical activities.
ACKNOWLEDGEMENT
The authors would like to acknowledge Professor K.N. Ojha, (Scientist and Principal Investigator, AICRP on Honeybee and Pollinator, Agricultural Research
Station Kota, Rajasthan, India) for providing honey samples for this study.
REFERENCES
[1] Saxena, S.N., Rathore, S.S., Maheshwari, G., Sharma, L.K., and Ranjan, J.K., 2016, Analysis of medicinally important compounds and anti-oxidant activity in solvent extracts of coriander (Coriandrum sativum L.) plant parts, J. Spices Aromat. Crops, 25 (1), 65–69.
[2] Janu, C., Kumar, D.R.S., Reshma, M.V., Jayamurthy, P., Sundaresan, A., and Nisha, P., 2014, Comparative study on the total phenolic content and radical scavenging activity of common edible vegetable oils, J. Food Biochem., 38 (1), 38–49.
[3] Abeshu, M.A., and Geleta, B., 2016, Medicinal uses of honey,Biol. Med., 8 (2), 1–7.
[4] Khan, I.U., Dubey, W., and Gupta, V., 2014, Medicinal properties of honey: A review, Int. J. Pure Appl. Biosci., 2 (5), 149–156.
[5] Viuda-Martos, M., Ruiz-Navajas, Y., Fernández-López, J., and Pérez-Alvarez, J.A., 2008, Functional properties of honey, propolis, and royal jelly,J. Food Sci., 73 (9), R117–R124.
[6] Baroni, M.V., Nores, M.L., Díaz, M.D.P., Chiabrando, G.A., Fassano, J.P., Costa, C., and Wunderlin, D.A., 2006, Determination of volatile organic compound patterns characteristic of five
unifloral honey by solid-phase microextraction−gas chromatography−mass spectrometry coupled to
chemometrics, J. Agric. Food Chem., 54 (19), 7235–7241.
[7] Castro-Várquez, L.M., Díaz-Maroto, M.C., de Tores, C., and Pérez-Coello, M.S., 2010, Effect of geographical origin on the chemical and sensory characteristics of chestnut honey, Food Res. Int., 43 (10), 2335–2340.
[8] Socha, R., Juszczak, L., Pietrzyk, S., and Fortuna, T., 2009, Antioxidant activity and phenolic composition of herbhoney, Food Chem., 113 (2), 568–574.
[9] Bertoncelj, J., Dobersek, U., Jamnik, M., and Golob, T., 2007, Evaluation of the phenolic content, antioxidant activity and colour of Slovenian honey,Food Chem., 105 (2), 822–828. [10] Al-Mamary, M., Al-Meeri, A., and Al-Habori, M.,
2002, Antioxidant activities and total phenolics of different types of honey,Nutr. Res., 22 (9), 1041– 1047.
[11] Krpan, M., Marković, K., Šarić, G., Skoko, B., Hruškar, M., and Vahčić, N., 2009, Antioxidant
activities and total phenolics of acacia honey,
[12] Silici, S., Sagdic, O., and Ekici, L., 2010, Total phenolic content, antiradical, antioxidant and antimicrobial activities of Rhododendron honey,
Food Chem., 121, 238–243.
[13] Maurya, S., Kushwaha, A.K., Singh, S., and Singh, G., 2014, An overview on antioxidative potential of honey from different flora and geographical origins,
Indian J. Nat. Prod. Res., 5 (1), 9–19.
[14] Chang, C.C., Yang, M.H., Wen, H.M., and Chern, J.C., 2002, Estimation of total flavonoid content in propolis by two complementary colorimetric methods,J. Food Drug Anal., 10 (3), 178–182. [15] Al, M.L., Daniel, D., Moise, A., Bobis, O., Laslo, L.,
and Bogdanov, S., 2009, Physico-chemical and bioactive properties of different floral origin honey from Romania,Food Chem., 112 (4), 863–867. [16] D’Arcy, B.R., 2005,Antioxidants in Australian Floral
Honey. Identification of Health-enhancing Nutrient
Components, Rural Industries Research and
Development Corporation Australian Government, Barton, ISSN 1440-6845, 27.
[17] The Ayurvedic Pharmacopoeia of India, 2001,
Government of India, Ministry of Health and Family Welfare, New Delhi, Department of AYUSH, Appendix-3.7, 161.
[18] Lawal, R.A., Lawal, A.K., and Adekalu, J.B., 2009, Physico-chemical studies on adulteration of honey in Nigeria,Pak. J. Biol. Sci., 12 (15), 1080–1084.
[19] The Ayurvedic Pharmacopoeia of India, 2001,
Government of India, Ministry of Health and Family Welfare, New Delhi, Department of AYUSH, Appendix-3.3, 156.
[20] I.S.I. Hand book of Food Analysis (Part II), 1984,
Sugars (Reducing) in Honey, AOAC Official
Methods of Analysis 920.183, 2000, 36.
[21] I.S.I. Hand book of Food Analysis (Part II), 1984,
Moisture in Honey, AOAC Official Methods of
Analysis 969.38, 2000, 35.
[22] Khalil, M.I., Sulaiman, S.A., Alam, N., and Ramli, N., Mohamed, M., Bai’e, S., and Hua, G.S., 2012, Content and antioxidant properties of processed Tualang honey (Agromas®) collected from different regions in Malaysia, Int. J. Pharm. Pharm. Sci., 4 (Suppl. 3), 214–219.
[23] Baltrušaitytė, V., Venskutonis, P.R., and Čeksterytė,
V., 2007, Radical scavenging activity of different floral origin honey and beebread phenolic extracts,
Food Chem., 101 (2), 502–514.
[24] Mensor, L.L., Menezes, F.S., Leitão, G.G., Reis, A.S., dos Santos, T.C., Coube, C.S., and Leitão, S.G., 2001, Screening of Brazilian plant extracts for antioxidant activity by the use of DPPH free radical method,Phytother. Res., 15 (2), 127–130.
[25] Ferreira, I.C.F.R., Aires, E., Barreira, J.C., and Estevinho, L.M., 2009, Antioxidant activity of
Portuguese honey samples: Different contributions of the entire honey and phenolic extract, Food Chem., 114 (3), 1438–1443.
[26] Gok, S., Severcan, M., Goormaghtigh, E., Kandemir, I., and Severcan, F., 2015, Differentiation of Anatolian honey samples from different botanical origins by ATR-FTIR spectroscopy using multivariate analysis, Food Chem., 170, 234–240.
[27] Ruoff, K., Iglesias, M.T., Luginbühl, W., Bosset, J.O., Bogdanov, S., and Amadò, R., 2006, Quantitative analysis of physical and chemical measurands in honey by mid-infrared spectrometry, Eur. Food Res. Technol., 223 (1), 22–29.
[28] Liberato, M.C.T.C., de Morais, S.M., Siqueira, S.M.C., de Menezes, J.E.S.A., Ramos, D.N., Machado, L.K.A., and Magalhães, I.L., Phenolic
content and antioxidant and
antiacetylcholinesterase properties of honey from different floral origins, 2011,J. Med. Food, 14 (6), 658–663.
[29] Gheldof, N., Wang, X.H., and Engeseth, N.J. 2002, Identification and quantification of antioxidant components of honey from various floral sources,Agric. Food Chem., 50, 5870–5877. [30] Jasicka-Misiak, I., Makowicz, E., and Stanek, N.,
2017, Polish yellow sweet clover (Melilotus officinalis L.) honey, chromatographic fingerprints, and chemical markers,Molecules, 22 (1), 138. [31] Meda, A., Lamien, C.E., Romito, M., Millogo, J.,
and Nacoulma, O.G., 2005, Determination of the total phenolic, flavonoid and proline contents in Burkina Fasan honey, as well as their radical scavenging activity,Food Chem., 91 (3), 571–577. [32] Paul, S., Hossen, M.S., Tanvir, E.M., Afroz, R.,
Hossen, D., Das, S., Bhoumik, N.C., Karim, N., Juliana, F.M., Gan, S.H., Khalil, M.I., 2017, Minerals, toxic heavy metals, and antioxidant properties of honey from Bangladesh, J. Chem., 2017, 1–11.
[33] Baretta, G., Granata, P., Ferrero, M., Orioli, M., and Facino, R.M., 2005, Standardization of anti-oxidant properties of honey by a combination of spectrophotometric/fluorimetric assays and chemometrics,Anal. Chim. Acta, 533, 185–191. [34] Lambert, J.B., 1987, Introduction to Organic
Spectroscopy, Macmillan Publication, New York, 174–177.
[35] Pavia, D.L., Lampman, G.M., and Kriz, G.S., 1979,
Introduction to Spectroscopy: A guide for Students
of Organic Chemistry, Saunders College,
Philadelphia, 3–80.
[36] Svečnjak, L., Bubalo, D., Baranović, G., and
spectroscopy for botanical authentication of unifloral honey types and melissopalynological data prediction,Eur. Food Res. Technol., 240 (6), 1101– 1115.
[37] Rios-Corripio, M.A., Rios-Leal, E., Rojas-López, M., and Delgado-Macuil, R., 2011, FTIR characterization of Mexican honey and its
adulteration with sugar syrups by using chemometric methods, J. Phys. Conf. Ser., 274, 1–5.