www.elsevier.com / locate / bres
Research report
Decreased benzodiazepine receptor density in the cerebellum of early
blind human subjects
a b a b
´
Sandra M. Sanabria-Bohorquez , Anne G. De Volder , Patricia Arno , Merence Sibomana ,
b b a ,
*
Ann Coppens , Christian Michel , Claude Veraart
a
´
Neural Rehabilitation Engineering Laboratory, GREN-5446, Universite Catholique de Louvain, Avenue Hippocrate, 54, B-1200 Brussels, Belgium
b
´
Positron Tomography Laboratory, Universite Catholique de Louvain, Brussels, Belgium
Accepted 26 September 2000
Abstract
As a first approach to study the effect of early visual deprivation in the GABA-ergic inhibitory system, the distribution of
11 11
benzodiazepine receptors (BZR) was accurately estimated using [ C]flumazenil ([ C]FMZ). Measurements were carried out in five
11
subjects who became blind early in life and in five sighted control subjects. The interactions between [ C]FMZ and BZR were described using a non-linear compartmental analysis which permitted to estimate the BZR synaptic density independently of other model parameters. The distribution of BZR in the visual areas and other cortical regions of blind subjects was qualitatively and quantitatively similar to that of controls. However, the BZR density in the cerebellum was significantly lower in blind than in control subjects (P,0.01). Our findings suggest that modifications of the cerebellar neural circuitry may be concomitant to the already observed compensatory reorganization in cerebral areas of blind subjects. 2001 Elsevier Science B.V. All rights reserved.
Theme: Neurotransmitters, modulators, transporters, and receptors
Topic: GABA receptors
11
Keywords: [ C]Flumazenil; Benzodiazepine receptors; Early blindness; Visual cortex; Cerebellum; Plasticity
1. Introduction According to this hypothesis, synaptic contacts would be
more numerous and / or hyperactive in EB visual areas Positron emission tomography (PET) studies have [13,58]. Besides, the decreased glucose metabolism level shown that the glucose metabolism in primary and associa- in the EB cerebellum suggests that early visual deprivation tive visual areas of early blind (EB) subjects at rest is may also alter the cerebellar neural organization.
comparable to that measured in sighted control (SC) The synaptogenesis process and the later phase of subjects with the eyes open, i.e. to the normally active synaptic elimination observed in primate cerebral cortex visual cortex [58,59]. Brain energy metabolism studies are accompanied by similar changes in several neuro-have demonstrated that the metabolic state of the EB visual transmitter receptor densities (dopaminergic, adrenergic, areas is related to neuronal activity [13]. Furthermore, the serotonergic, cholinergic, and GABAergic receptors) glucose utilization in the cerebellum of EB subjects was [36,37]. Moreover, since the interaction between neuro-significantly lower than in blindfolded SC subjects con- transmitters affects the neuronal cytoarchitecture and corti-trasting the findings in the visual areas [13]. cal developmental processes [17,21,30,31], the combina-The increased metabolism in EB visual cortex has been tion of morphological and neurochemical studies may attributed to the alteration of the phase of synaptic provide further insight on the effects of sensory depriva-elimination following the synaptogenesis process during tion.
brain development, due to the lack of visual stimuli [58]. As a first approach to study in vivo the chemical circuitry of the human brain in the case of early blindness,
11 11
we have used [ C]flumazenil ([ C]FMZ) to quantify the *Corresponding author. Tel.:132-2-764-5446; fax:132-2-764-9422.
E-mail address: [email protected] (C. Veraart). benzodiazepine (BZ) receptor density of EB and SC
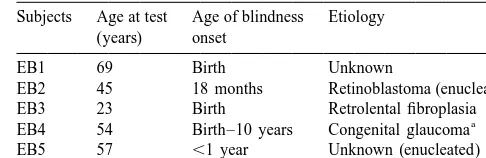
11 Table 1
subjects. [ C]FMZ is a BZ antagonist widely used in
Characteristics of the early-blind subjects human brain studies using positron emission tomography
Subjects Age at test Age of blindness Etiology (PET). BZ receptors (BZR) are functionally associated to
(years) onset GABAA receptors which are made up of pentameric
assemblies of subunits (a, b,g,d, r) that form a chloride EB1 69 Birth Unknown
2 EB2 45 18 months Retinoblastoma (enucleated)
channel. The Cl conductance increases when GABA
EB3 23 Birth Retrolental fibroplasia
binds to theb-subunit and the effect is facilitated when BZ a
EB4 54 Birth–10 years Congenital glaucoma binds to the ag subunit complex in the same channel EB5 57 ,1 year Unknown (enucleated) [11,53]. FMZ binds to most of the GABAA receptors a
EB4 had very poor vision from birth. Loss of the right eye at the age of resulting from different subunit combinations in mam- 6 months, and definitive loss of the left eye at 10 years.
malian brain, except to those containing d subunit [53]. The FMZ affinity for receptors containing a6 subunit is
lower than the affinity for receptors with a1 subunit proved by the Medical Ethics Committee of the School of ´
[27,53]. GABA receptors containingA a6 subunit are only Medicine at the Universite Catholique de Louvain. expressed in cerebellar granule cells and represent 45% of
11
all GABA receptors in the rat cerebellum [26].A 2.2. Synthesis of [ C]FMZ The kinetics of in vivo ligand binding of FMZ to central
11 11
BZR was described using a nonlinear three compartment [ C]FMZ ([Methyl- C] Ro 15-1788) was labelled by model [15]. The model parameters were accurately esti- N-alkylation of the desmethyl compound (Ro 15-5528)
11
mated by using a three-injection protocol which guarantees with anhydrous [ C]methyl iodide in acetone by use of
11
a unique solution and small parameter estimation un- sodium hydroxide as base [20]. [ C]FMZ was purified by certainties [15,16]. The input curve to the compartmental semi-preparative reverse phase using high-performance model was obtained by applying a metabolite correction liquid chromatography (HPLC). The HPLC columns used
11
method which estimates the relative fraction of [ C]FMZ were Alltech Econosil with 0.01M H PO / acetonitrile and3 4
in the total radioactivity in plasma curve from the tissue 70 / 30 as eluent. The radiopharmaceutical formulation has kinetic data without the need for actual FMZ metabolite been performed following a method that uses a C18
Sep-measurements [52]. Pak Plus cartridge from Waters [7].
11
Labeling and quantification of BZR using [ C]FMZ
may provide information on the effects of early blindness 2.3. Experimental protocol on the distribution of GABA receptors in the cerebral andA
cerebellar cortex of human subjects. The effect of visual The experimental protocol lasted 90 min and consisted
11
deprivation on the distribution of GABA neurons and its of three injections of [ C]FMZ and / or unlabeled FMZ
11
receptors in visual brain areas has been mainly studied in [15]. Firstly, an injection of about 370 MBq of [ C]FMZ cases of monocular deprivation in adult monkeys [8,21– with high specific activity was performed and 30 min later 23]. However, the effect of early binocular deprivation on a displacement injection of 0.7 mg of unlabeled FMZ was GABA distribution, to our knowledge, has not been performed. At 60 min, a coinjection of approximately 160
11
reported, neither in animals nor in humans. This study may MBq of [ C]FMZ and 1.2 mg of unlabeled FMZ was provide insight on the contribution of such inhibitory made. The specific activity of the first injection ranged synapses to the measured abnormal metabolism in the EB from 5300 to 16200 MBq /mmol. Each time, the FMZ was visual cortex and cerebellum [13,58]. injected as a bolus of 30 s through a 22-gauge catheter (AbbocathE) in a forearm vein. A 24-gauge catheter (AbbocathE) was inserted in the radial artery of the other arm under local anesthesia with bipuvacaine for blood
2. Materials and methods sampling. After the labeled tracer injections (at 0 and 60
min), blood samples (|0.2 ml) were withdrawn manually
2.1. Subjects as quickly as possible (every 3 or 4 s) for the first 2 min.
Thereafter, the sampling interval increased progressively to Five male volunteers with peripheral blindness of early about 10 min. The selected timing allowed a good sam-onset (Table 1) and five sighted control subjects partici- pling of the plasma curve for the 30-s bolus injection. The
11
pated in this study. EB subjects had no residual light plasma curves were corrected for C decay and expressed
11
perception, but were otherwise neurological normal. EB in pmol / ml by using initial specific activity of [ C]FMZ. and SC subject mean ages were 49617 and 42613 years,
respectively (P50.46). None of the subjects was under any 2.4. PET imaging medication. All subjects gave their informed consent
res-S.M. Sanabria-Bohorquez et al. / Brain Research 888 (2001) 203 –211 205 olution scanner. Transaxial resolution is approximately 4 describe simple diffusive transport of FMZ between the mm full width at half maximum (FWHM) at the center of plasma and free tracer compartments. The association and the field of view (FOV), and decreases to 6.75 mm FWHM the dissociation rate constants (kon and koff, respectively) at 20 cm from the center. The axial resolution is 4 mm describe the FMZ exchange between the free and spe-FWHM at FOV center [61]. Acquisition was performed in cifically bound tracer compartments. The equilibrium three-dimensional (3D) mode and images were recon- dissociation constant (K ) was obtained from the ratiod
structed using the 3D reprojection (3DRP) algorithm [32] between koff and k . When describing in vivo reversibleon
including scatter correction [60]. A Hanning filter with a binding, Kd corresponds to the ligand concentration at 70% relative frequency cutoff was used in both transaxial which half of the receptors are bounded to the ligand. If a and axial directions to achieve a quasi isotropic spatial ligand act at low concentrations on a receptor, the K valued
resolution of about 8 mm in the whole brain. For each is low and the ligand is said to have high affinity for those subject, a 15-min transmission scan was performed prior to receptors. The complete description of the compartmental tracer administration to estimate attenuation correction. model can be found in the work of Delforge et al. [15].
68
The transmission scan used three rotating Ge rod sources The vascular compartment in the model only accounts
11
with electronic windowing, so attenuation is scatter free. A for the concentration of [ C]FMZ in plasma because none
11
sequence of 16 frames was obtained after each injection of the [ C]FMZ metabolites crosses the blood–brain (8315, 3360, and 53300 s), and 47 contiguous transaxial barrier (BBB) [14]. For each subject, the contribution of slices were reconstructed with a voxel size of 2 mm in radioactive metabolites to the total plasma curve was tomographic direction and 3.125 mm in axial direction. estimated by applying a mathematical correction method
11
The head of each subject was positioned in the scanner not requiring additional [ C]FMZ metabolite measure-FOV by aligning two sets of low power laser beams with ment [52]. The model equations were solved numerically the canthomeatal and the mid-saggital lines. Adhesive by applying the Levenberg–Marquardt method [48] and bands were used to minimize head movements during the parameter coefficients of variation were obtained from the
study. covariance matrix resulting from the sensitivity function
Three-dimensional magnetic resonance images (MRI) matrix of the weighted least-squares minimization [9,16].
were obtained on a 0.5 Tesla Philips Gyroscan unit using Programs were implemented inMATLAB (The MathWorks,
the Fast Field Echo technique. T-1 weighted images (TR5 Inc., Natick, MA). 30 ms, TE513 ms, flip angle5308, slice thickness52 mm)
were obtained in the bicommissural (AC–PC) orientation. 2.5.2. Regions of interest
Before delineating regions of interest (ROI), PET and
2.5. Data analysis MRI data were processed as follows. First, a summed PET
image was obtained from the first 16 frames after the first
11
2.5.1. Kinetic model [ C]FMZ injection. Then, for each subject, the summed
11
The kinetics of in vivo ligand binding of [ C]FMZ to PET image was realigned to the MRI using the AIR central BZ receptors was based on compartmental analysis package [62,63]. SPM96 (Wellcome Department of Cogni-[15]. The model considered here includes the plasma space tive Neurology, Institute of Neurology, London, UK) was together with two extra-vascular compartments represent- used to normalize the matching MRI and summed PET ing the ligand in tissue (free and non-specifically bound images in the Talairach and Tournoux coordinate system FMZ) and the ligand specifically bound to BZR (Fig. 1). [56] with a 2-mm cubic voxel. The accuracy of realign-This model is non-linear with four rate constants (k , k ,1 2 ment and normalization procedures were assessed with an
k , kon off) plus the concentration of the receptor sites interactive home made image display software [44] im-available for binding (Bmax). The rate constants k and k1 2 plemented in IDL language (IDL Research System, Inc.).
11 11
Fig. 1. Compartmental model for [ C]FMZ–BZR interactions. The intravascular compartment represents the concentration of non-metabolized [ C]FMZ
11
* * *
in plasma, C (t). Extravascular compartments account for free ligand, C (t), and [ C]FMZ bound to BZR, C (t). The rate of binding of the free ligandp f b
*
Subsequently, the spatial transformer obtained for the TACs corresponded to the mean radioactivity
concen-11
summed PET image normalization was applied to each tration on the defined VOI corrected for C decay. For frame of the kinetic PET study. Since MRI was not each VOI, the BZR density Bmaxand the four rate constants available for one of the control subjects, a FMZ template were obtained by fitting the kinetic model to the ex-was obtained by averaging the normalized PET images of perimental TACs.
the four other control subjects. This template was then used to normalize the summed and kinetic PET images in the Talairach and Tournoux coordinate system.
Using the image analysis program Mediman [10], ROIs 3. Results were delineated by taking in consideration the activity on
the normalized static PET image and anatomical landmarks The fitting of the compartmental model to the ex-on the MRI. ROIs were named following the Talairach and perimental TACs allowed the estimation of the five Tournoux nomenclature [56]. For all subjects, volumes of compartmental parameters for all the brain regions consid-interest (VOIs) were subsequently obtained from several ered in all subjects. For Bmax and K , the standardd
ROIs drawn on consecutive planes all over the cerebral variations obtained from the covariance matrix for all cortex and on the cerebellum. Special attention was made subjects were mostly below 12 and 25%, respectively.
11
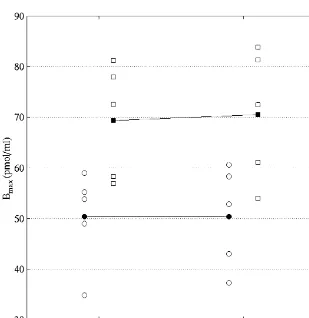
on the ROIs in the occipital region where the primary and The overall distribution of [ C]FMZ in the brain of EB associative visual cortices were considered separately. subjects appeared qualitatively similar to that of SC Since the spatial resolution of PET and MRI images does subjects. For all subjects, the highest Bmax value was not allow to distinguish the exact border between the observed in region BA 17-18, and the lowest values were striate cortex and the visual areas surrounding it, the found in the cerebellum. Fig. 2 shows the mean Bmax in primary visual cortex included BA-17 and part of BA-18. visual areas, parietal, temporal, frontal cortices and cere-In addition to the occipital regions in the cerebral cortex, bellum for the EB and SC groups.
VOIs were obtained in the parietal, temporal and frontal An ANOVA showed no significant main effect for the regions. The template of VOIs was subsequently projected type of subject factor, F(1,8)53.2, P.0.05; no significant
11
on each normalized kinetic study and the [ C]FMZ time main effect for the side factor, F(1,8)51.1, P.0.05; but a activity curves (TACs) were obtained by using Mediman. significant main effect for VOI factor, F(6,48)577, P,
Fig. 2. B mean values in visual areas (BA 17-18 and BA 19), parietal, temporal, frontal cortices and cerebellum of EB (s) and SC (h) subjects. Brain
max
distribution of BZR in cortical areas is qualitatively and quantitatively similar for all subjects. However, Bmaxestimates in the cerebellum is significantly ´
S.M. Sanabria-Bohorquez et al. / Brain Research 888 (2001) 203 –211 207 0.05. Similarly, the interaction between type of subject and was significantly higher than the K value in all cerebrald
VOI was significant, F(6,48)53.6, P,0.05. Bmaxestimates cortex VOIs (P,0.05). for all the regions considered in the cerebral cortex were
similar in both groups of subjects (P.0.05) as shown by ´
post-hoc comparisons using a Scheffe criterion. However, 4. Discussion the Bmax value in the cerebellum of EB subjects appeared
significantly lower than that in SC subjects (P,0.05, In EB subjects, the overall distribution of BZR in visual ´
Scheffe criterion). Fig. 3 shows the mean and individual areas, as well as in other cerebral cortical regions was
Bmax estimates in both cerebellar hemispheres for the EB qualitatively and quantitatively similar to that in SC
and SC groups. subjects. However, Bmax was significantly lower in the
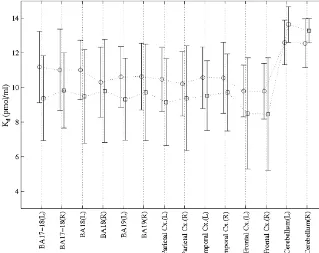
Fig. 4 shows the mean K for the EB and SC groups ind cerebellar cortex of EB subjects as compared to control visual areas, parietal, temporal, frontal cortices and cere- values. Kd estimates showed no significant differences bellum. A large interindividual variation was observed for between both group of subjects in any of the brain areas
Kd estimates in all brain regions considered. However, considered. Although a large interindividual variation was published Kd estimates using the same analysis method observed for K , the highest K values were found in thed d
[15] and other methods [34,49] exhibit similar intersubject cerebellum of all subjects. variability. An ANOVA showed no significant main effect
for the type of subject factor, F(1,8)50.39, P.0.05; no 4.1. Methodological considerations significant main effect for the side factor, F(1,8)50.02,
P.0.05; but a significant main effect for VOI factor, The feasibility of obtaining parametric images of BZR
F(6,48)532, P,0.05. The interaction between type of density from our studies was limited by the time required subject and VOI was not significant, F(6,48)52.3, P. in the model fitting procedure. When analyzing kinetic data
´
0.05. Post-hoc comparisons for VOI factor using a Scheffe on a voxel by voxel basis, linear compartmental model
11
criterion showed that the mean K value in the cerebellumd using a single [ C]FMZ injection protocol [18,33] are less
Fig. 3. B values in the cerebellar hemispheres of EB (s) and SC (h) subjects. Filled symbols correspond to B group mean values. Open symbols
max max
Fig. 4. K mean values in visual areas (BA 17-18 and BA 19), parietal, temporal frontal cortices and cerebellum of EB (d s) and SC (h) subjects. Error bars correspond to the standard deviation of the group mean values. Units are in pmol / ml.
time consuming procedures. However, such simplified overall tracer affinity for all types of BZR in the cerebellar approach only allows to estimate a quantity related to the cortex. Therefore, the Bmax values in the EB cerebellum ratio of Bmax and K [18,33].d may reflect an overall reduction of all types of BZR to With our three-injection protocol, no model simplifica- which FMZ binds. The reduction in the GABA receptorsA
tion was required and absolute values for the BZ receptor to which BZR are associated could be compensated by an density were estimated independently of the other model increase of other types of GABA receptors to which FMZA
parameters. In addition, normalization of the MRI and does not bind, for example, those containing ad subunit. kinetic PET data to the Talairach and Tournoux coordinate However, the localization and pharmaceutical properties of system allowed us to delineate a template of ROIs on dsubunit-containing receptors make this possibility unlike-precise anatomical structures and to compare the regional ly [47].
Bmax and K estimates between subjects on a systematicd The decreased FMZ binding could result from neuronal
basis. loss and / or deafferentation of the EB cerebellum from
CNS projections. Nevertheless, the normal neurological 4.2. BZR density in the cerebellum and behavioral characteristics of the studied EB subjects prevent to consider this hypothetical fact as pathological In the cerebellar cortex, Bmax was significantly lower in condition but as an adaptive mechanism (see below). EB subjects as compared to SC values whereas Kd Likewise, an increase of benzodiazepine-like compounds estimates were similar for both groups of subjects. For all could produce a reduction on the BZR available for subjects, the highest Kd estimates were obtained in the binding. Since all subjects participating in our study were cerebellum. Although our results appear higher than those medication free and neurological normal, the only possible reported by Delforge et al. [15], they are in agreement with source of benzodiazepine would be a putative endogenous the results of Lassen et al. [34] and Price et al. [49]. The ligand or from dietary origin [2,39]. However, both
K values reported by both authors [34,49] are comparabled possibilities seem unlikely since the decrease of FMZ or even higher in the cerebellum than in other brain binding is restricted to the cerebellum, and given the structures. The higher K estimates in the cerebellum withd normal neurological state and general healthy condition of respect to the cerebral cortex values may be related to the the EB subjects in our study.
S.M. Sanabria-Bohorquez et al. / Brain Research 888 (2001) 203 –211 209 data. For example, spike timing and spike rate control of excitatory) was found on spines (65 versus 12% of the Purkinje cells are affected by the inhibitory contacts symmetrical contacts), a higher excitatory state would be from basket and stellate cells in the molecular layer of the expected in EB animals, and as suggested by Bourgeois cerebellar cortex [24,25]. Also, the inhibitory connections and Rakic [5], consistent with the hypermetabolism ob-of the golgi cells synchronize the parallel fiber activity and served in the visual cortex of EB human subjects [58,59]. influence the timing of granule cells spikes by way of the With respect to synapses situated on dendritic shafts, feedback inhibitory loop made up by these two types of about equal proportions of symmetrical (37%) and neurons and their projections [12]. In vitro results obtained asymmetrical (39%) contacts were found. Therefore, a from whole-cell recordings in rat cerebellum have shown reduction of shaft synaptic density would produce a similar that the activation of an excitatory synaptic input in relative reduction of both symmetrical and asymmetrical Purkinje cells can induce a long-lasting increase of the contacts. Since symmetrical synapses in the striate visual postsynaptic GABAA receptor sensitivity or ‘rebound cortex of monkeys are mainly inhibitory and use GABA as potentiation’ [28,29]. This rebound potentiation controls neurotransmitter [4], a proportional reduction of the the excitability of Purkinje neurons, and may be a form of GABA receptor density in layer IV would be expected. synaptic plasticity in the cerebellum. However, the similar values we obtained for the BZR Traditionally, the cerebellum has been considered exclu- density in EB and in SC subjects suggest that a small sively as a motor control system. However, functional reduction in BZR receptors might not be detected using mapping studies have shown activation of the cerebellum PET due to the low percentage of inhibitory synapses. In during non-motor tasks (e.g. [3,45,46]) such as acquisition the monkey striate visual cortex, the relative proportion of and analysis of sensory information [19,54,55], attention GABA synapses reaches 17 and 22% in all layers together [1], cognitive and language functions [35]. Moreover, the and in layer IV, respectively [4].
participation of the cerebellum seems to be more important The possibility of finding a normal inhibitory synaptic during learning or when per forming complex tasks [1,6]. density together with a higher proportion of excitatory Since plasticity highly depends on the interaction of contacts in EB striate cortex cannot be excluded. During sensory with motor experience [50], the motor and / or maturation, the synaptogenis and the subsequent synaptic non-motor character of cerebellar function highlights the revision processes in the layer IV of monkey striate cortex importance of the cerebellum during brain development. are accompanied by a redistribution of synaptic contacts Furthermore, the EB cerebellar BZR density reduction [41–43]. During postnatal development, symmetric and suggests that the different development of cerebral cortical asymmetric contacts initially situated on the cell bodies areas of EB subjects may be concomitant to modifications and dendritic shafts, respectively, spread out to dendritic in the neural network of the cerebellum. Hypothetically, shafts and spines, respectively. However, in the absence of this BZR downregulation could result in lower neuronal visual modulatory inputs, asymmetric contacts that normal-threshold that could optimize the use of the remaining ly would stay in synaptic shafts continue to extend to the sensory information reaching the cerebellum. An addition- increased number of synaptic spines, whereas symmetrical al argument for this hypothesis may be obtained from synapses density in shafts maintain control levels [40]. activation studies showing a regional cerebral blood flow The resulting alterations between inhibitory and excitat-(rCBF) increase both in the visual areas and cerebellum ory contributions, leading to a higher proportion of excitat-during Braille reading and excitat-during non-Braille tactile tasks ory contacts in the visual areas, may explain the excitatory in case of early blindness [51,57]. Moreover, the activation state found at adult age in the visual areas of EB subjects. of these areas was significantly larger in EB subjects as In addition and as our results suggest, the possible compared to SC subjects when performing non-Braille reduction on the GABAA receptor density in the striate tactile tasks [51]. visual cortex may be less important than the measured shift of the neural circuitry to a higher excitatory state 4.3. BZR density in the visual cortex [13,58,59].
The effect of early sensory deprivation on the
synap-togenesis process and the subsequent phase of synaptic 5. Conclusion revision in the striate visual cortex has been studied in
monkeys who were bilaterally enucleated before birth [5]. The principal effect of early visual deprivation on the The mean synaptic density of the 3 year-old operated brain BZR distribution appears to be a diminution of this animal was found to be similar to that of age matched type of receptor in the EB cerebellar cortex. Our findings normal animals. However, in layer IV of the striate cortex, suggest that plastic changes in the cerebellum of EB the proportion of synaptic contacts on the dendritic spines subjects during development would be concomitant to was larger than the proportion of contacts on the dendritic those already observed in the cerebral cortex.
Jobert, C. Crouzel, A. Syrota, Quantification of benzodiazepine
may be related to a higher proportion of excitatory 11
receptors in human brain using PET, [ C]FMZ and a single synapses and / or to alterations of the neural activity due to
experiment protocol, J. Cereb. Blood Flow Metab. 15 (1995) 284– the imbalance of excitatory and inhibitory connections. 300.
[16] J. Delforge, A. Syrota, B. Mazoyer, Experimental design optimi-zation: theory and application to estimation receptor model parame-ters using dynamic positron emission tomography, Phys. Med. Biol.
Acknowledgements
34 (1989) 479–485.
[17] K. Fox, N.W. Daw, Do NMDA receptors have a critical function in The authors are grateful to the blind volunteers who visual cortical plasticity?, Trends Neurosci. 16 (1993) 116–122. participated in this study. We thank Dr Daniel Labar for [18] K.A. Frey, V.A. Holthoff, R.A. Koeppe, D.M. Jewett, M.R. Kil-isotope preparation, to Dr Guy Cosnard and Dr Cecile bourn, D.E. Kuhl, Parametric in vivo imaging of benzodiazepine receptor distribution in human brain, Ann. Neurol. 30 (1991) 663– Grandin for MRI studies and to Raymond Bausart for
672. technical assistance during data acquisition. ADV and CM
[19] J. H Gao, L.M. Parsons, J. M Bower, J. Xiong, J. Li, P.T. Fox, are research associates of the Belgian National Fund for Cerebellum implicated in sensory acquisition and discrimination Scientific Research. This work was partially supported by rather than motor control, Science 272 (1996) 545–545.
grant 3.4524.94 from the Belgian Foundation for Medical [20] C. Halldin, S. Stone-Elander, J.O. Thorell, A. Persson, G. Sedvall,
11
C-labelling of Ro 15-1788 in two different positions, and also Scientific Research to CV.
11
C-labelling of its main metabolite Ro 15-3890, for PET studies of benzodiazepine receptors, Int. J. Radiat. Appl. Instrum. A 39 (1988) 993–997.
References [21] S.H.C. Hendry, R.K. Carder, Organization and plasticity of gaba
neurons and receptors in monkey visual cortex, Prog. Brain Res. 90 (1992) 477–502.
[1] G. Allen, R.B. Buxton, E.C. Wong, E. Courchesne, Attentional
[22] S.H.C. Hendry, J. Fuchs, A.L. de Blas, E.G. Jones, Distribution and activation of the cerebellum independent of motor involvement,
plasticity of immunocytochemically localized GABA receptors in
Science 275 (1997) 1940–1943. A
adult monkey visual cortex, J. Neurosci. 10 (1990) 2438–2450. [2] M. Baraldi, R. Avallone, L. Corsi, I. Venturini, C. Baraldi, M.L.
Zeneroli, Endogenous benzodiazepines, Therapie 55 (2000) 143– [23] S.H.C. Hendry, M.M. Huntsman, A. Vinuela, H. Mohler, A.L. Blas,
146. E.G. Jones, GABAA receptor subunit immunoreactivity in primary
[3] M. Barinaga, The cerebellum: movement coordinator or much more, visual cortex: distribution in macaques and humans and regulation Science 272 (1996) 482–483. by visual input in adulthood, J. Neurosci. 14 (1994) 2383–2401. [4] C. Beaulieu, Z. Kisvarday, P. Somogyi, M. Cynader, A. Cowey, [24] D. Jaeger, J.M. Bower, Synaptic control of spiking in cerebellar
Quantitative distribution of gaba-immunopositive and -immuno- Purkinje cells: dynamic current clamp based on model conductances, negative neurons and synapses in the monkey striate cortex (area J. Neurosci. 19 (1999) 6090–6101.
17), Cereb. Cortex 2 (1992) 295–309. [25] D. Jaeger, E. De Schutter, J.M. Bower, The role of synaptic and [5] J.P. Bourgeois, P. Rakic, Synaptogenesis in the occipital cortex of voltage-gated currents in the control of Purkinje cell spiking: a
macaque monkey devoid of retinal input from early embryonic modeling study, J. Neurosci. 17 (1997) 91–106.
stages, Eur. J. Neurosci. 8 (1996) 942–950. [26] M. Jechlinger, R. Pelz, V. Tretter, T. Klausberger, W. Sieghart, [6] J.M. Bower, Control of sensory data acquisition, Int. Rev. Neuro- Subunit composition and quantitative importance of hetero-biol. 41 (1997) 489–513. ologomeric receptors: GABAA receptors containinga6subunits, J. [7] C. Brihaye, C. Lemaire, P. Damhaut, A. Plenevaux, D. Comar, Neurosci. 18 (1998) 2449–2457.
18 18
Robot-assisted synthesis of [ F]Altanserin, 4-[ F]Fluorotropapride, [27] A. Jones, E.R. Korpi, R.M. McKernan, R. Pelz, Z. Nusser, R.
18 18
6-[ F]Fluoro-L-Dopa and 2-[ F]Fluoro-L-Tyrosine, J. Label. Comp. Makela, J.R. Mellor, S. Pollard, S. Bahn, F.A. Stephenson, A.D. Radiopharm. 35 (1994) 160–162. Randall, W. Sieghart, P. Somogyi, A.J. H Smith, W. Wisden, Ligand-[8] R.K. Carder, S.S. Leclerc, S.H. C Hendry, Regulation of calcium- gated ion channel subunit partnerships: GABA receptorA a6subunit binding protein immunoreactivity in GABA neurons of macaque gene inactivation inhibits d subunit expression, J. Neurosci. 17 primary visual cortex, Cereb. Cortex 6 (1996) 271–287. (1997) 1350–1362.
21 [9] C. Cobelli, J. DiStefano, Parameter and structural identifiability [28] M. Kano, M. Kano, K. Fukunaga, A. Konnerth, Ca -induced
concepts and ambiguities: a critical review and analysis, Am. J. rebound potentiation of g-aminobutyric acid-mediated currents
21
Physiol. 239 (1980) R7–R24. requires activation of Ca / calmodulin-dependent kinase II, Proc. [10] A. Coppens, M. Sibomana, A. Bol, C. Michel, MEDIMAN: an Natl. Acad. Sci. USA 93 (1996) 13351–13356.
object oriented programming approach for medical image analysis, [29] M. Kano, U. Rexhausen, J. Dreessen, A. Konnerth, Synaptic IEEE Trans. Nucl. Sci. 40 (1993) 950–955. excitation produces a long-lasting rebound potentiation of inhibitory [11] E. Costa, A. Guidotti, Benzodiazepines on trial: a research strategy synaptic signals in cerebellar Purkinje cells, Nature 356 (1992)
for their rehabilitation, Trends Pharm. Sci. 17 (1996) 192–200. 601–604.
[12] E. De Schutter, B.P. Vos, R. Maex, The function of Golgi cells [30] T. Kasamatsu, Enhancement of neural plasticity by activating the revisited, Prog. Brain. Res. 124 (2000) 81–93. norepinephrine system in the brain: a remedy for amblyopia, Hum. [13] A.G. De Volder, A. Bol, J. Blin, A. Robert, P. Arno, C. Grandin, C. Neurobiol. 1 (1982) 49–54.
Michel, C. Verrart, Brain energy metabolism in early-blind subjects: [31] T. Kasamatsu, J.D. Pettigrew, Depletion of brain catecholamines: neural activity in the visual cortex, Brain. Res. 750 (1997) 235–244. failure of ocular dominance shift after monocular occlusion in [14] D. Debruyne, P. Abadie, L. Barre, F. Albessard, M. Moulin, E. kittens, Science 194 (1976) 206–209.
Zarifian, J. Baron, Plasma pharmacokinetics and metabolism of the [32] P.E. Kinahan, J.G. Rogers, Analytic three-dimensional image
recon-11
benzodiazepine antagonist C-Ro 15-1788 (flumazenil) in baboon struction using all detected events, IEEE Trans. Nucl. Sci. NS–36 and human during positron emission tomography studies, Eur. J. (1989) 964–968.
Drug Metab. Pharmacokinet. 16 (1991) 141–152. [33] R.A. Koeppe, V.A. Holthoff, K.A. Frey, M.R. Kilbourn, D.E. Kuhl,
11
S.M. Sanabria-Bohorquez et al. / Brain Research 888 (2001) 203 –211 211 ligand transport rate and receptor distribution using PET, J. Cereb. [49] J. Price, H. Mayberg, R. Dannals, A. Wilson, H. Ravert, B. Sadzot, Blood Flow Metab. 11 (1991) 735–744. Z. Rattner, A. Kimball, M. Feldman, J. Frost, Measurement of [34] N.A. Lassen, P.A. Bartenstein, A.A. Lammertsma, M.C. Prevett, benzodiazepine receptor number and affinity in humans using tracer
11
D.R. Turton, S.K. Luthra, S. Osman, P.M. Bloomfield, T. Jones, P.N. kinetic modeling and PET and [ C]FMZ, J. Cereb. Blood Flow Patsalos, M.T. O’Connell, J.S. Duncan, J. Vanggaard Andersen, Metab. 13 (1993) 656–667.
Benzodiazepine receptor quantification in vivo in humans using [50] J.P. Rauschecker, Compensatory plasticity and sensory substitution
11
[ C]FMZ and PET: application of the steady-state principle, J. in the cerebral cortex, Trends Neurosci. 18 (1995) 36–43. ˜ Cereb. Blood Flow Metab. 15 (1995) 152–165. [51] N. Sadato, A. Pascual-Leone, J. Grafman, M.P. Deiber, V. Ibanez, M. [35] H.C. Leiner, A.L. Leiner, R.S. Dow, Cognitive and language Hallett, Neural networks for Braille reading by the blind, Brain 121
functions of the human cerebellum, Trends Neurosci. 16 (1993) (1998) 1213–1229.
´ `
444–447. [52] S.M. Sanabria-Bohorquez, D. Labar, P. Leveque, A. Bol, A.G. De [36] M.S. Lidow, P.S. Goldman-Rakic, P. Rakic, Synchronized over- Volder, C. Michel, C. Verrart, Flumazenil metabolite measurement in production of neurotransmitter receptors in diverse regions of the plasma is not necessary for accurate brain benzodiazepine receptor primate cerebral cortex, Proc. Natl. Acad. Sci. USA 88 (1991) quantification, Eur. J. Nucl. Med. (in press).
10218–10221. [53] W. Sieghart, Structure and pharmacology of g-aminobutyric acidA
[37] M.S. Lidow, P. Rakic, Scheduling of monoaminergic neurotrans- receptor subtype, Pharmacol. Rev. 47 (1995) 181–234.
mitter receptor expression in the primate neocortex during postnatal [54] R.S. Snider, A. Stowell, Receiving areas of the tactile, auditory, and development, Cereb. Cortex 2 (1992) 401–416. visual systems in the cerebellum, J. Neurophysiol. 7 (1944) 331– [38] R.R. Llinas, K.D. Walton, Cerebellum, in: G.M. Shepherd (Ed.), The 357.
Synaptic Organization of the Brain, Oxford University Press, New [55] N. Sobel, V. Prabhakaran, C.A. Hartley, J.E. Desmond, Z. Zhao, G. York, 1998, Chapter 7. Glover, J.D.E. Gabrieli, E.V. Sullivan, Odorant induced and sniff [39] E. Lugaresi, P.R. Montagna, P. Tinuper, G. Plazzi, R. Gallasi, induced activation in the cerebellum of the human, J. Neursoci. 18
T.-L.C. Wang, S.P. Markey, J.D. Rothstein, Endozepine stupor. (1998) 8990–9001.
Recurring stupor linked to endozepine-4 accumulation, Brain 121 [56] J. Talairach, P. Tournoux, Co-planar Stereotaxic Atlas of the Human
(1998) 127–133. Brain, Thieme, New York, 1988.
[40] J.S. Lund, S.M. Holbach, W.W. Chung, Postnatal development of [57] F. Uhl, P. Franzen, I. Podreka, M. Steiner, L. Deecke, Increased thalamic recipient neurons in the monkey striate cortex: II. Influence regional cerebral blood flow in inferior occipital cortex and cere-of afferent driving on spine acquisition and dendritic growth cere-of layer bellum of early blind humans, Neurosci. Lett. 150 (1993) 162–164. 4C spiny stellate neurons, J. Comp. Neurol. 1 (1991) 129–140. [58] C. Veraart, A.G. De Volder, M.C. Wanet-Defalque, A. Bol, A.M. [41] S.L. Mates, J.S. Lund, Developmental changes in the relationship Goffinet, Glucose utilization in human visual cortex is abnormally between type 2 synapses and spiny neurons in the monkey visual elevated in blindness of early onset but decreased in blindness of cortex, J. Comp. Neurol. 1 (1983) 98–105. late onset, Brain Res. 510 (1990) 115–121.
[42] S.L. Mates, J.S. Lund, Neuronal composition and development in [59] M.C. Wanet-Defalque, C. Veraart, A.G. De Volder, R. Metz, C. lamina 4C of monkey striate cortex, J. Comp. Neurol. 1 (1983) Michel, G. Dooms, A.M. Goffinet, High metabolic activity in the 60–90. visual cortex of early blind human subjects, Brain Res. 446 (1988) [43] S.L. Mates, J.S. Lund, Spine formation and maturation of type 1 369–373.
synapses on spiny stellate neurons in primate visual cortex, J. Comp. [60] C.C. Watson, D. Newport, M.E. Casey, A single scatter simulation Neurol. 1 (1983) 91–97. technique for scatter correction in 3D PET, in: P. Grangeat, J.-L. [44] C. Michel, M. Sibomana, J.M. Bodart, C. Grandin, A. Coppens, A. Amans (Eds.), Three Dimensional Image Reconstruction in Radiolo-Bol, A. De Volder, V. Warscotte, J.P. Thiran, B. Macq, Interactive gy and Nuclear Medicine, Kluwer, Dordrecht, 1996, pp. 269–276. delineation of brain sulci and their merging into functional PET [61] K. Wienhard, M. Dahlbom, L. Eriksson, C. Michel, T. Bruckbauer, images, Proc. IEEE Med. Imag. Conf. 3 (1995) 1480–1484. U. Pietrzyk, H.-D. Heiss, The ECAT EXACT HR: performance of a [45] F.A. Middleton, P.L. Strick, The cerebellum: an overview, Trends new high resolution positron scanner, J. Comput. Assist. Tomogr. 18
Neurosci. 9 (1998) 367–369. (1994) 110–118.
[46] R.A. Muller, E. Courchesne, G. Allen, The cerebellum: so much [62] R.P. Woods, S.T. Grafton, C.J. Holmes, S.R. Cherry, J.C. Mazziotta, more, Science 282 (1998) 879–880. Automated image registration: I. General methods and intrasubject, [47] Z. Nusser, W. Sieghart, P. Somogyi, Segregation of different GABAA intramodality validation, J. Comput. Assist. Tomog. 22 (1998)
receptors to synaptic and extrasynaptic membranes cerebellar 139–152.
granule cells, J. Neurosci. 18 (1998) 1693–1703. [63] R.P. Woods, S.T. Grafton, J.D. Watson, N.L. Sicotte, J.C. Mazziotta, [48] W.H. Press, S.A. Teukolsky, W.T. Vetterling, B.P. Flannery, Numeri- Automated image registration: II. Intersubject validation of linear cal Recipes in C. The Art of Scientific Computing, Cambridge and nonlinear models, J. Comput. Assist. Tomog. 22 (1998) 153–
![Fig. 1. Compartmental model for [ C]FMZ–BZR interactions. The intravascular compartment represents the concentration of non-metabolized [ C]FMZ1111in plasma, C (*t)](https://thumb-ap.123doks.com/thumbv2/123dok/3136705.1382212/3.612.138.461.584.673/compartmental-interactions-intravascular-compartment-represents-concentration-metabolized-plasma.webp)