THE DIGITAL VON FAHRENHEID PYRAMID
M. Bura a, J. Janowski a, P. Wężyk b, K. Zięba b,
a
Institute of Archaeology, University of Warsaw, Poland – (marta.bura, janusz.janowski)@uw.edu.pl. b
Laboratory of Geomatics, IFRM, Faculty of Forestry, University of Agriculture in Krakow, Poland - [email protected], [email protected]
Commission II
KEY WORDS: Pyramid, Tomb, Fahrenheid, LiDAR, 3D GIS Visibility Analyses
ABSTRACT:
3D Scanners Lab from Digital Humanities Laboratory at the University of Warsaw initiated the scientific project, the purpose of which was to call attention to systematically penetrated and devastated pyramid-shaped tomb from the XVIII/XIX century, of family von Fahrenheid in Rapa in Banie Mazurskie commune (NE Poland). By conducting a series of non-invasive studies, such as 3D inventory using terrestrial laser scanning (TLS), thermal imaging, georadar measurements (around and inside the tomb) and anthropological research of mummified remains as well - the complete dataset was collected. Through the integration of terrestrial (TLS) and airborne laser scanning (ALS) authors managed to analyse the surroundings of Fahrenheid pyriamid and influence of some objects (like trees) on the condition and visibility of the Pyramids in the landscape.
1. INTRODUCTION
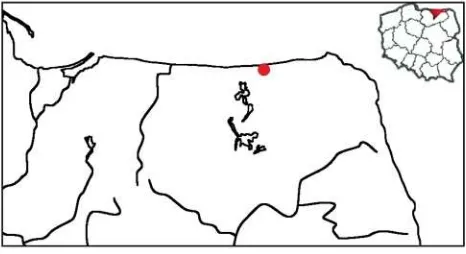
The Pyramid in Rapa (Banie Mazurskie commune, Warmiń sko-Mazurskie province, North-East Poland) (Fig. 1) is a unique object, which is commonly known as the von Fahrenheid family tomb (Krueger 1900; Piątek 2000; Słoma 2002; Łapo 2016a).
Figure 1. Location of the Pyramid in Rapa, Banie Mazurskie commune (NE Poland).
It is situated at the end of a causeway cutting into the Luschnitz swamp approximately 1.0 km south-east from the manor in Rapa which, since 1773, has been in the possession of the von Fahrenheid family (also spelled as Fahrenheit), whose descendant include Daniel Gabriel Fahrenheit known as an inventor of the temperature scale (°F) (Fig. 2). The exterior of this stone and brick structure (Politalska, Politalski 2016) has the form of a slender pyramid built upon a rectangular
foundation. The mausoleum has been robbed numerous times. Vandals worked the greatest damage1 in 1977 when the remains of those entombed within were desecrated. Uncared for, the building became desolate. Clumsy efforts to renovate the structure in the late 90ties of the 20th century caused the deterioration of the original mortar used in its construction. Activities to survey and clean up the Pyramid initiated in September of 2015 were aimed at inventory and analyses of its state as well as refuting the numerous legends circulating about the tomb. These myths included the pyramid's similarities to the Great Pyramid of Giza (Egypt) or crediting its design to the famous Bertel Thorvaldsen. Some also claim that the mausoleum is a place of power (magical). The Pyramid in Rapa is currently situated on the parcel owned by Polish State Forest National Holding. With its great tourism potential it is, however, a relatively small attraction, due to its minimal visibility in the landscape. This has to do with surrounded afforestation and the fast growth of trees in the vicinity of the Pyramid, which contributes to its complete obstruction.
2. HISTORY OF THE PLACE
Most likely the pyramid was built between 1792 and 1795. The initial location of the pyramid-tomb in Rapa can be found on the so-called Schrötter map created between 1796-1802 (Łapo 2016b) (Fig. 2).
1
Figure 2. Rapa – a map sheet of Eastern Prussia (1938) over the aerial orthophoto (2012; GUGiK). The Pyramid was constructed about 1.0 km from the Angerapp (Rapa) Manor-Garden complex (red frame). A line of sight connecting the palace with the pyramid ran through the park situated along the southern part of the Rapa Manor (M. Szostak)
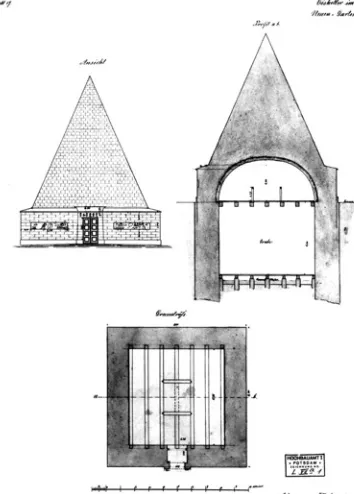
It originally served as an icehouse, that is a place where ice could be stored (Łapo 2016b). More than likely, its archetype was the "ice pyramid" from Potsdam (Fig. 3) built in 1791-1792 as part of the royal New Garden (Neuen Garten).
Figure 3. The ice pyramid in Neuen Garten in Potsdam. Accd. to Gussone 2008.
The building well combined functionality and the aesthetic features of an ornamental nature in an English style garden. It also clearly exemplified the Egyptomania and the Masonic philosophy, which were so popular in those days (Gussone 2008). The King of Prussia, Friedrich Wilhelm II, and Johann Friedrich Wilhelm von Fahrenheid, who at the end of the 18th century was believed to be the richest man in Eastern Prussia, were "good friends" a fact demonstrated, for example, by von
Fahrenheid, the owner of Rapa, being granted titles receiving a knighthood in less than two months after the new ruler took the throne. Both men were also highly situated within the Freemasons.
In 1795 the Pyramid in Rapa was adapted to function as a mausoleum and Fridericke von Farenheid (+1795), the wife of the pyramid's constructor Johann Friedrich Wilhelm, was the first person to be entombed within. All together the vault held the remains of five members of the van Fahrenheid family and later on those of the von Bujack and von Altenstadt families who gained the properties in Rapa and Male Bejnuny as inheritance (Klein Beynuhnen) in 1888 (Więckowski 2016). The bodies of these people, thanks to the extraordinary air ventilation within the building, underwent a natural mummification process.
After 1945 Rapa is located within Poland, only a few kilometres from the border with Russia (Kaliningrad District). The tomb, as well as the remains contained within, has been numerously desecrated by so-called "treasure seekers" who damaged the structure in several places and as a result the building is now in danger of collapsing (Łapo 2016b; Politalska, Politalski 2016). This prompted a number of initiatives aimed at fully documenting its current state and surveying the building together with its interior (Fig. 4).
Figure 4. The Pyramid's interior after precursory clean-up. (Photo by H. Kowalski).
3. NON-INVASIVE STUDIES
Figure 5. Thermo-visual survey (author: D. Dajek).
A bioarchaeological survey demonstrated that the high moisture level had a negative impact on the naturally mummified remains belonging to the members of the von Fahrenheid family buried in the tomb (Więckowski 2016) (Fig. 6).
Figure 6. The state of preservation of the von Fahrenheid family remains (photo by H. Kowalski).
After the initial clean-up of the tomb's interior it was subsequently scanned using a TLS (Terrestrial Laser Scanner) device P30 (Leica) device. In September 2015 a series of high resolution TLS scans (3.1mm to 1.6mm / 10m) were conducted – 3 stations inside and 9 outside, joining them together by the targets (rotated shields) placed in the Pyramid’s windows (Fig. 7). The TLS scanner works in a similar way to a laser rangefinder. The light impulses bounce off the obstacles and return to the device. The moment of sending and returning the coded light impulses is recorded by the scanner, together with the intensity of the returning signal and the horizontal and vertical angle of the mirror spreading the laser impulses. On this basis, the software generates information about the position of the objects (obstacles) in XYZ space, around the centre of projections (the middle of the scanner mirror). As a result, the so-called cloud of XYZ points is generated, with the Intensity and RGB value (digital camera option) attributes. The scanner
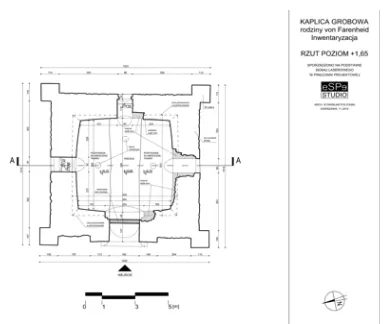
produces approx. 1 Mio. of points per 1 sec. creating a very dense cloud of 3D points which describe the scanned area with very high accuracy. The Cyclone (Leica) software automatically combines individual TLS point clouds acquired at single stations (12 scanner stations) providing a full 3D visualisation of the tomb, its interior, exterior, roof and as well as the surroundings (maximum range up to 270 m). After combining all data, the point cloud representing the Rapa Pyramid comprised about 1.5 billion of 3D dense measurements. Data gathered in this manner allowed for the preparation of a full architectural documentation of the Pyramid in Rapa (Fig. 8).
Figure 7. Location plan of scanner P30 stations (author: J. Janowski).
Figure 8. Plan of the pyrmid based on 3D point cloud gathered by TLS scanner (created by S. Politalski)
The results of 3D inventory allowed us to contradict the erroneous information which has been included in publications concerning the structure, especially those relating to the height of the building and the chamber within the chapel. The profile of the interior also shows that the internal vaulted ceiling is not formed by sloping walls but rather by four vault cells. It is impossible then to say that the angle of inclination of the walls is the same as that of the Great Pyramid of Giza as has been claimed until now. The only part, which has a similar angle of inclination, is the line at the base of the vault cells forming the ceiling (Politalski 2016) (Fig. 9).
Figure 9. Point cloud of the building (created by M. Bura).
During the study conducted in 2015, georadar surveys were also carried, using Mala's georadar (Ramac X3M model with shielded antenna 500Mhz). The echogram images were processed using Ramac Ground Vision 1.4.6 and Easy 3D. There were no anomalies within the building indicating the presence of underground voids. Anomalies of 2m x 1m and 1.2m deep in the form of a secondary buried excavation were found. The aforementioned anomaly is located directly in front of the walled entrance to the building. The long axis of the anomaly runs at right angles to the NW wall of the pyramid. Inside the facility an anomaly was demonstrated at a depth of about 1.4 m over which was found a second anomaly of the nature of the disturbance of the subsurface layers of the soil. A closer look at the character of the aforementioned anomaly will be possible after conducting a larger area investigation, which is related to the clearing of bricks and coffins.
4. INTEGRATION OF TLS POINT CLOUDS AND ALS
Obtaining data from Terrestrial Laser Scanning (TLS) allowed its integration with 3D point clouds registered by the airborne scanner (ALS data) representing the vertical and horizontal structure of buildings, forest stands and ground as well. TLS and ALS point clouds are obtained from the opposite localizations, which results in the case of each of them in certain failures to precisely determine the parameters of the objects, or even completely excludes this. These methods are not contradictory, but complementary. The key to the success of using the advantages of each of LiDAR technologies (TLS or/and ALS) is the data fusion by correct registration often achieved by manual geometric transformation of TLS scanner coordinate system into the ALS coordinate system (Wężyk 2012).
ALS and TLS data can be integrated in CAD/GIS systems, using the position and time pattern (GPS), IMU/INS, detection of the edges of buildings (Hansen et al., 2008) or surveying transformations using the direct measurement of the objects (plains/surfaces) (Perry; Childs, 2009) or scanner stands (Doneus et al., 2010) as well.
The TLS technology is very precise and fast but is limited to relatively small areas like a single building or forest inventory plot. The ALS is more focused on wide-area data collection. Both technologies are complementary, therefore there is a need for the fusion of those two sources of information to enhance the accuracy of a model.
Data obtained using Terrestrial Laser Scanning (TLS) allowed us to integrate it with that gained by Airborne Laser Scanning (ALS) system thanks to which we can look at the Pyramid in Rapa as well as its surroundings from a much broader perspective.
In analyzing the area surrounding the Pyramid in Rapa with consideration to the neighboring landscape and its connection to the Palace in Rapa we conducted a study based on a ALS point cloud (from July 2012; ISOK project; density of 4 pts/ m2)
The matched TLS P30 (Leica) point clouds were exported to ASCII (XYZIRGB) file format and written in the Local Scanner Reference System (LSRS = 0,0,0). In the next step, the imported point cloud TLS was saved as binary format LAS 1.2 (ASPRS) using TerraScan (Terrasolid) software.
The TLS point cloud is the best tool to construct CAD drawings and 3D models which are essential in the creation of documentation necessary during the inventory of a historical monument. However, for a complete GIS spatial analysis of an area surrounding a historical structure, the integration of data obtained during both an aerial (ALS) and a terrestrial laser scanning (TLS) 3D point clouds becomes crucial.
Transformation from LSRS to PL-1992 was done with the help of the TerraScan (Terrasolid) software by applying the algoryth Transformation/Known points.
After merging two data sets, the TLS pointcloud requires the classification ( a specially ground class). The DTM quality is crucial for further analyses e.g. automatic classification of vegetation above the ground or deriving the height of the trees and analysis of visibility. In the study the active TIN method was applied (AXELSSON, 2000; Terrasolid).
In order to perform GIS spatial analyses a digital terrain model (DTM) as well as a digital surface model (DSM) showing the surface of ground and all objects connected (Wężyk et al. 2008; Wężyk 2015).
Visualizations of the approximate 3D surface of terrain are used in numerous applications. Their results taking the form of colorful maps or pictures are used not only in cartography. The main aim of employing terrain relief visualizations in scientific studies is to enable the analysis of visible shapes and their connection with other objects. The simplest method of visualizing continuous areas is to apply a color scheme or gray scale. Hillshading is currently the leading method used to create a sense of visual relief of a given area (Fig. 10; Zięba, Wężyk 2016). Increasingly, the shaded terrain is combined with a palette of colors to create a realistic hybrid.
Figure 10. Digital Terrain Model (DTM) of the area of interest – the Manor and the Pyramid in Rapa (framed) (created by M. Szostak).
ALS point cloud modeling leads to the creation of a digital terrain model (DTM) as well as a digital surface model (DSM) which apart from approximating the lay of the ground also portray other objects within the landscape such as vegetation and buildings (Fig. 11a, b). These models have been generated using the halftone method at 1.0 m GSD which in most cases is sufficient for GIS spatial analyses (ex. GIS 3D visibility analyses; Wężyk 2015).
Analyses of landscape are based on the assumption that in homogeneous environments light travels in straight lines. Digital light models used in visualizations completely disregard the occurrence of interference or diffraction of electromagnetic waves. This does not, however, present any problems in utilizing them to simulate spatial phenomena appearing in landscape representations since interference and diffraction become significant only at distances comparable to the length of a given wave. Computerized visibility analyses use digital light
models to mark visible elements. The light employed in such models is obscured by geometric shapes, the result of algorithms defining visible surfaces (Ozimek 2002).
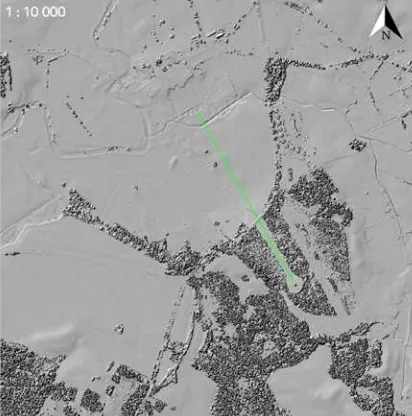
The ArcMap 10.1 (Esri) software was used to carry out the procesisng described above. To generate areas of visibility, the Line Of Sight (3D Analyst) algorithm were used whose aim was to check direct line of sight between points. To assess the influence of vegetation on the visibility between the Palace and the Pyramid the command was applied to both the DTM as well as to a modified DSM. The height of observation points was established at the line of sight of an average person (app. 1.7 m the eye level). When, from a given point, the object is visible then the line between the point and the object is green and turns red if obstructed.
Figure 11a. Line of sight starting at the Palace in Rapa running in the direction of the Pyramid presented on the Digital Surface Model – any portions in red indicated that the line of sight is obstructed (ArcMap, Esri);
Pyramid/path are removed/cut; part in green show clear unobstructed line of sight (ArcMap, Esri) (created by K. Zięba). Thanks to the integration of both ALS and TLS point clouds it is possible to create virtual tours and animations of the object. These materials can then be used to inform about and promote a given region as well as the object itself.
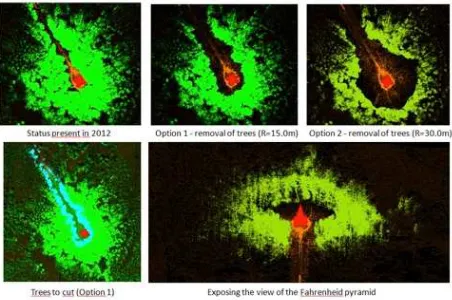
Further stages of such a project may include an analysis of spatial development of the area around the Pyramid, measurement of the trees around it and the level of danger they may pose to the structure as well as whether they obstruct it as seen from the nearby road which may have a bearing on its value as a tourist attraction (Fig. 12).
Figure 12. Options showing all vegetation threatening the safety of the Pyramid removed as well as removing all obstructions to make the building visible (Created by K. Zięba).
5. CONCLUSIONS
The obtained height models, thanks to their ability to create a visualization in 2.5D without the surrounding vegetation, allowed the analysis of the objects being studied within the project. The research shows that the results of the completed analyses are useful to the inventory process in relation to the landscape. Presented visualization forms of terrain relief and surface of objects (trees, buildings) are suggestive and clear even for people without professional training. They can be a valuable complement to any presentation for tourists. ALS point clouds as well as created models can be used as educational and informational materials which will foster understanding of the idea of landscape preservation and may situations where some buildings may have been completely destroyed, but their traces are still recognized in DTM hillshaded model. Aerial Laser Scanning solve the problem of high vegetation and shrubbery on areas of interest. The penetration of laser trough the dense vegetation is quite high
and deliver good results of DTM. . The 3D models allow the generation of virtual image of a given area with vegetation completely or partially removed, enable the analysis of the lay of the ground at any angle through the elimination of vegetation which may obstruct the view which are not attainable using traditional aerial ortophotomaps.
GPR (Mala X3M) surveys around the Pyramid allowed to locate anomalies localized near the entrance, currently bricked up, which could reach as deep as 2.0 m below the current ground level. Initial interpretations point toward this being a heap of rubble or rubble fill. However, the results of surveys from the interior of the chapel are not clear on account of the large amount of loose detritus. In order to confirm the location and possible content of those anomalies the surveys should be repeated after the debris within the tomb has been cleared.
Another effect of the created documentation was the creation of a number of materials that can be used to popularize a structure which is not open to visitors such as animations, 360° panorama images (made through the integration of an Istar camera with the scanner) (Pic. 13) and which have become accessible through VR (Virtual Reality) technology or virtual tours made using the TruView Global software from Leica. On the basis of these materials and through the cooperation with the Museum of Folk Culture in Wegorzewo a new exposition entitled "The Pyramid in Rapa" as well as a popular science publication have been prepared.
Figure 13. Blow up of a 360° panorama showing the interior of the tomb (photo by J. Janowski).
REFERENCES
Doneus M.; Briese C.; Studnicka N., 2010, Analysis of Full-Waveform ALS Data by Simultaneously Acquired TLS Data: Towards an Advanced DTM Generation in Wooded Areas. In: Wagner W., Szekely B., 100 Years ISPRS, Advancing Remote Sensing Science. ISPRS Technical Commission VII Symposium, Vienna, Austria, July 5 – 7, 2010. IAPRS. Vol. XXXVIII, Part 7B, p.193-198.
Gussone M., 2008, Die „Ägyptisierung” der Pyramide im
Neuen Garten zu Potsdam. In: Koldewey-Gesellschaft
Hansen W., Gross H., Thoennessen U., 2008, Line-based registration of terrestrial and airborne LiDAR data. The International Archives of the Photogrammetry, Remote Sensing and Spatial Information Sciences, v. XXXVII. Beijing, Part B3a. p.161-166.
Krueger G., 1900, Beiträge zur Geschichte der Familie Farenheid, Königsberg.
Łapo J., 2016 a, Mówisz Piramida – myślisz: Fahrenheid, In: Piramid w Rapie, editor J. Łapo, Węgorzewo, pp. 6-16. Łapo J., 2016b, Odkrywanie Piramidy, in: Piramida w Rapie, editor J. Łapo, Węgorzewo, pp. 17-23.
Ozimek P., 2002, The use of local light algorithms to create visibility charts. Doctorate dissertation produced at the Faculty of Architecture of the Cracow University of Technology under the direction of Aleksander Böhm, 2002.
Perry J., Childs J., 2009, Timing on the fly. Synchronization for
direct georeferencing on small UAV’s. InsideGNSS.
November/December, p.34-40.
Piątek B. 2000, "Piramida z Luschnitz" czyli egiptomania jako epizod z XIX-wiecznej historii historii wschodniopruskiej rodziny von Fahrenheid, "Światowit", t. II, fasc. A, pp. 166-171.
Politalska S., Politalski S., 2016, Piramida okiem architektów, in: Piramida w Rapie, Węgorzewo, pp. 30-37.
Politalski S., 2016, Inwentaryzacja i wstępna ocena stanu technicznego kaplicy grobowej rodziny Farenheid (tzw.
piramidy w Rapie), eSPe Studia, pp. 1-6 – study report unpublished.
Słoma J., 2002, Mazurska piramida i pruskie Ateny, Gołdap.
Więckowski W., 2016, Antropolog o “mieszkańcach” Piramidy, in: Piramida w Rapie, Węgorzewo, pp. 38-44. Wężyk P., Borowiec N., Szombara S., Wańczyk R., 2008, Generating Digital Terrain Models and Digital Surface Models in the Tatra Mountains on the basis of a point cloud from an aerial laser scanning (ALS). Archive of Photogrametry, Cartography and Remote Sensing. Vol. 18b, pp. 651-661
Wężyk P., 2012, The integration of the Terrestrial and Airborne Laser Scanning technologies in the semi-automated process of retrieving selected trees and forest stand parameters. Ambiencia, Vol. 8. 4: 533-548.
Wężyk P., 2015, Making the invisible visible the DTM modelling in complex environments. In: Geomorphometry for Geosciences. Jasiewicz J., Zwoliński Z., Mitasova H., and Hengl T. (Eds.). Adam Mickiewicz University in Poznań - Institute of Geoecology and Geoinformation, International Society for Geomorphometry. Bogucki Wydawnictwo Naukowe, 57-60, Poznań, Poland: 57-60.
