AN ADAPTIVE POLYGONAL CENTROIDAL VORONOI TESSELLATION
ALGORITHM FOR SEGMENTATION OF NOISY SAR IMAGES
G. Askari a, *, Y. Li b, R. MoezziNasab a
a School of Earth Science, Damghan University, Damghan, IRAN 36716-41167- [email protected], [email protected]
b Institute for Remote Sensing Science and Application, School of Geomatics, Liaoning Technical University,Fuxin, Liaoning 123000, China - [email protected]
KEY WORDS: SAR, Centroidal Voronoi Tessellation, Segmentation, Clustering, Gamma Distribution
ABSTRACT:
In this research, a fast, adaptive and user friendly segmentation methodology is developed for highly speckled SAR images. The developed region based centroidal Voronoi tessellation (R-BCVT) algorithm is a kind of polygon-based clustering approach in which the algorithm attempts to (1) split the image domain into j numbers of centroidal Voronoi polygons (2) assign each polygon a label randomly, then (3) classify the image into k cluster iteratively to satisfy optimum segmentation, and finally a k-mean clustering method refine the detected boundaries of homogeneous regions. The advantages of the novel method arise from adaptively, simplicity and rapidity as well as low sensitivity of the model to speckle noise.
* Ghasem Askari - [email protected] 1. INTRODUCTION
One of the oldest and yet still popular tools employed to analyze and understand images is provided by clustering (Diday and Simon, 1980; Jain, 1989). Broadly speaking, clustering is a commonly used technique for the determination and extraction of desired features from large data sets and for the determination of similarities and dissimilarities between elements in the data set (Hartigan 1975; Jain and Dubes, 1988). In the context of image processing, data sets take the form of one or more images.
CVT is a particular type of Voronoi tessellation that has many applications in computational sciences and engineering, including computer graphics. The basic definition of the CVT can be generalized to very broad settings ranging from abstract spaces to discrete point sets. The concept of CVT has recently received much attention in numerous applications, including computer graphics and image processing (Du et al., 1999; Du et al., 2003; Hausner, 2001; Ju et al., 2002; Kanungo et al., 2002). CVT can be viewed as being a very natural clustering strategy. In the simplest mode, CVT-based clustering coincides with the well-known k-means clustering scheme. Applied to image
segmentation problems, CVT’s also fall within the class of
thresholding segmentation methods. Among such methods, CVT has the distinct feature that as part of the CVT methodology, the threshold values are determined through an optimization procedure (Du et al., 2006). This feature of the CVT methodology accounts for much of its effectiveness in the segmentation and other image processing settings. Furthermore, CVT provides a general mathematical framework that allows for a natural means for developing substantial extensions, improvements, and enhancements of k-means clustering and
other existing clustering and thresholding methods. In this research, the two concepts of centroidal Voronoi polygons and CVT-based clustering approaches are integrated to the resolve the problem of segmentation of speckled SAR images. In image segmentation, the central tasks are to (1) divide an image into centroidal Voronoi polygons, (2) classify the splitted regions into a known number of homogeneous regions based on a novel, multi-scale and adaptive R-BCVT algorithm, (3) refine the boundaries of the provided segmentation using of a k-mean clustering method.
corresponds to the segmentation of the image. In a given set of
polygons having same label, Δ (l)= {Pj; lj = l, j {1, …, m}}, the intensity values of pixels in Δl, Z (l)= {Zi; (xi, yi) Δl},are
conditionally characterized by identical and independent Gamma distributions as follows:
respectively. Then the joint PDF of Zbecomes
The International Archives of the Photogrammetry, Remote Sensing and Spatial Information Sciences, Volume XL-2/W3, 2014 The 1st ISPRS International Conference on Geospatial Information Research, 15–17 November 2014, Tehran, Iran
This contribution has been peer-reviewed.
Voronoi diagrams, centroidal Voronoi Polygons
The concept of Voronoi diagrams plays a central role in our determined entirely by the distribution of the generating point set. A random or quasi-random set of generators may lead to a discretization not suitable for use in finite element analysis. Therefore, we restrict our attention to a special class of Voronoi tessellations that enjoy a higher level of regularity. A Voronoi
An alternative variational characterization of a CVT is used on the deviation of each Voronoi region from its generating seed, measured by the following energy functional:
decreases in consecutive iterations of Lloyd’s algorithm, that is,
(Gi+1; Q) ≤ (Gi ; Q) ( 5)
which means that the Lloyd’s algorithm can be viewed as a
descent method for the energy functional. The above discussed concept is employed to generate the centroidal Voronoi polygons. The Rasterized centroidal Voronoi polygons for different number of generating points, NP = [100, 800, 1500,
2500] is provided in Figure 1
Figure 1. Rasterized centroidal Voronoi polygons for different number of generating points, NP=[100, 800, 1500, 2500].
3. R- BCVT CLUSTERING
Given an image Z from a spatial domain Q R2 , let z= {z
tessellation the number of Voronoi clusters or Voronoi cells Δl
is equal to the number of generating points. In addition, geographical location of generating points in CVT clustering are not used in contrast to Voronoi tessellation.
For a general Voronoi tessellation of Z, we have that w ≠ intensity values that generate the Voronoi clustering are also the means or centroids of the associated clusters.
On the other hand, for any non-overlapping covering of Z=Zk l=1
The International Archives of the Photogrammetry, Remote Sensing and Spatial Information Sciences, Volume XL-2/W3, 2014 The 1st ISPRS International Conference on Geospatial Information Research, 15–17 November 2014, Tehran, Iran
This contribution has been peer-reviewed.
l i i y Z x z
l i i
l
z
x
y
w
E
) , (
|
)
,
(
|
2 (5)4. SEGMENTATION IMPLEMENTATION FOR
R-BCVT CLUSTERING
Given a set of centroidal Voronoi polygons P= {Pj; j = 1,
..., m} and the associated intensity average
__
Z and a digital
image z = {zi ; i = 1, …, n}, choose any l intensity values k
l Z}1 {
__
and determine the associated region based Voronoi clustering{Δl} kl =1.
1- For every
__ Z Z,
a) Evaluate the CVT energy for all possible transfers of
__
Z from its current cluster Δlto any of other clusters ΔlQ, l≠l.
b) If moving
__
Z from its current cluster Δl to the cluster Δl most reduces the CVT energy, then
i. Transfer
__
Z from cluster Δl to cluster Δl;
ii. Replace intensities k l Z}1
{ __
by the
associated means of the newly modified clusters{Δl} kl =1.
2- If no transfers occurred, exit; otherwise go to step 1.
3- Detect the buffer zone of homogenous regions and refine segmentation by use of k-mean clustering method.
5. EXPERIMENTAL RESULTS
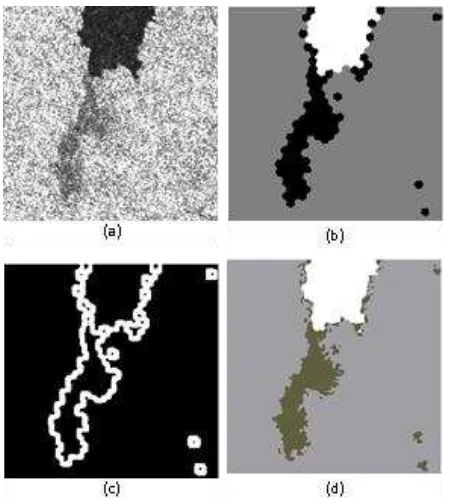
Figure 2 shows RADARSAT ScanSAR images with dimensions of 512×512 pixels. The image shows a RADARSAT-2 image of a coastal scene with spatial resolution of 30 m. Visually, it includes three homogeneous regions. The proposed algorithm is developed using MATLAB (R2007b) on a Lenovo B450 computer. For all calculations, the time needed for image segmentation is approximately 3 seconds for an image with a dimension of 512×512 pixels. Therefore the model can be asses as fast image segmentation approach.
Figure 2. (a) SAR intensity image (b) R-BCVT algorithm outcome. (c) Buffer zone around the outlines of segmented image. (d) Refined segmentation image in buffer zone by use of
k-mean clustering.
Figure 3.The energy graph decay in the condition of NP = [100,
800, 1500, 2500] for SAR intensity image (a) presented in Figure 2.
The International Archives of the Photogrammetry, Remote Sensing and Spatial Information Sciences, Volume XL-2/W3, 2014 The 1st ISPRS International Conference on Geospatial Information Research, 15–17 November 2014, Tehran, Iran
This contribution has been peer-reviewed.
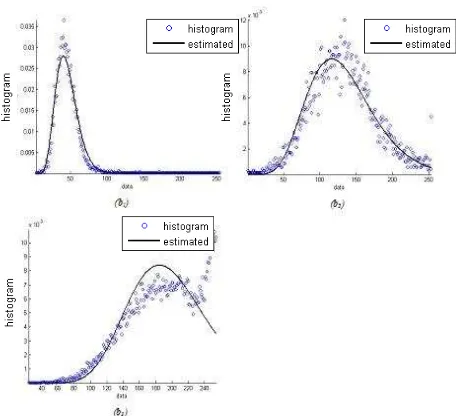
Figure 4. Histogram and Gamma distribution with estimated parameters of segmented regions (b1, b2, b3) with NP =800 for
SAR intensity image shown in Figure 2.
6. CONCLUSION
In this research, a novel, adaptive and fast CVT based segmentation methodology is developed. The model takes advantage of both regional and local information extracting with the aid of R-BCVT and k-mean clustering, respectively. The Adaptivity of the presents algorithms arise from the optional selection of number of classes and centroidal Voronoi polygons as well as calculation of distance function in one (mean) and two (mean-STD) dimension. Furthermore the user is authorized to manually determine the filter window and buffer zone for segmentation process. Certainly, user specification of generating seeds is possible. Similar to many segmentation methodologies, the presented algorithm conveys some limitations, for instance, deficiency of the model in detection of objects in noisy texture images. In such cases integration of the methodology with some other global segmentation models such as fuzzy and MRF models is recommended. The fuzzy models taking advantage of definition a threshold value for proximity of a segment to the associated homogenous regions. For instance the centroidal Voronoi polygons located on the border of two or
more classes can be categorize as less reliable area than other polygons within a cluster.
REFERENCES
Diday, E. and Simon, J., 1980. Clustering analysis. Digital Pattern Recognition, 10, pp. 47-94.
Jain, A., 1989. Fundamentals of Digital Image Processing. Prentice Hall, Berlin.
Hartigan, J., 1975. Clustering Algorithms. Wiley Interscience, New York.
Jain, A. and Dubes, R., 1988. Aglorithms for Clustering Data. Prentice Hall, Englewood Cliffs.
Du, Q., Faber, V. and Gunzburger, M., 1999. Centroidal Voronoi tessellations: Applications and algorithms. SIAM Review, 41(4), pp. 637-676
Du, Q., Gunzburger, M. and Ju, L., 2003. Constrained centroidal Voronoi tessellations on general surfaces. SIAM Journal on Scientific Computing, 24(5) , pp. 1488-1506.
Du, Q., Gunzburger, M, Ju, L. and Wang, X., 2006. Centroidal Voronoi Tessellation Algorithms for Image Compression, Segmentation, and Multichannel Restoration. Journal of Mathematical Imaging and Vision, 24(2) , pp. 177-194.
Hausner, A., 2001. Simulating decorative mosaics. Proceedings of 28th Annual Conference on Computer Graphics and Interactive Techniques, pp. 573-580.
Ju, L., Du, Q. and Gunzburger, M., 2002. Probabilistic methods for centroidal Voronoi tessellations and their parallel implementations. Parallel Computing, 28(10) , pp. 1477-1500.
Kanungo, T., Mount, D., Netanyahu, N., Piatko, C., Silverman,
R. and Wu, A., 2002. An efficient k-means clustering algorithm: Analysis and implementation. IEEE Transaction on Pattern Analysis and Machine Intelligence, 24(7) , pp. 881-892.
Talischi C., Paulino, G. H., Pereira, A., Menezes, I.F. M., 2012. PolyMesher: a general-purpose mesh generator for polygonal elements written in Matlab. Structural and Multidisciplinary Optimization,45(3) , pp. 309-328.
The International Archives of the Photogrammetry, Remote Sensing and Spatial Information Sciences, Volume XL-2/W3, 2014 The 1st ISPRS International Conference on Geospatial Information Research, 15–17 November 2014, Tehran, Iran
This contribution has been peer-reviewed.
![Figure 1. Rasterized centroidal Voronoi polygons for different number of generating points, NP=[100, 800, 1500, 2500]](https://thumb-ap.123doks.com/thumbv2/123dok/3257632.1399414/2.595.306.543.66.329/figure-rasterized-centroidal-voronoi-polygons-different-number-generating.webp)