FINDING THE DISPLACEMENT OF WOOD STRUCTURE IN HERITAGE BUILDING
BY 3D LASER SCANNER
M.C. Lee a,*, Y.L. Tsai b, R.Z. Wang c, M.L. Lin a
a Dept. of Interior Design, National Taichung University of Science and Technology, 40401, Taichung, Taiwan–[email protected] b Bureau of Cultural Heritage, Ministry of Culture, 402, Taichung, Taiwan – [email protected]
c National Centre for Research on Earthquake Engineering, 106, Taipei, Taiwan –[email protected]
Commission VI, WG VI/4
KEY WORDS: Heritage buildings, structural displacement, 3D scanners, wood construction, preservation
ABSTRACT:
Heritage buildings are highly prone to long term damage from the microclimate, scourge and vandalism, which can result in damaged materials, structures, painting and cultural heritage items. This study will focus on finding the displacement of wood structural members through the use of a 3D laser scanner and the 4D concept of time. The results will compare the scans from different periods to find the difference (if any) in the structural member position. Wood structures usually consist of numerous wood members connected to form the structure. However, these members can be damaged in various ways such as physical mechanisms, chemical reactions, and biological corrosion. When damage to the wood structure occurs, the structural displacement can be affected, and if affected severely, can lead to a building collapse. Monitoring of the structural displacement is the best way to discover damage immediately and to preserve the heritage building. However, the Cultural Heritage Preservation Law in Taiwan prohibits the installation of monitoring instruments (e.g strain gauge, accelerometer) in historic structures (heritage buildings). Scanning the wood structure with 3D lasers is the most non-intrusive method and quickly achieves displacement through visualization.
The displacement scan results can be compared with different periods and different members to analyze the severity of damage. Once the 3D scanner is installed, the whole building is scanned, and point clouds created to build the visual building model. The structural displacement can be checked via the building model and the differences are measured between each member to find the high risk damaged areas or members with large displacement. Early detection of structural damage is the most effective way means of preservation.
* Corresponding author
1. INTRODUCTION
1.1 General Instructions
Heritage buildings are highly prone to long term damage from the microclimate, scourge and vandalism, which can result in damaged materials, structures, painting and cultural heritage items. This study will focus on finding the displacement of wood structural members through the use of a 3D laser scanner and the 4D concept of time. The results will compare the scans from different periods to find the difference (if any) in the structural member position.
Wood structures usually consist of numerous wood members connected to form the structure. However, these members can be damaged in various ways such as physical mechanisms, chemical reactions, and biological corrosion. When damage to the wood structure occurs, the structural displacement can be affected, and if affected severely, can lead to a building collapse. Monitoring of the structural displacement is the best way to discover damage immediately and to preserve the heritage building. However, the Cultural Heritage Preservation Law in Taiwan prohibits the installation of monitoring instruments (e.g strain gauge, accelerometer) in historic structures (heritage buildings). 3D laser scanners are the most accurate means for three-dimensional measurements and are used along with topography and photogrammetry [1-6] to remodel heritage objects, such as paintings, sculptures, buildings, and cultural sites, however it is rarely used in structural damage assessments. Heritage buildings of wood construction consists of numerous frame and truss structures, connected to each other by mortise joints. Each member bears
loads, and the loads are transferred to the next member until the it reaches the plinth and the ground. When wood structures are damaged (e.g. insects, plinth subsidence), the wood members lose their bearing capacity, and the shape and/or position may change which eventually leads to a building collapse. Scanning the wood structure with 3D lasers is the most non-intrusive method and quickly achieves displacement through visualization.
The displacement scan results can be compared with different periods and different members to analyze the severity of damage. Once the 3D scanner is installed, the whole building is scanned, and point clouds created to build the visual building model. The structural displacement can be checked via the building model and the differences measured between each member to find the high risk damaged areas or members with large displacement. Early detection of structural damage is the most effective way means of preservation according to UNESCO World Heritage Convention [7].
2. 3D LASER SCANNER OPERATION METHODS
2.1 Features of 3D laser scanners
3D laser scanners use technology that delivers highly detailed 3D images. 3D images of complex environments and geometry can be generated in a few minutes and build point clouds as the 3D documentation. However, 3D laser scanning has limitations; strong sunlight and very dark environments, therefore scanning done on heritage buildings should use high resolution 3D laser scanning. High resolution 3D laser scanning utilizes more
pixels and quicker scan times, resulting in highly detailed 3D data. 3D laser scanner technology was developed for high accuracy (maximum 0.05mm and average 2mm), therefore exact indoor and outdoor measurements can be taken in under 5 minutes for each scan point, as shown in Figure 1.
Figure 1. Common 3D laser scanner for fast and exact indoor and outdoor measurements in three dimensions
2.2 Field scan
2.2.1 Operation planning: Considering the scan accuracy of three dimensional scanning, survey markers should be “Sphere” to avoid axis mapping mistakes and to be the boundary marks for automatically mapping point clouds. At least 4 survey markers (spherical points) are used in a normal field scan and they are also important reference points in the 3D model building process and structure displacement analysis. The survey markers are usually setup in corners and angles are formed at each segment during the planning stage before the field scanning, and the operated method is similar with total station theodolite in closed traverse survey, the only one difference is survey marks in “Sphere”. Laser scanning works by transmitting a laser to an object and measuring the reflected laser to calculate the coordinates via the tilt angle, distance and operation time. Every reflected coordinate and color hue is then recorded as a point cloud. The 3D laser scanner scan angle in horizontal is 360°, in vertical is 300°, and the distance between the scanned object and instrument is around 0.6-120m, as shown in Figure 2.
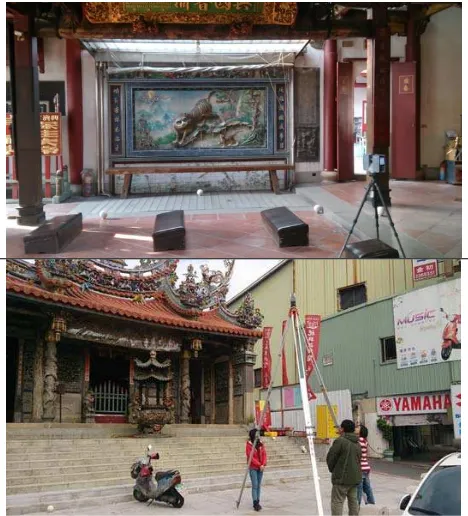
2.2.2 Operation process: The first step in the field scan is setting up the spherical points, as shown in upper Figure 3; the second step is placing the 3D laser scanner at the start point and checking the alignment point and level; the third step is scanning whole object following the planned survey points, as shown in lower Figure 3; after scanning, photos are taken by a digital camera inside the 3D laser scanner at each scan point and the exposure values are checked to ensure photo balance; the fifth step is moving the instrument to the next scan point and repeating the above five steps to finish the closed traverse survey for whole object scanning.
Figure 2. The 3D laser scanner operated for measuring
horizontal and vertical angles [8]
Figure 3. The operation process with survey markers planning [8]
2.3 Data treatment
2.3.1 3D Scanning data check: After field scanning, the scanned results are transferred into point cloud coordinates and the 3D digital model is created with the coordinates. The scanned results are usually checked in the following steps, (1) check the relationship of sighting between instrument and every spherical point, as shown in Figure 4, (2) the accuracy is quickly checked by scan results via computer software, as shown in Figure 5, (3) total mapping errors in whole spherical points should be under ±1 cm, the total accuracy is higher when the mapping errors are small.
Figure 4. check the relationship of sighting between instrument and every spherical point
2.3.2 Automatically mapping and meshing using 3D point clouds: After accuracy check and confirming the total mapping errors under ±1 cm, the point clouds are imported into computer software to automatically mapped and meshed into a 3D digital model. If the accuracy does not meet the requirements, the unrelated point clouds should be deleted and manual mapping should be used to mesh the 3D digital model.
2.3.3 Directing the 3D animator: Software known as “Pointools” is used to direct and make a 3D animation. Organized 2D drawings and 3D aerial photography are used to make the animation via whole point clouds in different viewing angles and navigation route as a visual reality. The animation displays a real site 3D model with real textures (materials), and also displays real cracks and damages that occur in the field site.
Figure 5. the accuracy is checked by computer software
3. SCANNING ON HERITAGE SITE
This study focuses on a famous temple, Da Guan Yin Ting Xing Ji Gong, constructed of wood in 1678 (Ming Dynasty) and restored in the Ching Dynasty (1874), Japanese colonial period (1927), and Republic of China (1949, 1960s, 1970s, 2005). It is famous because of its combination of Buddhist temple (right side) and Taoist temple (left side), and there is an official hall in the centre for visiting officers for dress and leisure. The two temples have the same wood construction and the same plan in three steps, the front hall (entrance), praying pavilion, well, main hall, corridors, and back hall, and also includes many cultural heritages in the heritage building, such as Traditional southern Fujian architecture style, Couplets written by Ching Dynasty Prince Edward Taibao Wang De-Lu, Paintings by famous traditional painting artist Chen Shou-Yi, etc.
Figure 6. The scan points in field site
The first step is drawing the plan and marking the positions of the 3D laser scanner and the spherical points (the referred points) according their accuracy and visibility, especially in corners and turning points, as shown in Figure 6 and Figure 7. The second step is setting the marked spherical points by the planning and settling the 3D laser scanner with alignment points and level. The third step is scanning from the back spherical
point to the front spherical point, and moving one by one to the next scan points, as like closed traverse survey method in Figure 8.
Figure 7. The spherical point and the setup positions in the site
Figure 8. The instrument operation process
During the whole field scanning, the accuracy was checked by scan results via computer software, as shown in Figure 9. The accuracy error analysis steps followed section 2-3-1 in this article, and the total error should be under ±1 cm. The average scan error in each scan point is 1.1mm and the average point cloud error is 1.6 cm in this field scanning result. After confirming the accuracy under the reasonable errors calculation, the unrelated point clouds should be deleted by referring the digital photos to build the 3D model, as shown in Figure 10.
Figure 9. Accuracy calculation by the filed scan results
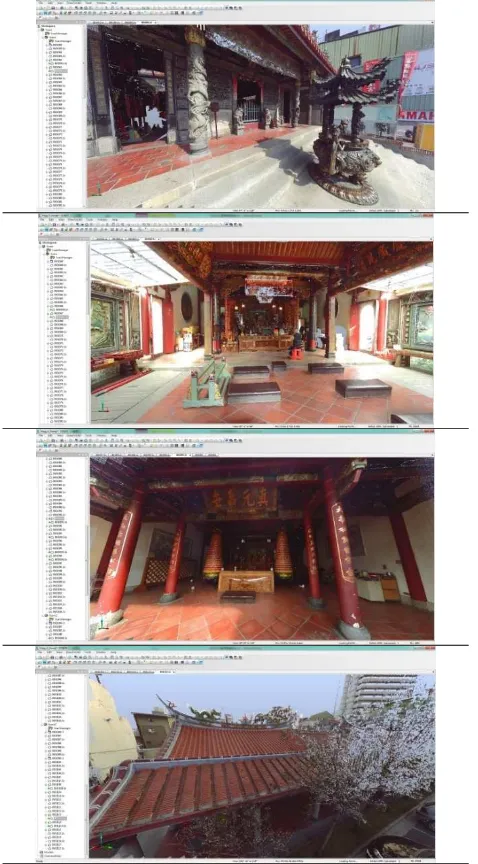
Figure 10. 3D models built by point clouds and digital photos
4. RESULTS AND DISCUSSION
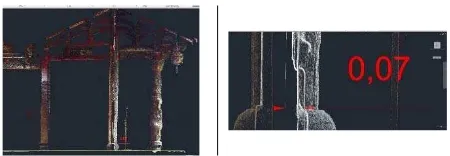
After scanning the whole building, the clouded points were built as the visual building model. The elevations and cross sections of the visual building model can be checked by zooming in and zooming out to find the displaced member of wood structure, as shown in Figure 11. Figure 11 shows the left view of the long axis cross section (called dragon side in traditional Chinese Fon-Shui), there are front hall, praying pavilion, main hall, corridors, and back hall (right to left from the left view of long axis cross section). Checking each wood structure member, the first column and the second column have significant tilt in the front hall of the left view of the long axis cross section, in the right side of Figure 11. The displacement could be marked without the touch of any instrument.
Figure 11. The columns were tilt in front hall of the left view of long axis cross section
To understand the details of the displacement in the front hall, this study checks the connections of roof structures and columns on the roof plan, then makes a horizontal line as the datum line from the spherical points (the referred points). Drawing a horizontal line across the roof structure referred by the datum line, there are some deflections between the left junction and the right junction, and the vertical deflections between the horizontal line are 0.06m (right, tiger side) and 0.11m (left, dragon side) , as shown in Figure 12. Since there was significant displacement on the dragon side junction, the 3D model was used and the view of the area was zoomed in to check the relative position between column and plinth. The result shows the offset between the centre line of column and plinth is 0.15m, as shown in Figure 13 (scanned in 2013). This study asked the scanned 3D model in 2006 in Figure 14, the offset at the same position is 0.07m in 2006. Comparing the same position between the scanned 3D model in 2006 and in 2013, the offset is from 0.07m to 0.15m, the result shows the deflection is still occurring. When deflection occurs in the same direction and with large displacement, and the deformation angle is larger than 1/15rad [9], the structure will tip and collapse, destroying the cultural heritage. The damage risk is higher for structural members than cracked and peeling paint.
Figure 12. A horizontal line cross the roof structure referred by the datum line in the front hall
Figure 13. The dragon side column shows the offset between the centre line of column and plinth in 2013
Figure 14. The dragon side column shows the offset between the centre line of column and plinth in 2006
To preserve this type of heritage building, scanning to measure the change in displacement every 3 months should be done to determine when the displacement stops. If the deflection is still occurring and the deformation angle is approaching 1/15rad, it should be repaired immediately to save the whole heritage building and whole culture heritages on the structure members and in the building.
5. CONCLUSION
Monitoring the displacement of a structure via 3D laser scanning is the optimal way to discover any damage occurrence and to preserve the heritage immediately even followed the Cultural Heritage Preservation Law in Taiwan. Nowadays, 3D laser scanner technology and operation has been developed for higher accuracy and speed. The only two precautions that need to be taken during field scanning are avoiding direct lighting and shadow impacts, and making sure on the same spherical point positions. This study develops a visual methodology to measure the displacement of wood structure members and makes a datum line by the spherical points (the referred points) to compare the deflections of damaged wood member positions between earlier and current period scanned results. If deflection is still occurring and the deformation angle approaches 1/15rad, it should be repaired immediately to save the whole heritage building and whole culture heritages on the structure members and in the building.
ACKNOWLEDGEMENTS (OPTIONAL)
Acknowledgements of support for the project are Bureau of Cultural Heritage, Ministry of Culture, Taiwan, and LeaderTek Co., Ltd., especially in 3D scanning and data analysis.
REFERENCES
[1]F. Blais, Review of 20 years of range sensor development, J. Electron. Imaging 13 (1) (2004) 231-240.
[2]G. Guidi, A. Spinetti, L. Carosso, C. Atzeni, Digital three-dimensional modellingof Donatello’s David by frequency-modulated laser radar, Stud. Conserv. 54 (1)(2009) 3-11.
[3] J.A. Beraldin, Integration of Laser Scanning and Close-Range Photogramme-try – The Last Decade and Beyond, in: Proceedings of the XXth International Society for Photogrammetry and Remote Sensing (ISPRS) Congress, 2004, 972–983.
[4] P. Dias, V. Sequeira, F. Vaz, J.G.M. Goncalves, Registration and fusion of intensity and range data for 3D modelling of real world scenes, 3D Digital Imaging and Modeling 2003 (3DIM 2003), 418–425.
[5] S. Linsinger, 3D Laser versus stereo photogrammetry for documentation and diagnosis of buildings and monuments (pro and contra), in: Proceedings of the CIPA XX International Symposium, Torino (Italy), September 26– October1, 2005
[6] Pedro Martín Lerones, José Llamas, Jaime Gómez-García-Bermejo, Eduardo Zalama, Jesús Castillo Oli, Using 3D digital models for the virtual restoration of polychrome in interesting cultural sites, Journal of Cultural Heritage, 15 (2014) 196-198
[7] Intergovernmental Committee for the Protection of the World Cultural and Natural Heritage, Operational Guidelines for the Implementation of the World Heritage Convention, United Nations Educational, Scientific and Cultural Organisation, World Heritage Centre, 2013. [8] Faro Laser Scanner Focus 3D Operation manual (referred
by FARO Laser Scanner Focus3D X 130 Tech Sheet ), LeaderTek Co., Ltd. Taiwan, 2013
[9] Kaori Fujita,Kazuki Chiba, Eunmi Shin, Seismic Performance of Traditional Japanese Timber Architecture, The Fourth Asian Conference on Mechanics of Functional Materials and Structures (ACMFMS 2014), Nara, Japan, Oct. 10-13, 2014
Revised February 2015
![Figure 3. The operation process with survey markers planning [8]](https://thumb-ap.123doks.com/thumbv2/123dok/3214445.1394400/2.595.325.496.490.606/figure-operation-process-survey-markers-planning.webp)