INTEGRATION OF GEODATA IN DOCUMENTING CASTLE RUINS
P. Delis a *, M. Wojtkowska a, P. Nerc a, I. Ewiak a, A. Lada a
a Department of Remote Sensing and Photogrammetry, Geodesy Institute, Faculty of Civil Engineering and Geodesy, Military University of Technology, Warsaw, Poland - (paulina.delis, michalina.wojtkowska, paulina.nerc, [email protected];
Commission III, WG III/2
KEY WORDS: Laser scanning, Orthoimage, Accuracy, Historical Structures, Data Fusion, Digital Image, Texture
ABSTRACT:
Textured three dimensional models are currently the one of the standard methods of representing the results of photogrammetric
works. A realistic 3D model combines the geometrical relations between the structure’s elements with realistic textures of each of its elements. Data used to create 3D models of structures can be derived from many different sources. The most commonly used tool for documentation purposes, is a digital camera and nowadays terrestrial laser scanning (TLS). Integration of data acquired from different sources allows modelling and visualization of 3D models historical structures. Additional aspect of data integration is possibility of complementing of missing points for example in point clouds. The paper shows the possibility of integrating data from terrestrial laser scanning with digital imagery and an analysis of the accuracy of the presented methods. The paper describes results obtained from raw data consisting of a point cloud measured using terrestrial laser scanning acquired from a Leica ScanStation2 and digital imagery taken using a Kodak DCS Pro 14N camera. The studied structure is the ruins of the Ilza castle in Poland.
* Corresponding author
1. INTRODUCTION
Textured three dimensional models are currently the standard methods of representing the results of photogrammetric works. A realistic 3D model combines the geometrical relations
between the structure’s elements with realistic textures of each
of its elements. The main aim of 3D modelling of architectural and historical structures is the possibility to reconstruct their shape, size and the colour scheme of its surfaces. With the growing demand of 3D city modeling, in recent years an advancement in the research in 3D building generalization can also be observed. (Sester, 2007). Digital Object Model find its application in architectonic and historical structures documentation. It is used in structure inventory during restoring. (Bujakiewicz et al., 2011), (Kedzierski et al., 2010), (Kang et al., 2009). Unfortunately during structure scanning some parts of the object could be hidden or partially covered by other elements such trees, buildings, cars. In that situation, data integration is especially required. (Bujakiewicz et al., 2011), (Kang et al., 2009). In case of integration through data orientation based on direct transformation of sets of points to common coordinate system (usually global system defined by LSL). Coordinates are recalculated using specific function with parameters based on accommodation points. These points are selected among so-called joint points or pseudo-homological points. Then basic problem is to find such points with the most possible accuracy. Depending on available entry data we could distinguish general orientation (technique used to estimate parameters of transformation between two data sets without knowledge of initial accommodation points) and detailed orientation (when initial parameters of transformation are already known). General orientation is considered one of the most popular methods of joining 2D or 3D data sets. Main assumption of such approach is to define identity and characteristic elements of subsets joined.
2. RELATED WORKS
In national and international literature trend could be observed from several years related to joining different types of geodata, which is described for instance in (Haala et al., 1998), (Habib et al., 2004), (Brenner, 2003), (Böhm and Haala, 2005). The most important conclusion from report is confirmation of hypothesis saying about influence both a priori accuracy of image and laser data and type and method of searching accommodation points. Analysis of the accuracy showed that 3D models generated from
video images differ by about 0.06 ÷ 0.13 m compared to TLS
data. (Delis et al., 2013). There is many publication that threat about 3D building modeling that use terrestrial laser scanning and imagery systems. (Kedzierski and Fryskowska, 2015), (Kedzierski and Fryskowska, 2014), (Wilinska et al., 2012), (Sester, 2007), (Haala and Brenner, 1999a) or (Haala and Brenner, 1999b).
3. DATA SETS
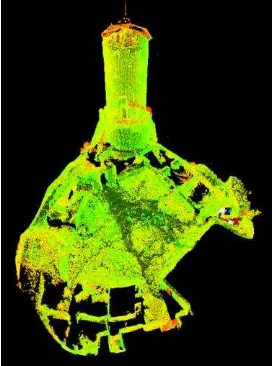
The studied structure is the ruins of the Ilza castle in Poland. The focal point of the structure is a stone cylindrical tower. The remaining walls are about 2 meter high. The ruins have a very irregular shape.
Figure 1. Castle ruins – view form the top of the tower
The actual condition of the structures causes prevention and documenting ruins with the use of remote sensing methods. Below we introduce chosen aspects of remote sensing methods of measurements and 3D modeling of historical structure. Ruins of castle in Ilza is a structure built in 1340 as a bishops’ palace. Nowadays, ruins consist of the higher castle and the lower castle. The remains are: the tower and walls and gateway. Some fragments of walls are pictured in a figure 2.
Figure 2. Walls of castle ruins
4. METHODOLOGY AND DATA PROCESSING
4.1 Assumptions
The paper describes results obtained from raw data consisting of a point cloud measured using terrestrial laser scanning acquired from a Leica ScanStation2 and digital imagery taken using a Kodak DCS Pro 14N camera. The first data fusion method is based on overlaying a texture from the digital imagery over a point cloud derived from the terrestrial laser scanner. The second method is based on conducting a terrain triangulation of a block of digital images, which then enables the generation of a Digital Object Model (DOM) and an ortho image. Texturing methods can be divided in the following way: one-dimensional (an example of which is a coloured point cloud), two-dimensional (covering surfaces on an object with texture planes) and three-dimensional (each point of the object has an assigned texture pixel).
4.2 Data used
4.2.1. Image data: The coordinates of the photogrammetric control network were derived from a point cloud acquired using terrestrial laser scanning. Digital terrestrial images were taken. Digital images had been taken using a Kodak DCS Pro 14N camera with 36 mm × 24 mm CMOS matrix (14 mln pixels) and 24 mm lens.
4.2.2. TLS data point cloud post-processing: source data (point cloud) is required in a seven stations. Point cloud resolution was determined as a 2 cm. Data was filtered, that means, some points representing additional objects: noise, vegetation, cars etc. Ina figure 3 the filtered and registered point clouds in the intensity map.
Figure 3. Result of point cloud registering and filtering
Figure 4 presents the wall of castle ruins. Point cloud is presented as the intensity colour map. Some elements like stones, small basement window and surrounding.
Figure 4. The view of TLS data of part of castle ruins walls
As we can see, single bricks can be identified, but with the texture their interpretation might me more precisely.
4.3 Integration
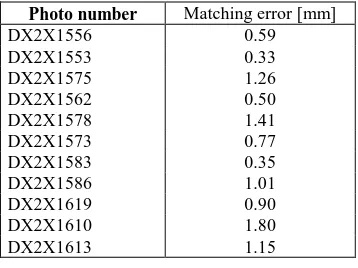
(bitmaps). Texture mapping indicates the way of integration of pixel values with object surface. Texturing help in data interpretation and visualization. In a texture procedure objects is covered with natural or artificial texture. The texture is generated in a different ways: by color value determination; by texturing with the artificial texture, for example: texture library; by texturing with the photos. Texturing approach can be divided into: one-dimensional, two-dimensional and three dimensional. (Wang et al., 2009). Further analysis and data processing has been conducted in a Texture Map Browser module. Photo of the particular wall was inputted. Then, 7 pseudo-homologous points (for the point cloud and for the photo) were pointed. Point had to be equally distributed. Maximum error of image adjustment could not be higher than 2 pixels. In table 1, errors of image matching of different walls are presented.
Photo number Matching error [mm]
DX2X1556 0.59
Table 1. Results of image and point cloud matching
Point cloud texturing with the images raises the realism of actual structure appearance and colors. Point cloud visualization as the intensity map give only information about spectral
response of the objects’ surface. Examples of textured point clouds are presented in a figures 5 and 6. Textures are acquired from camera built-in a laser scanning system.
4.4.1. Terratriangulation: 10 images were selected from all of the acquired digital images. These were joined into stereograms in such a way, that the right image of the first stereogram is the left image of the next stereogram. These images were acquired from one plane parallel to the imaged wall, from neighboring positions, so that the overlap between images is no less than 60%. The stereogram orientation was conducted in Topcon Image Master software. The coordinates of the reference points were determined from point cloud acquired with the terrestrial laser scanning system.
Figure 5. Example of textured point cloud with the reference points
Figure 6. Example of textured point cloud with the reference points – another wall points – another wall points – another wall
Reference control points were used in terratriangulation process. Table 2 presents the results of terratriangulation of 10 chosen stereograms.
The results of image orientation (parallax) were satisfactory. The parallax values did not exceeded 1 pixel.
4.4.2. DOM: The next step was to generate the Digital Object Model. In the first method, the model was created using an imported point cloud, in the second – using oriented stereograms. The generated Digital Object Models were then textured. The results of this process has been shown in figure 7.
Figure 7. Digital Object Model generated from a stereogram
4.4.2. Orthoimages: Next, from these models and digital imagery, ortho images were generated. Ortho images were generated using two methods: using the DOM obtained from a point cloud and using a TIN obtained from stereograms (figure 8).
Figure 8. Orthoimage generated on the basis of DOM from stereogram
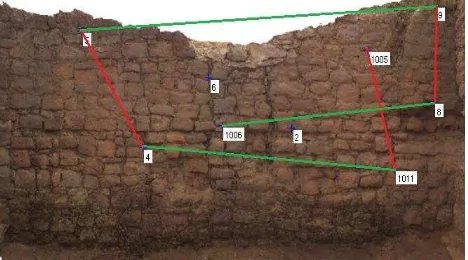
The accuracies of the generated ortho images had been determined based on a comparison between the theoretical distances between control points and check points and those same distanced on the ortho images (figure 9).
Figure 9. Diagram of the location of the measured control distances
The measured coordinates of the control and check points on the ortho-images were compared to theoretical values measured on the point cloud. Distances between check points were computed:
(1)
where: x1, y1 = coordinates of the first point x2, y2 = coordinates of the last point
The mean errors were determined on the basis of equation accuracy values it can be seen, that the ortho images generated
5. CONCLUSIONS
Using a point cloud to generate ortho-images eliminates the need to perform any additional field work like measuring control points using traditional surveying methods, thereby shortening the length of time needed to perform such work. Using data from different photogrammetric sources is useful especially when there is a need to obtain detailed and precise three dimensional models, e.g. for analyses of shape, geometrical relations or when studying the location of an object in three dimensional space. Purpose of this contribution was to discuss aspects of image and point cloud data integration, a crucial photogrammetric problem. In the context of a growing demand for laser scanning and imagery products in architecture and archaeology, some research in data integration have been presented here.
ACKNOWLEDGEMENTS
This work was supported by grand co-financed with Faculty of Civil Engineering and Geodesy Military university of Technology (Geodesy Institute).
REFERENCES
Böhm, J., Norbert H., Alshawabkeh Y. 2005. Automation in laser scanning for cultural heritage applications. in Recording, modeling and visualization of cultural heritage: pp. 443-450.
Brenner, C., 2003. Building reconstruction from laser scanning and images. in Proc. ITC Workshop on Data Quality in Earth Observation Techniques.
Bujakiewicz, A., Podlasiak, P., Zawieska, D., 2011. Georeferencing of close range photogrammetric data, Warsaw University of Technology.
Delis P., Fryskowska A., Kedzierski M., Wilinska M., 2013. 3D modeling of architectural objects from video data obtained with the fixed focal length lens geometry. Geodesy and Cartography Vol. 62, No 2, pp. 123-138 DOI: 10.2478/geocart-2013-0007
Haala, N., Brenner C., Anders K., 1998. 3D urban GIS from laser altimeter and 2D map data. in International Archives of Photogrammetry and Remote Sensing 32 (1998): 339-346.
Haala, N., Brenner, C., 1999a. Virtual city models from Laser altimeter and 2D map data. In Photogrammetric Engineering & Remote Sensing 65 (7), 787-795.
Haala, N., Brenner, C., 1999b. Extraction of building and trees in urban environments, in ISPRS Journal of. 54 (1999) 130-137 Habib, A. F., Ghanma, M. S., Al-Ruzouq, R. I., & Kim, E. M. 2004. 3D modelling of historical sites using lowcost digital cameras. in ISPRS Journal.
Kang, Z., Li, J., Zhang, L., Zhao, Q., Zlatanova, S., 2009. Automatic registration of terrestrial laser scanning point clouds using panoramic reflectance images. Sensors 9.4 (2009): 2621-2646.
Kedzierski, M., Walczykowski, P., Fryskowska, A., 2010. Aspekty pozyskiwania danych z Naziemnego Skaningu Laserowego (Aspects of Terrestrial Laser Scanning data acquisition), in Biuletyn WAT.
Kedzierski, M., Fryskowska, A., 2014, Terrestrial and Aerial Laser Scanning Data Integration Using Wavelet Analysis for the Purpose of 3D Building Modeling, SENSORS Volume: 14 Issue: 7 Pages: 12070-12092, Published: JUL 2014
Kedzierski, M., Fryskowska, A., 2015. Methods of laser scanning point clouds integration in precise 3D building modelling MEASUREMENT Volume: 74 Pages: 221-232 Published: OCT 2015
Sester M., 2007. 3D visualization and generalization, at Photogrammetrische Woche 2007, pp.285-295
Wang, A., Qiu T., Shao L., 2009. A Simple Method of Radial Distortion Correction with Centre of Distortion Estimation, in Journal of Mathematical Imaging and Vision 35: 165–172 DOI 10.1007/s10851-009-0162-1.
Wilinska, M., Kedzierski, M., Zaplata, R., 2012, Noninvasive Methods Of Determining Historical Objects Deformation Using TLS, Conference: 8th International Conference on Structural Analysis of Historical Constructions, SAHC 2012 Location: Centennial Hall, Wroclaw, POLAND Date: OCT 15-17, 2012 Sponsor(s): MAPEI, Profesjonalna Chemia Budowlana; KEIM; PLAZA CTR; quick mix; TITAN POLSKA; ULMA; Ruredil Structural Analysis Of Historical Constructions, VOLS 1-3 Pages: 2582-2588 Published: 2012
Revised June 2015