Ž .
Atmospheric Research 55 2000 257–270
www.elsevier.comrlocateratmos
Analysis of dew precipitation in three habitats
within a small arid drainage basin,
Negev Highlands, Israel
Giora J. Kidron
)Institute of Earth Sciences, The Hebrew UniÕersity of Jerusalem, GiÕat Ram Campus, Jerusalem 91904, Israel
Received 12 October 1999; received in revised form 5 July 2000; accepted 8 August 2000
Abstract
Water availability is the most important limiting factor in arid lands. Any additional source of water, such as dew and fog, may have a positive impact upon the ecosystem. Dew and fog precipitation are largely dictated by weather conditions and habitat.
Dew and fog measurements were carried out for 29 days in the fall of 1987–1989 at three distinctive habitats within a single drainage basin in the Negev Highlands, Israel. The habitats were a sun- and wind-exposed habitat, at two hilltops, a sun-shaded habitat, at the north- and west-facing footslopes, and a wind-protected habitat, at two wadi beds. Morning weather
Ž .
conditions cloudiness, wind speed were also monitored. An analysis of the dew and fog quantities and duration was performed.
Clear mornings and a single foggy morning recorded were characterized by high dew and fog amounts and duration, whereas lower values were recorded during cloudy and especially windy mornings. The hilltop stations and especially the sun-shaded footslope stations obtained signifi-cantly higher values of dew and fog for a signifisignifi-cantly longer duration than the wadi bed stations. Whereas the results did not support the hypothesis that advective condensation is responsible for the high dew amounts at the sun-shaded habitat, the data showed a continuous dew condensation even after sunrise. This continuous condensation, averaging up to 1.1 h following sunrise, was especially pronounced at the sun-shaded habitat and may explain the higher dew values and longer time duration obtained at this habitat. Since maximal dew values may not necessarily be obtained at sunrise and may change according to habitat, dew collection time should be carefully considered.q2000 Elsevier Science B.V. All rights reserved.
Keywords: Dew; Fog; Drainage basin; Negev Desert
)Tel.:q972-2-676-7271; fax:q972-2-566-2581.
Ž .
E-mail address: [email protected] G.J. Kidron .
0169-8095r00r$ - see front matterq2000 Elsevier Science B.V. All rights reserved.
Ž .
( )
G.J. KidronrAtmospheric Research 55 2000 257–270
258
1. Introduction
Water availability is the most important limiting factor in arid lands. Any additional source of water may have a positive impact upon the ecosystem. Although supplying relatively low amounts, dew and fog precipitation are constant and stable water sources, and thus may be of great importance in arid and semi-arid zones.
An average of 195 dewy days with 33 mm of dew were recorded over 17 years of Ž
measurements in Avdat, at the heart of the Negev Desert Highlands, Israel Evenari, .
1981 . Dew and fog were found to play a major role in the water budget of
microorgan-Ž .
isms and insects Friedmann and Galun, 1974; Broza, 1979 , providing the main source
Ž .
of water for lichens Lange et al., 1970 . Consequently, dew and fog precipitation also enabled snail grazing on rock-dwelling lichens, thus playing a major role in rock
Ž
weathering and in the primary food chain Shachak and Steinberger, 1980; Shachak et .
al., 1987 .
Although important, information regarding dew and fog precipitation is scarce. Ž Measurements in the Negev Highlands were usually confined to a single station Evenari
.
et al., 1971; Zangvil, 1996 . Limited amounts of dew measurements were however,
Ž .
carried out at three exposures north, west and east and a valley by Kappen et al. Ž1980 , who found higher amounts of dew at the north- and west-facing slopes in. comparison to the valley and the east exposure, which obtained equal amounts. Kappen
Ž .
et al. 1980 attributed these differences to advective condensation, i.e., preferential condensation at the northwesterly windward aspects in comparison to the flat valley and the eastern exposure. Recently, dew and fog variability patterns within 18 stations
Ž .
located at four exposures north, south, east, west of a second-order drainage basin were
Ž .
carried out Kidron et al., 2000 . Dew condensation was shown to take place also after dawn, and was explained by the slight turbulence triggered by the early sunbeams ŽKidron, 1998; Kidron et al., 2000 . Dew and fog amounts and duration at the different. stations exhibited high variability, with differences of up to 460% in dew amounts and
Ž .
up to 260% in dew duration Kidron et al., 2000 .
Whereas stations of high rock to soil ratio exhibited low dew and fog amounts, which
Ž .
were explained by the efficient heat retention of the rocks Kidron et al., 2000 , high
Ž .
variability characterized also stations located on soil strips Kidron et al., 2000 . Out of the stations located on soil strips, hilltop and sun-shaded footslope stations exhibited the highest dew and fog amounts, with sun-shaded footslope stations also exhibiting the longer duration. Wadi bed stations exhibited very low amounts and short duration ŽKidron et al., 2000 ..
Hilltop, sun-shaded footslope, and wadi stations represent three distinctive habitats as far as the exposure to wind and sun is concerned. Whereas hilltop stations are exposed to the early sunbeams and to winds, the north- and west-facing footslopes may primarily represent a shaded habitat, i.e., shaded from the early sunbeams, while the wadi bed stations may mainly represent a wind-sheltered habitat. Dew and fog condensation and duration at these habitats may also be affected by morning weather conditions such as cloudiness or wind.
( )
G.J. KidronrAtmospheric Research 55 2000 257–270 259
these habitats during differential morning conditions, and to examine the hypothesis that nocturnal dew condensation may follow advective patterns.
2. The research site and methodology
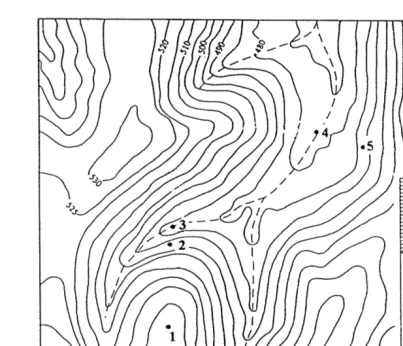
A second-order drainage basin, located near Sede Boqer in the Negev Highlands, was Ž .
chosen for dew and fog measurements Fig. 1 . The drainage basin is comprised of jointed limestones with strip of soils and of massive rock outcrops that characterize the
Ž . Ž .
midslopes Fig. 2a . The slopes are steep 15–308, with peaks at 45–55 m above the
Ž .
wadi beds. Average annual precipitation is 92 mm Yair et al., 1991 . Dew is frequent,
Ž .
being most abundant during the fall Evenari et al., 1971; Zangvil, 1996 .
Stations at the two hilltops, at the footslopes of the northern and western exposures, and at two locations along the wadi bed were chosen for dew and fog measurements and
Ž .
analysis Fig. 1 . Station characteristics are summarized in Table 1.
Dew and fog measurements were carried out during the fall of 1987–1989 using the
Ž .
cloth plate method as described elsewhere Kidron, 1988, 1998 . The method consists of
Ž .
square cloths 6=6=0.15 cm attached to the center of 10=10=0.2-cm glass plates, which are glued to 10=10=0.5-cm plywood, thus, creating a homogenous substratum at 0.7 cm above ground. Between 6 and 12 cloths were attached each afternoon to 6–12
Ž .
plates, placed horizontally, adjacent to each other, in each of the stations Fig. 2b . The cloths were collected during the course of the following morning into separate flasks, which were immediately sealed and then weighed for their moisture content. Thus, each value represented the total amount accumulated until the time of collection.
The time during which dew was collected at the stations comprising the same habitat was short, usually within several minutes, facilitating a comparison of the two sets of data via a paired t-test. A value of 0.03 mm, which also marks the threshold for dew
Ž .
availability for microorganisms Kappen et al., 1979 , was taken as a threshold for dew. Twenty-nine mornings of dew and fog measurements were carried out and analyzed for their weather conditions including cloud cover, wind velocity, and fog condensation. Visual estimation of cloud cover and fogs were carried out, whereas wind velocity was
Ž .
analyzed based on a Woelfle anemograph Lambrecht, Germany located at 3.5 m above ground at a hilltop, 100 m from the drainage basin.
Mornings with -50% cloud cover were defined as clear mornings, whereas morn-ings with G50% cloud cover were defined as cloudy. Mornings with wind velocity exceeding an average of 4 m sy1 for the first 3 h after sunrise were defined as windy. Mornings, during which a visible fog was noted, restricting visibility to less than 1000 m for at least half an hour, were defined as foggy mornings.
3. Results
3.1. General weather conditions
()
G.J.
Kidron
r
Atmospheric
Research
55
2000
257
–
270
260
( )
G.J. KidronrAtmospheric Research 55 2000 257–270 261
Table 1
Description of catchment stations
Station Slope Abbreviated station Elevation above Slope Rock
Ž . Ž . Ž .
no. location name and exposure m.s.l. m angle 8 cover %
1 Hilltop Top N 528 2 30
2 Footslope Bot N 496 19 25
3 Wadi Wadi NrS 486 2 10
4 Wadi Wadi ErW 478 1 5
5 Footslope Bot W 488 13 20
6 Hilltop Top W 518 3 35
Ž . Ž .
days 59% of the recorded mornings, eight mornings 28% were cloudy, and three
Ž . Ž .
mornings 10% were windy. One foggy morning was also observed 3r9r1988 , during which fog penetrated the area from the northwest at 7:15 AM, covering the area until 7:45 AM, until it moved further to the southeast, leaving the research site.
An average cloud cover of 75% and an average wind velocity of 5.4 m sy1 characterized the cloudy and windy mornings, respectively. A distinction between windy cloudy and windy clear mornings was not made, due to the overwhelming effect of the wind during both weather conditions, resulting in similar dew patterns.
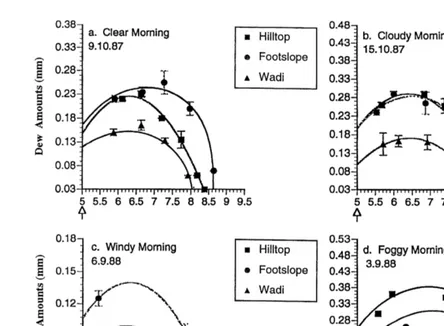
Different patterns of dew accumulation and evaporation graphs characterized the various weather conditions. Dew accumulation and evaporation graphs, which character-ized the clear, cloudy, and windy mornings as well as the single foggy morning recorded, are shown in Fig. 3. Only partial measurements were performed during the foggy morning, confined to the northern and southern exposures only.
Dew patterns during the remaining days in each weather category were highly similar to the graphs presented herein. These graphs may thus be seen as good representations of each of the weather conditions described. That is also the case with the fog event recorded, as subsequent measurements of foggy mornings during 1992 also showed
Ž .
similar trends to the patterns presented herein Kidron, unpublished data .
Dew amounts and duration in each of the two stations within each pair did not differ significantly from one another, and therefore, it was possible to group both stations of the same habitat. In this case, a standard error was calculated for the values received in
Ž .
each station of the same habitat Fig. 3 . Fog precipitation and average dew precipitation as measured at dawn, maximal precipitation, the length of time during which accumula-tion following dawn continued, and total daylight duraaccumula-tion time during clear, cloudy windy, and foggy mornings are shown in Fig. 4, whereas the average measured values during the research period are shown in Fig. 5. Although not all weather conditions were equally represented, and hence, did not facilitate statistical analysis, a few patterns of dew and fog accumulation and evaporation could have been observed.
Ž .a Clear mornings yielded the highest dew amounts and the longer dew duration, whereas windy mornings yielded the lower dew amounts and the shorter duration. Cloudy mornings exhibited intermediate values. Fog precipitation substantially increased
Ž .
( )
G.J. KidronrAtmospheric Research 55 2000 257–270
262
Ž . Ž .
Fig. 2. View of the drainage basin 1 h after sunrise a and a typical dew station b . Note the shaded northern
Ž .
()
G.J.
Kidron
r
Atmospheric
Research
55
2000
257
–
270
263
Ž . Ž . Ž . Ž .
Fig. 3. Dew accumulation and evaporation patterns during a typical clear a , cloudy b , windy c , and foggy d morning as measured at stations of the same habitat
()
G.J.
Kidron
r
Atmospheric
Research
55
2000
257
–
270
264
Ž . Ž . Ž . Ž .
( )
G.J. KidronrAtmospheric Research 55 2000 257–270 265
Ž . Ž .
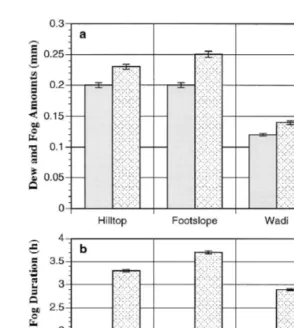
Fig. 5. Average values of a dew and fog amounts at dawn and maximum dew and fog amounts, and b time lapse between dawn to maximum dew and fog precipitation, and total daylight dew and fog duration at the three habitats during all days of measurements. Bars represent one SE.
Ž .b Stations that exhibited high dew amounts also exhibited longer dew duration. The results indicate a positive link between dew amount and duration, in agreement with
Ž .
other observations Duvdevani, 1964; Kidron et al., 2000 .
3.2. Dew and fog amounts at dawn and maximum dew and fog
During clear and cloudy mornings, dawn dew and fog quantities were the highest at the hilltop, whereas during windy mornings, dawn dew quantities were the highest at the
Ž .
footslope stations Fig. 4 . Clear days resulted in the highest average maximal amounts with the footslope stations obtaining the highest mean value of 0.28 mm followed by the
Ž . Ž .
hilltop stations 0.27 mm and the wadi stations 0.14 mm . Windy mornings exhibited
Ž .
the lowest maximal amounts of dew 0.10–0.14 mm , whereas cloudy days exhibited Ž .
( )
G.J. KidronrAtmospheric Research 55 2000 257–270
266
Analysis of all days of measurements indicates that whereas top and shaded footslope Ž .
stations obtained an equal average amount at dawn of 0.20 mm Fig. 5 , higher maximal
Ž .
dew and fog values although not significantly different; ps0.058 characterize the sun-shaded footslope stations with a daily average of 0.25 mm as compared to 0.23 mm
Ž .
at the hilltop stations. Significantly lower dew and fog values paired t-test; p-0.001
Ž .
were obtained at dawn at the wadi stations 0.12 mm . The wadi stations received also the lowest values during maximum condensation, with a mean value of 0.14 mm, which
Ž
was significantly lower than the values obtained at both other habitats paired t-test; .
p-0.001 . The only deviation occurred during windy mornings with the wadi bed stations obtaining similar dew quantities to the other habitats, apparently reflecting the
Ž . relatively wind-sheltered location of the wadis Fig. 4 .
The data point out that although maximum dew condensation was assumed to occur Ž
during dawn or sunrise Duvdevani, 1947; Lloyd, 1961; Kappen et al., 1979; Wales-.
Smith, 1983 , dew condensation continued during most of the mornings following sunrise. Daylight accumulation, being up to 41.5% of the total precipitation during certain dewy mornings and up to 68.4% during the foggy morning, accounted on an
Ž . average for 10.6–15.9% of the total precipitation Fig. 6 .
3.3. Daylight duration and rate of dew and fog condensation
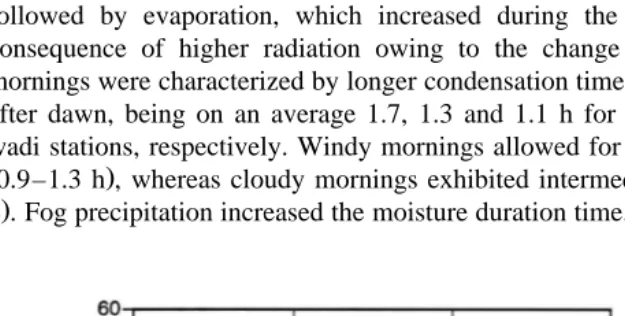
All stations exhibited a continuous condensation during the very early morning hours followed by evaporation, which increased during the course of the morning as a
Ž . consequence of higher radiation owing to the change in sun angle Fig. 3 . Clear mornings were characterized by longer condensation time during the morning hours, i.e., after dawn, being on an average 1.7, 1.3 and 1.1 h for footslope stations, hilltop, and wadi stations, respectively. Windy mornings allowed for the shortest condensation time Ž0.9–1.3 h , whereas cloudy mornings exhibited intermediate values of 1.0–1.5 h Fig.. Ž
.
4 . Fog precipitation increased the moisture duration time. Upon the migration of the fog
Ž
Fig. 6. Average daylight increase in dew and fog amounts and daylight condensation time out of total in
.
( )
G.J. KidronrAtmospheric Research 55 2000 257–270 267
out of the area, high evaporation took place, as a result of the sudden exposure of the plates to the sun. The high evaporation is clearly depicted by the steep limb of the
Ž . evaporation graph Fig. 3 .
Ž .
Average daytime condensation following dawn based on all days of measurements was 1.6 h at the sun-shaded footslope stations, and 1.2 and 1.1 h at the hilltop and wadi
Ž .
stations, respectively Fig. 5 . Since sunrise in the Negev Desert during this time of the year will occur half an hour after dawn, dew condensation continued on an average for up to 1.1 h after sunrise, with up to 1.5 h during certain mornings. Whereas dew accumulation time from dawn until maximum condensation was similar at the hilltop and wadi stations, it was significantly shorter at the wadi stations in comparison to the
Ž footslope stations, and at the hilltop in comparison to the footslope stations paired
.
t-test, p-0.05; Fig. 5 . Dew accumulation continued for as long as 35–43% of the total Ž .
daylight duration Fig. 6 , being up to 57% and 56% during the foggy and the dewy mornings, respectively.
Average dew and fog condensation rates of 0.021, 0.023 and 0.028 mm hy1
were calculated during the early morning hours for the wadi stations, for the hilltop stations, and for the north- and west-facing footslope stations, respectively. Excluding the foggy morning, dew condensation rates were 0.020, 0.021, and 0.028 mm hy1 for the wadi, hilltop, and footslope stations, respectively. These condensation rates were less than the
y1 Ž .
maximal theoretical value of 0.035 mm h calculated by Monteith 1957 based on energy considerations, i.e., the net outgoing radiational cooling. The maximal theoretical values can be calculated owing to the self-similarity and universality of the physical
Ž .
processes responsible for dew condensation Beysens, 1995 . However, the values Ž
measured during the current research were higher than the average rates including all
. Ž .
hours of condensation found by Zangvil 1996 with a Hiltner dew balance at Sede Boqer of 0.012–0.016 mm hy1. Although different rates of condensation are expected
once different dew devices with different deposition surfaces are employed, the data may also indicate that relatively high condensation rates may take place immediately following dawn.
3.4. Total dew and fog duration
Highly significant differences in total dew and fog duration characterized all habitats Žpaired t-test, p-0.001; Fig. 5 . The sun-shaded footslope stations exhibited the longer.
Ž . Ž .
dew duration with an average of 3.7 h , followed by the hilltop stations 3.3 h and Ž .
wadi bed stations 2.9 h , with maximal daily duration of 5.6, 5.0, and 4.0 h for the footslope, hilltop, and wadi, respectively. Clear days facilitated the longer hours of
Ž . Ž . Ž . Ž
activity 3.0–4.1 h , followed by cloudy 2.8–3.3 h and windy 2.6–2.9 h days Fig. .
4 .
4. Discussion
High differences in dew and fog amounts and duration characterized the three habitats within the catchment. The lower near surface dew amounts at the wadi beds
Ž . Ž .
( )
G.J. KidronrAtmospheric Research 55 2000 257–270
268
Ž .
downslope winds katabatic and consequently, lower temperatures. The low amounts of dew and fog condensed at the wadi beds may be explained by their wind-sheltered location, impeding wind ventilation during the afternoon breeze and by slower long
Ž .
wave radiational cooling at the narrow wadi Kidron et al., 2000 . The less efficient long wave radiational cooling at the narrow wadi stems from the lower proportion of sky seen
Ž by objects located at the wadi bed, a concept known as the Sky View Factor Oke,
. 1978 .
And thus, whereas wadi beds may have an ecological advantage as far as runoff is
Ž .
concerned Yair and Lavee, 1985 , narrow wadi beds, which characterize most of the Negev Highlands, may experience low near surface dew and fog condensation during the fall dewy period. Nevertheless, it should be noted that while the maximal amounts of dew and fog at the wadi beds were approximately 40% lower than at the top and shaded footslope stations, dew and fog duration time was only 12–22% shorter, apparently due to the relatively sun-sheltered location of this habitat. And thus, whereas maximal values may be significantly lower than at the other habitats, the difference in dew and fog duration time is less pronounced.
One should, however, note that the results obtained during the present research are confined to the near surface air film of narrow wadi beds, which may experience relatively low radiational cooling. Substantially higher dew and fog amounts were received at the wadi bed at 20 cm above ground, as a result of better nocturnal
Ž .
radiational cooling Kidron et al., 2000 . Similarly, it is assumed that wide wadi beds of
)50–100 m, which are fully exposed to the cooling effect of the afternoon winds, will also experience an efficient outgoing long wave radiational cooling, which may result in
Ž .
high dew amounts Danin and Garty, 1983 .
Contrary to the low values and the short duration time of dew and fog at the wadi beds, hilltop and especially the sun-sheltered footslopes received significantly higher dew and fog amounts for longer duration. Average maximal values received at the footslopes were higher than those at the hilltop despite the equal dew and fog amounts measured at both habitats at dawn. A continuous condensation, which is explained by a
Ž .
slight turbulence caused by the early sunbeams Kidron et al., 2000 , may explain the overall higher maximal values obtained at the north- and west-facing footslope stations, i.e., the sun-sheltered stations. Since dew duration time is positively and linearly
Ž .
correlated with dew amounts Kidron et al., 2000 , the longer dew duration at the sun-shaded habitat can thus be attributed to its longer dew accumulation time during the early morning, resulting in a positive feedback mechanism. The lower evaporation rate at the sun-sheltered habitat results in higher condensation rate and in longer condensa-tion time during the very early morning hours, leading to higher maximal dew values, which in turn facilitate longer dew duration.
The equal nocturnal dew amounts as received at dawn at the relatively flat hilltops and at the windward stations, i.e., the north- and west-facing footslope stations, deserve special attention. The lack of preferential condensation at the windward exposures do
Ž .
not support Kappen et al. 1980 hypothesis that dew distribution follow advective Ž patterns. In this regard, it is worthwhile mentioning that the Top West station station
.
( )
G.J. KidronrAtmospheric Research 55 2000 257–270 269
Ž
may account for approximately 70% of the winds during the fall dewy season Kidron et .
al., 2000 , advective patterns of dew condensation were not observed. The higher maximal amounts of dew at the northern and western exposures can thus be attributed to higher rates of condensation during the early morning hours, a phenomenon that may
Ž . also explain the variability in dew distribution obtained by Kappen et al. 1980 .
This however may not be true for fog condensation. Fog may be carried by the light Ž .
morning winds, as was also pointed out by Kappen et al. 1980 for the Namib Desert. Advective condensation, depending upon the direction of the fog movement, may thus be feasible. However, the meager data on fog did not facilitate such an analysis. Moreover, owing to the dominance of dew over fog precipitation in the central Negev Highlands, an overall distribution patterns of advective condensation may not be likely and consequently could not have been observed.
Dew and fog distribution patterns may have important ecological implications. They Ž
may affect lichen and snail distribution Kappen et al., 1980; Shachak et al., 1987, .
1995 , and may assist in future studies concerning the role of dew in rock weathering
Ž .
and soil forming processes Goudie, 1989 . Since maximal dew values may not Ž
necessarily be obtained at sunrise as was often assumed Duvdevani, 1947; Lloyd, 1961; .
Wales-Smith, 1983 , and may change according to habitat, dew collection time should be carefully considered.
Acknowledgements
I would like to thank A. Danin and A. Yair for their support, O.L. Lange for his kind encouragement and C.A. Kidron for reviewing the manuscript.
References
Beysens, D., 1995. The formation of dew. Atmos. Res. 39, 215–237.
Broza, M., 1979. Dew, fog and hygroscopic food as a source of water for desert arthropods. J. Arid Environ. 2, 43–49.
Danin, A., Garty, J., 1983. Distribution of cyanobacteria and lichens on hillsides of the Negev Highlands and their impact on biogenic weathering. Z. Geomorphol. 27, 423–444.
Duvdevani, S., 1947. An optical method of dew estimation. Q. J. R. Meteorol. Soc. 73, 282–296. Duvdevani, S., 1964. Dew in Israel and its effect on plants. Soil Sci. 2, 14–21.
Ž .
Evenari, M., 1981. Ecology of the Negev Desert, a critical review of our knowledge. In: Shuval, H. Ed. , Developments in Arid Zone Ecology and Environmental Quality. Balaban ISS, Philadelphia, PA, pp. 1–33. Evenari, M., Shanan, L., Tadmor, N., 1971. The Negev, The Challenge of a Desert. Harvard Univ. Press,
Cambridge, MA, 345 pp.
Ž .
Friedmann, E.I., Galun, M., 1974. Desert algae, lichens and fungi. In: Brown, G.W. Ed. , Desert Biology II. Academic Press, New York, pp. 165–212.
Geiger, R., 1966. The Climate Near the Ground. Harvard Univ. Press, Cambridge, MA, 611 pp.
Ž .
Goudie, A.S., 1989. Weathering processes. In: Thomas, D.S.G. Ed. , Arid Zone Geomorphology. Belhaven Press, London, pp. 11–24.
( )
G.J. KidronrAtmospheric Research 55 2000 257–270
270
Kappen, L., Lange, O.L., Schulze, E.-D., Evenari, M., Buschbom, V., 1979. Ecophysiological investigations on lichens of the Negev Desert: IV. Annual course of the photosynthetic production of Ramalina
Ž .
maciformis Del. Bory. Flora 168, 85–105.
Kidron, G.J., 1988. Dew variability, lichen and cyanobacteria distribution along slopes at Sede Boqer,
Ž
Northern Negev, Israel. Unpublished MSc Thesis. The Hebrew University of Jerusalem, Jerusalem in
.
Hebrew, with English summary , 92 pp.
Kidron, G.J., 1998. A simple weighing method for dew and fog measurements. Weather 53, 428–433. Kidron, G.J., Yair, A., Danin, A., 2000. Dew variability within a small arid drainage basin in the Negev
Highlands, Israel. Q. J. R. Meteorol. Soc. 126, 63–80.
Lange, O.L., Schulze, E.D., Koch, W., 1970. Ecophysiological investigations on lichens of the Negev Desert:
Ž .
II. CO2 gas exchange and water conservation of Ramalina maciformis Del. Bory in its natural habitat
Ž
during the summer dry period. Flora 159, 38–62, technical translation 1655, National Research Council of
.
Canada .
Lloyd, M.G., 1961. The contribution of dew to the summer water budget of Northern Idaho. Bull. Am. Meteorol. Soc. 42, 572–580.
Monteith, J.L., 1957. Dew. Q. J. R. Meteorol. Soc. 83, 322–341. Oke, T.R., 1978. Boundary Layer Climates. Wiley, New York, 372 pp.
Shachak, M., Steinberger, Y., 1980. An algae-desert snail food chain: energy flow and soil turnover. Oecologia 46, 402–411.
Shachak, M., Jones, C.G., Granot, Y., 1987. Herbivory in rocks and the weathering of a desert. Science 236, 1098–1099.
Shachak, M., Jones, C.G., Brand, S., 1995. The role of animals in an arid ecosystem: snails and isopods as controllers of soil formation, erosion and desalinization. Adv. GeoEcol. 28, 37–50.
Wales-Smith, B.G., 1983. An inexpensive device for measuring net dewfall. Weather 38, 54–56.
Ž .
Yair, A., Lavee, H., 1985. Runoff generation in semiarid and arid areas. In: Anderson, M.G., Burt, T.P. Eds. , Hydrological Forecasting. Wiley, New York, pp. 183–220.
Yair, A., Karnieli, A., Issar, A., 1991. The chemical composition of precipitation and runoff on an arid limestone hillside, Northern Negev, Israel. J. Hydrol. 129, 371–388.