EXPLOITING SENTINEL-1 AMPLITUDE DATA FOR GLACIER SURFACE VELOCITY
FIELD MEASUREMENTS: FEASIBILITY DEMONSTRATION ON BALTORO GLACIER
A. Nascettia∗, F. Nocchia, A. Camplania, C. Di Ricoa, M. Crespia
a
Geodesy and Geomatics Division, University of Rome La Sapienza, Italy (andrea.nascetti, mattia.crespi)@uniroma1.it
Commission VII, ThS 3 - Sentinel-I Radar
KEY WORDS:Sentinel-1, glacier monitoring, SAR amplitude tracking, surface velocity, Baltoro Glacier
ABSTRACT:
The leading idea of this work is to continuously retrieve glaciers surface velocity through SAR imagery, in particular using the amplitude data from the new ESA satellite sensor Sentinel-1 imagery. These imagery key aspects are the free access policy, the very short revisit time (down to 6 days with the launch of the Sentinel-1B satellite) and the high amplitude resolution (up to 5 m). In order to verify the reliability of the proposed approach, a first experiment has been performed using Sentinel-1 imagery acquired over the Karakoram mountain range (North Pakistan) and Baltoro and other three glaciers have been investigated. During this study, a stack of 11 images acquired in the period from October 2014 to September 2015 has been used in order to investigate the potentialities of the Sentinel-1 SAR sensor to retrieve the glacier surface velocity every month. The aim of this test was to measure the glacier surface velocity between each subsequent pair, in order to produce a time series of the surface velocity fields along the investigated period. The necessary co-registration procedure between the images has been performed and subsequently the glaciers areas have been sampled using a regular grid with a250×250meters posting. Finally the surface velocity field has been estimated, for each image pair, using a template matching procedure, and an outlier filtering procedure based on the signal to noise ratio values has been applied, in order to exclude from the analysis unreliable points. The achieved velocity values range from 10 to 25 meters/month and they are coherent to those obtained in previous studies carried out on the same glaciers and the results highlight that it is possible to have a continuous update of the glacier surface velocity field through free Sentinel-1 imagery, that could be very useful to investigate the seasonal effects on the glaciers fluid-dynamics.
1. INTRODUCTION
The glaciers are a natural global resource and one of the princi-pal climate change indicator at global and local scale, being in-fluenced by temperature and snow precipitation changes; more-over the glaciers are the largest freshwater reservoirs on the Earth (Heid, 2011). Starting from 1894, thanks to the foundation of the International Glacier Commission at the 6th International Geo-logical Congress in Zurich, several investigations have been car-ried out to study the complex glaciers dynamics. Nowadays, the World Glacier Monitoring Service (WGMS http://www.wgms.ch) in collaboration with the Global Land Ice Measurements from Space (GLIMS http://www.glims.org), collects observations on time changes in mass, volume, area and length of glaciers (glacier fluctuations), as well as statistical information about the perennial ice distribution (glacier inventories) (Zemp et al., 2008) (GLIMS, 2012). Among the parameters used for glacier monitoring, the glaciers surface velocity is an important element, since it influ-ences the events connected to glaciers changes (mass balance, hydro balance, glaciers stability, landscape erosion) (Heid, 2011) (Karpilo, 2009) (Rolstad and Norland, 2009). In detail the glacier surface velocity is:
• connected to the glaciers mass balance, since it is useful in order to compute the flow rate that reaches the ablation area (Heid, 2011) (Karpilo, 2009) (Pelto et al., 2008)
• a stability indicator, since it measures the rate at which a glacier is sliding (calving rates) (Heid, 2011) (Rolstad and Norland, 2009)
• important for tracking material transportation and erosion phenomena (Heid, 2011) (K¨a¨ab, 2005)
∗Corresponding author
In particular, the surface glacier velocity can be measured using both in-situ survey and remote sensing geomatic techniques. Al-though the in-situ surveys are accurate and have the advantage of allowing ice flow monitoring at a high temporal resolution, it is difficult to cover wide and not accessible areas; moreover GPS surveys could be expensive and does not allow the acqui-sition of enough points to investigate the complex ice-dynamics (Karpilo, 2009). On the other hand, both optical and SAR satel-lite imagery enable the continuous monitoring of wide areas of the Earth surface and provide information independent from lo-gistic constraints.
Concerning optical satellite data, glaciers horizontal displacements have been measured mostly from repeated Landsat or ASTER data using different image correlation techniques devoted to es-timate the pixel offsets. For such work, the spatial resolution of the used images is the most crucial parameter, besides the time period between the acquisitions. Well-defined surface features, such as large crevasses or local debris cover, have to be identi-fied at the available resolution (K¨a¨ab et al., 2003). In this respect, for example, GLIMS database includes glaciers surface velocity fields computed using LANDSAT 7 and ASTER imagery (both with ground resolution of 15 m) (Gourlet et al., 2016); the main drawbacks are the low accuracy and temporal resolution of the glacier surface velocity, limited by the low GSD (Ground Sample Distance) and high revisit time of these sensors, and the depen-dence on the illumination and weather conditions.
on 1 March 2002 and ended on 8 April 2012 and the Sun syn-chronous polar orbit satellite carried a SAR sensor that operated at C band and able to collect repeat-pass imagery with a reviset time of 35 days. The potential of InSAR to map displacements with centimetric resolution has been succeffuly applied obtain-ing interestobtain-ing results in glaciology (Erten et al., 2009) (Evans, 2000). However, in the case of phase decorrelation due to rapid and incoherent glacier flow, offset-tracking technique outperfom the InSAR one becoming a welcome alternative for the estima-tion of glacier moestima-tion (Hollands, 2012) (Riveros et al., 2013).
2. SENTINEL-1 FOR GLACIAR MONITORING
Sentinel-1 is a costellation of two satellites that carry SAR sen-sor, known as Sentinel 1-A and Sentinel 1-B. Sentinel-1A was launched on 3 April 2014 and Sentinel-1B will be launched on 22 April 2016. This mission is able to acquire images with C band SAR sensor both day and night, independently from weather con-ditions. Sentinel-1A orbits at an altitude of about 700 km and it has a reviset time of 12 days that will be halved after the launch of Sentinel-1B. The orbit is sun-syncronous near polar. Sentinel-1 is used in the Copernicus Programme, a framework coordinated by European Commission for monitoring of the Earth. ESA is responsible for developing the family of Sentinel satellites and it permits data free automatic download of the areas of interest from the ESA portal to all users. The data acquired by Sentinel-1 are divided in three different levels of elaboration; in particular in the level 1 there are two types of product known as GRD (Ground Range Detected) and SLC (Single Look Complex). The GRD images include only the amplitude information, whereas the SLC images both amplitude and phase information.
The aim of this preliminary work is to investigate the potential of the new Sentinel-1A free SAR data for monitoring the glaciers surface velocity and highlight the seasonal fluctuations of the ve-locity field. In particular the key aspects that Sentinel-1 images present and that can represent an advancement for these kind of studies are the free access policy, the very short revisit time (down to 6 days with the incoming launch of the Sentinel-1B satellite) and the high amplitude resolution (up to 5 m); these characteris-tics could offer a more detailed surface velocity measurement in term of both spatial and temporal resolution, potentially all over the world.
3. METHOD AND DATA
The main steps that has been performed to extract the glaciar sur-face velocities field starting from the Sentinel 1-A SAR amplitude information are briefly resumed as follow:
• images stack acquisition and co-registration
• glacier area definition and sampling
• glacier surface velocity computation using the so called off-set tracking
3.1 Images stack acquisition and co-registration
During this work several tests have been conducted in order to se-lect the optimal temporal resolution of the images stack. It is clear that the optimal time interval between the two subsequently im-ages is related to the expected surface velocity values, also con-sidering the image ground resolution. The best results have been
obtained using a temporal resolution of 24/36 days (respectively two or three times the Sentinel 1-A revisiting time). As a mat-ter of fact, no significant results are obtained if the displacement of the glacier surface is smaller than the ground resolution in the chosen temporal resolution; on the contrary with lower tempo-ral resolution the speckle decorrelation increases quickly between the images pair.
After the selection of the stack it is necessary to perform the coregistration process in order to align, with a subpixel accuracy, all the imagery. We have performed tests using several com-mercial and open source software: the open source GMTSAR processor; the Sentinel-1 Toolbox (S1TBX) developed by ESA and the commercial SARscape developed by sarmap sa. Despite the SAR coregistration process is consolidated for most of the high-resolution SAR sensors we found some technical issues in Sentinel-1 stack data management. The best results in term of coregistration accuracy have been obtained using the SARscape software.
3.2 Glacier area definition and sampling
The GLIMS worldwide database provides the glacier outlines in standard shapefile format in WGS84 reference system (GLIMS, 2012). Starting from the glacier outlines we have sampled the area with a regular grid with a250×250meters posting obtain-ing a set of 2D points. For each of these points we have com-puted its height using the SRTM v4 (Shuttle Radar Topographic Mission) global digital surface model. Subsequently we have re-projected the 3D points in the SAR image geometry using the slant-range model (Capaldo et al., 2011) obtaining a set of im-age points where the glacier surface velocities were computed as described hereafter.
3.3 Surface velocity computation
Surface velocities were derived using offset intensity tracking al-gorithms on repeat SAR satellite imagery, also known as a tem-plate matching procedure (Capaldo et al., 2014) (Joughin et al., 2010). Based on the image intensity, this kind of techniques track surface features and also speckle pattern on a pair of coreg-istered images acquired in two different epochs. Even in SAR image pairs characterize by low coherence, distinct features (e.g. crevasses) can still be tracked using the same methods as applied to optical imagery (Luckman et al., 2003).
Figure 1: Offset tracking
the coordinates (x,y) in the first image; this pixel will become the focal point of the block reference size NxN. In the second image, the system creates a search window with size MxM that is the area where the search template have to find the equivalent focal point p. For doing that, the system calculate the NCC index on the different pixels and it chooses the pixel with the highest value (Figure1).
Finally an outlier filtering procedure based on the signal to noise ratio (SNR) values has been applied in order to remove from the analysis unreliable points.
4. RESULTS
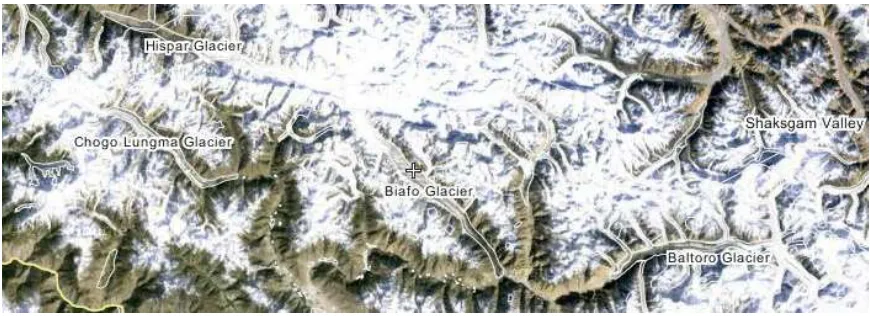
We applied this method to several glaciers, starting from Bal-toro,located in the Karakoram mountain range, Kashmir region (North Pakistan) in order to highlight the advantages and the draw-backs of computing surface velocity using Sentinel-1 data. The Karakoram is part of the Hindu Kush-Karakoram-Himalaya moun-tain range. It is located between the borders of India, Pakistan, Afghanistan, and China and stretches over 500 km in a NW to SE direction (see Fig. 2). In detail we have analysed the following four glaciers, that are the most famous and characteristic of the area:
• Baltoro glacier:it is one of the biggest glaciers in the world; it is located in Pakistan and runs trought part of the Karako-ram range. It is 63 km at lenght and its surface is about 700 kmq. Baltoro glacier is near some of the most highest peaks of the world as K2, Gasherbrum and Masherbrum. It is orig-inated by the confluence of different tributary glaciers; the most important of them are Godwin Austen glacier, Abruzzi glacier and Broad Peak glacier
• Biafo glacier:this glacier is located near Baltoro glacier. It is the second longest of the Karakoram glaciers at 68 km. Its basin covers a total area of 853 kmq , 628 kmq of which are permanent snow and ice, with 68 per cent of the glacier area forming the accumulation zone. Biafo Glacier differs from most of the other Karakoram glaciers, including Bal-toro glacier, in being nourished mainly by direct snowfall rather than by avalanching; for that characteristic, the glacier surface is covered by snow and appears uniform
• Hispar glacier: this is a 49 km long glacier, which meets the Biafo Glacier at the Hispar La (Pass) at an altitude of 5,128 m to create the worlds longest glacial system outside of the polar regions.
• Chogo glacier:it is a 47 km long glacier and it is nourished mainly by avalanches and so its surface is debris-covered. For that reason it is very similar to Baltoro glacier, even if it is smaller.
To estimate the surface velocity of those glaciers, we downloaded from the Sentinel scientific data hub (https://scihub.copernicus.eu/) 11 SAR Sentinel 1-A images (seeFigure3) in ground range for-mat (GRD) with a spatial resolution of10×10m. SAR images were revealed withInterferometric Wide Swath Modeand have an azimuth width of 250 km.
4.1 Baltoro Glacier
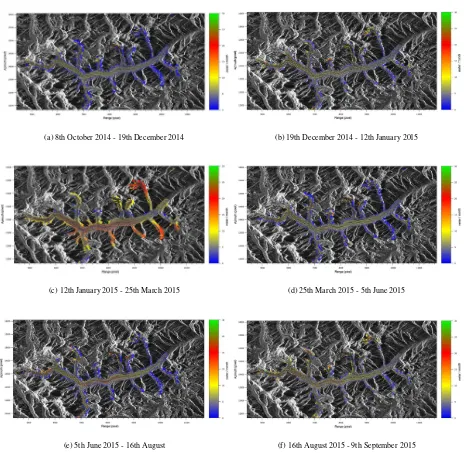
For each couple of images available in the stack (Figure3) we computed the glacier surface velocity field. In the Fig. 4 we dis-play the flow of glacier surface velocity expressed in m/months
obtained about every two months. The six figures highlight the natural downward movement of the Baltoro Glacier: on the upper area the surface velocities are relatively high while at the termi-nus are generally lower. In the central part we obtained that it is about 100m/yr. Moreover it is clearly visible that the glacier mar-gins are essentially stationary compared with the center due to the ice friction against the surrounding rocks. In particular over some of the blue areas it has been not possible to retrieve the velocity values because these areas are affected by SAR geometric distor-tion (i.e. layover and foreshortening). Figure 4 (c) shows a wrong coregistration between the two corresponding images: there is an evident rotation that compromise the surface velocity measure-ments (the margins of glacier have a velocity much higher than the expected values).
The velocity has some reasonable variations during the whole considered period: in the warmer seasons it increases, whereas during the winter it reduces. This phenomenon is more evident in the Figure.4 (f), where we can see some values of velocity higher along the glacier central axis. Moreover we compared our results with the one obtained by the Institute of Geodesy and Geophysics, University of Chinese Academy of Sciences. In this study they used ENVISAT ASAR three images acquired during the period 2004-2006 and evaluated the surface velocity field us-ing the offset trackus-ing method (Sun et al., 2014). The results have shown that the velocities were high in the upper area, while they were lower towards glacier terminus and the margins. The high-est velocities reached 160m/yr, while close to the terminus they were under 10m/yr. This study is in accordance with our results though it was not able to highlightt he seasonal variation of the surface velocity.
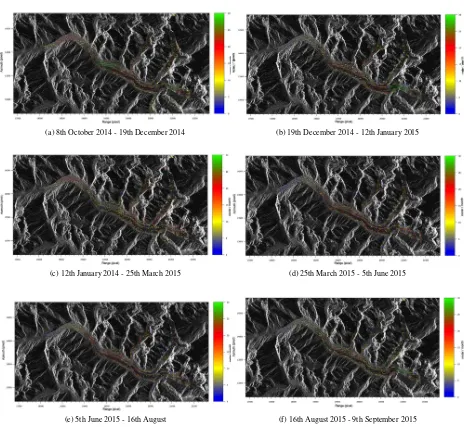
4.2 Chogo - Lugma Glacier
The results we obtained are close to those concerning Baltoro glacier in the sense that the method is able to give a good esti-mation of the surface velocity field. The surface velocities val-ues (about 15-20m/month) are, on average, higher than those obtained for the Baltoro glacier. This difference has also been reported in the past by some studies that have been involved in mapping the trend of surface velocity of the Karakoram glaciers (Rankl et al., 2014). Also in theFigure5 (c)there are evident problems of coregistration between the two images, as well as in the corresponding graph obtained for Baltoro glacier.
4.3 Biafo and Hispar Glaciers
We tried to estimate also the surface velocity field of both Bi-afo and Hispar glaciers. BiBi-afo glacier is different from the other glaciers in this region because, as mentioned, it is mainly nour-ished by direct snow-fall instead of avalanching; for this speci-ficity its surface is not debris covered-apart from the final section-and looks like very uniform. For that reason the obtained results are worse than those concerning both Baltoro and Chogo-Lugma glacier. In the Figure6, it is evident that the results obtained on the Biafo Glacier are not physically based (see the red vectors), whereas those on a part of the Hispar surface are physically ad-missible (see the yellow vectors). Given the ambiguity of those results, we decided that it was pointless to offer considerations about the velocity. The lack of physically based results on the Biafo glacier surface may be explained just by the fact that Bi-afo surface glacier is uniformly covered by snow during all the seasons; for that reason the speckle texture is too uniform and
Figure 2: Karakoram, Kashmir region, North Pakistan
Figure 3: Dataset
5. CONCLUSIONS AND FUTURE PROSPECTS
The aim of this work was to investigate the Sentinel-1 SAR im-agery potential to periodically retrieve glaciers surface velocity, also highlighting the seasonal fluctuation. In order to verify the reliability of the proposed approach, a first experiment has been performed using a stack of 11 images acquired in the period from October 2014 to September 2015 over the Karakoram mountain range (North Pakistan). The aim of this test was to evaluate the glacier surface velocity between each subsequent pair, in order to produce a time series of the surface velocity fields along the investigated period.
The necessary co-registration procedure between the images has been performed using the SARscape software and subsequently the glaciers areas, identified by the outlines available on the GLIMS database, have been sampled using a regular grid with a posting of 250m. Finally the velocity has been measured, for each image pair, using the template matching procedure implemented in the CIAS software; subsequently an outlier filtering procedure based on the signal to noise ratio values has been applied, in order to exclude from the analysis unreliable points.
Four different glaciers has been investigated: as regard the Bal-toro and Chogo-Lugma glaciers, the achieved surface velocity values on the central axis range from 10 to 25 meters/month and they are coherent to those obtained in previous studies. Some difficulties has been encountered to coregistered the images ac-quired during the period range from January to March compro-mising the corresponding results. Contrary of Baltoro and Chogo-Lugma, the Biafo and Hispar glaciers are uniformly covered by snow during all the seasons, and it has been not possible to cor-rectly retrieve the surface velocity field due to the lack of speckle texture. In the next test we will investigated the integration of the offset tracking with the InSAR technique using the Sentinel-1
data. Moreover, in the future to improve the outlier rejection will be considered the usage of Digital Surface Model (DSM) of the glacier to compute the local slope values and filter out the surface velocities that are significantly disagree with the morphology.
Overall, the results presented in this work confirm that SAR off-set tracking is an effective method to obtain glacier surface ve-locity and highlight that it is possible to have a continuous update of the glacier surface velocity field through Sentinel-1 imagery, that could be very useful to investigate the seasonal effects on the glacier fluid-dynamics. It is important to underline that Sentinel-1 mission made free available high resolution (5 m) SAR data with a worldwide coverage, enabling the possibility to establish a global web monitoring service to routinely and continuous update glacier surface velocity.
ACKNOWLEDGEMENTS
We are indebted with P. Pasquali and A. Meroni for making the ENVI-SARscape software available for this work.
REFERENCES
A. K¨a¨ab, A. and Vollmer, M., 2000. Surface geometry, thick-ness changes and flow fields on creeping mountain permafrost: Automatic extraction by digital image analysis. Permafrost and Periglacial Processes 11(4), pp. 315–326.
Capaldo, P., Crespi, M., Fratarcangeli, F., Nascetti, A. and Pieral-ice, F., 2011. High-resolution sar radargrammetry: A first appli-cation with cosmo-skymed spotlight imagery. IEEE Geoscience and Remote Sensing Letters 8(6), pp. 1100–1104.
Capaldo, P., Fratarcangeli, F., Nascetti, A., Mazzoni, A., Porfiri, M. and Crespi, M., 2014. Centimeter range measurement us-ing amplitude data of terrasar-x imagery. ISPRS - International Archives of the Photogrammetry, Remote Sensing and Spatial In-formation Sciences XL-7, pp. 55–61.
Erten, E., Reigber, A., Hellwich, O. and Prats, P., 2009. Glacier velocity monitoring by maximum likelihood texture tracking. IEEE Transactions on Geoscience and Remote Sensing 47(2), pp. 394–405.
Evans, A. N., 2000. Glacier surface motion computation from digital image sequences. IEEE Transactions on Geoscience and Remote Sensing 38(2), pp. 1064–1072.
(a) 8th October 2014 - 19th December 2014 (b) 19th December 2014 - 12th January 2015
(c) 12th January 2015 - 25th March 2015 (d) 25th March 2015 - 5th June 2015
(e) 5th June 2015 - 16th August (f) 16th August 2015 - 9th September 2015
Figure 4: Temporal series of Baltoro Glacier surface velocity field in slant-range geometry
Gourlet, P., Rignot, E., Rivera, A. and Casassa, G., 2016. Ice thickness of the northern half of the patagonia icefields of south america from high-resolution airborne gravity surveys. Geophys-ical Research Letters 43(1), pp. 241–249. 2015GL066728.
Heid, T., 2011. Deriving glacier surface velocities from repeat optical images. PhD Thesis, University of Oslo.
Heid, T. and K0Ł10Ł1b, A., 2012. Evaluation of existing im-age matching methods for deriving glacier surface displacements globally from optical satellite imagery. Remote Sensing of Envi-ronment 118, pp. 339 – 355.
Hollands, T., 2012. Motion tracking of sea ice with sar satellite data. PhD Thesis, University of Bremen.
Joughin, I., Smith, B. E. and Abdalati, W., 2010. Glaciologi-cal advances made with interferometric synthetic aperture radar. Journal of Glaciology, Volume 56, Number 200, December 2010, pp. 1026-1042(17).
K¨a¨ab, A., 2005. Combination of SRTM3 and repeat ASTER data for deriving alpine glacier flow velocities in the bhutan himalaya. Remote Sensing of Environment 94(4), pp. 463 – 474.
K¨a¨ab, A., Huggel, C., Paul, F., Wessels, R., Raup, B., Kieffer, H. and Kargel, J., 2003. Glacier monitoring from aster imagery: Accuracy and applications. Proceedings of EARSeL-LISSIG-Workshop Observing our Cryosphere from Space, Bern, March 11 C 13, 2002. EARSeL e Proceedings. 2. 43-53.
Karpilo, R., 2009. Glacier monitoring techniques. Geological Society of America.
Luckman, A., Murray, T. and Jiskoot, 2003. Ers sar feature-tracking measurement of outlet glacier velocities on a regional scale in east greenland. Annals of Glaciology 36(1), pp. 129– 134.
Pelto, M. S., Miller, M. M., Adema, G. W., Beedle, M. J., McGee, S. R., Sprenke, K. F. and Lang, M., 2008. The equilibrium flow and mass balance of the taku glacier, alaska 1950092006. The Cryosphere 2(2), pp. 147–157.
(a) 8th October 2014 - 19th December 2014 (b) 19th December 2014 - 12th January 2015
(c) 12th January 2014 - 25th March 2015 (d) 25th March 2015 - 5th June 2015
(e) 5th June 2015 - 16th August (f) 16th August 2015 - 9th September 2015
Figure 5: Temporal series of Chogo Glacier surface velocity field in slant-range geometry
Figure 6: Experimental results of Biafo Glacier during the period of 8th october 2014 - 13th november 2014
Riveros, N., Euillades, L., Euillades, P., Moreiras, S. and Bal-barani, S., 2013. Offset tracking procedure applied to high res-olution sar data on viedma glacier, patagonian andes, argentina. Advances in Geosciences 35, pp. 7–13.
Rolstad, C. and Norland, R., 2009. Ground based interferometric radar for velocity and calving rate measurements of the tidewater glacier Kronebreen, Svalbard, from August 2007 and 2008. In: D. N. Arabelos and C. C. Tscherning (eds), EGU General Assem-bly Conference Abstracts, EGU General AssemAssem-bly Conference Abstracts, Vol. 11, p. 2192.
Sun, Y., Jiang, L., Wang, H., Liu, L., Sun, Y. and Shen, Q., 2014. Detection and analysis of surface velocity over baltoro glacier with envisat asar data. In: 2014 IEEE Geoscience and Remote Sensing Symposium, pp. 4030–4033.