MEASURING POLYCENTRICITY OF MEGA-CITY REGIONS IN CHINA BASED ON
THE INTERCITY MIGRATION FLOWS
Xiaoyan Mu a, *, Anthony GO Yeh a
a Department of Urban Planning and Design, The University of Hong Kong, Hong Kong, Pokfulam Road, Hong Kong – [email protected], [email protected]
Youth Forum
KEY WORDS: Migration Flows, Mega-city Region, Polycentricity, Chinese City, Social Media Data
ABSTRACT:
This paper uses the intercity migration flows to examine relations between Chinese cities, identify the important mega-city regions and measure each region’s polycentricity from an interaction perspective. Data set contains the long-term residential migration trajectories of three million Sina weibo users across 345 cities. Cities with close connectivity deployed around one or several mega cities are identified as mega-city regions. Features of the mega-city regions are characterized by the strength of migration flows, density of connections, and regional migration patterns. The results show that the disparities exist in different mega-city regions; most mega-city regions are lack of polycentricity.
1 INTRODUCTION
Mega-city regions (MCRs) are integrated sets of cities and their surrounding suburban hinterlands across which labour and capital can be reallocated at very low cost (Florida, Gulden, & Mellander, 2008). It was first coined by Gottmann (1961) using the term megalopolis—it’s an “urban area of several tens of millions of people, including several cities and major urban centers, and extending continuously over several 100 km”. These spaces result of the networking of a group of metropolitan areas deployed around very large cities. They are characterized by high densities and the “symbiosis between urban and rural areas” creating “new models of multiple land use.” Gottmann also suggested that modern cities are better reviewed not in isolation, as centers of a restricted area only, but rather as parts of “city systems,” as participants in urban networks revolving in widening orbits. Lang and Dhavale (2005) listed several criteria in defining a “megapolitan area”, including at least two existing metropolitan areas, certain population size and contiguous metropolitan and micropolitan areas, etc. Mega regions are not a passing phenomenon, they are likely to persist and to enlarge their economic footprints because they benefit from the advantages of market scale, agglomeration economies, location and the increasing concentration of talented (Yusuf, 2007). The mega regions perform similar functions such as massing together talent, productive capability, innovation and markets. But they are more than a bigger version of a city or a metropolitan region. It represents the new, natural economic unit that emerges as metropolitan regions not only grow upward and become denser but also grow outward and into one another (Florida et al., 2008).
Today the world’s population has reached 7.3 billion. According to Global Health Observatory data1, the urban population in 2014 has accounted for 54% of the total global population, up from 34% in 1960, and continues to grow. The urban population is expected to grow approximately 1.84% per year between 2015 and 2020, 1.63% per year between 2020 and 2025, and 1.44% per year between 2025 and 2030. An additional 2.6 billion people will live in urban areas by 2050, and there will be 6.3 billion urban population. MCRs will play an increasing important role
* Corresponding author
in the world economy. Hall and Pain (2006) has pointed out that the networked polycentric MCR is emerging as a new urban phenomenon in 21st-century. It is developed around one or more cities of global status, characterized by a cluster of cities and towns, physically separate but intensively networked in a complex spatial division of labour. According to World Health Organization, the urban population growth, in absolute numbers, is concentrated in the less developed regions of the world. Even in less developed countries, a majority of people will be living in urban areas. The role of mega-city regions in the developing countries is of critical importance (Kundu, 2015; McGee & Robinson, 1995). From 1978 to 2010, China’s urban population increased dramatically from 170 million to 670 million, and its share of country’s total population rise from a mere 18% to 50%. China is now entering a new era of urbanization, and the urbanization level is expected to reach 75% by 2050, which means there will be 1.0 billion to 1.1 billion urbanized population in the city. Urbanization has been identified to be the next growth engine for the country’s economy. MCRs in China has been attracting increasing attention from scholars (Florida et al., 2008; Yang, Song, & Lin, 2014; Yeh, Yang, & Wang, 2014). Yang et al. (2014) noted that ten major MCRs which are identified by China’s national development and reform commission (NDRC) cover about 20% of the total area of China, and more than half of national population.
1966; Smith & Timberlake, 2001). Our results will be a supplementary and verification of the current definition of the MCRs.
This article is structure as follows: After detecting the community structure of the Chinese cities, we define the core area—MCRs based on the migration interactions. Then we further examine the polycentric structure of the defined MCRs.
2 DATA
We define migration as “previous-residence to place-of-current-residence”. Our dataset is collected from Sina weibo (http://www.weibo.com/), which is the largest and most popular social media in China. It had 236 million monthly active users (MAUs) and 106 million daily active users (DAUs) on average in December 2015 (Weibo, 2016). In the meantime the total Internet users in China was 688 million, penetrating 50.3% of the country’s population (CINIC, 2016). The weibo users are quite young, 80% of the MAUs range in age from 17 to 35. The 2010 census shows that the migrants in the same age range account for half of all migrants. So we regard the social media data as a ideal dataset for extracti ng migration patterns. We use two self-reported location information of 3 million weibo users who are randomly selected across 345 cities2. The first location was captured by the web crawler in June 2011, June 2012, and January 2013 respectively (about one million users for each time). The second location was recorded in June 2015. In the context of weibo services, a self-reported location on a user’s information page stands for his/her usual residence city, which is defined by Eurostat as a place where a person normally spends the daily period of rest, regardless of temporary absences for purposes of
recreation, holidays, visits to friends and relatives, or business trips. If two reported locations of the same user are different, there might be a change of his/her usual residence, we infer that a migration happened during the past five years.Scholars have suggested that if users provide information over a long period of time, they are more likely to provide reliable information (Zagheni, Garimella, & Weber, 2014).Even though our samples are not representative of the whole population in China, we find that the distribution of three million users is positively correlated with the actual population distribution. Despite those cities without detailed urban population figures, the correlation coefficient between weibo users and the actual urban population in 304 cities reaches 0.88 (p value < 0.01). In order to obtain a representation of intercity relationship as much as possible, we identify an interaction between two cities only when reciprocal flows exist (at least one migrant in either direction).
From the description of MCRs (Florida et al., 2008; Gottmann, 1961, 1987; Yusuf, 2007), we have two basic criteria for definition: (i) cities should have dense intra-region connections and sparse inter-region connections; (ii) cities in the same MCR should have geographical proximity. Migration flows among cities are of different distances. In this study, only the short-distance migration will be taken into account—that means, we only consider the migrations between adjacent provinces. So we define an adjacent coefficient l and calculate it using the algorithm as following:
���=���∙ ��� � ∈ �,� ∈ �, � ≠ � ; (1)
where��� represent the strength of connectivity between city i and city j, ��� is the actual number of migrants from city i to city j, M and N are provinces or provincial-level municipalities, and
���=�1 0 ��� ����������ℎ���������=�;. (2)
Finally, we focus on 83,119 individuals with migration behaviors between 2,475 city pairs among 345 cities. A 345*345 adjacent matrix is created to describe the interactions between cities. A large l value indicates a stronge the instraction between a pair of cities. The average l value is 16.8. We list the distribution and spatial structure of the migration flows in Fig. 1.
3 RESULTS
In the following session we will detect the community structure in the migration network, define mega-city regions, analyze the spatial structure, and measure the polycentricity of the MCRs.
3.1 Community structure
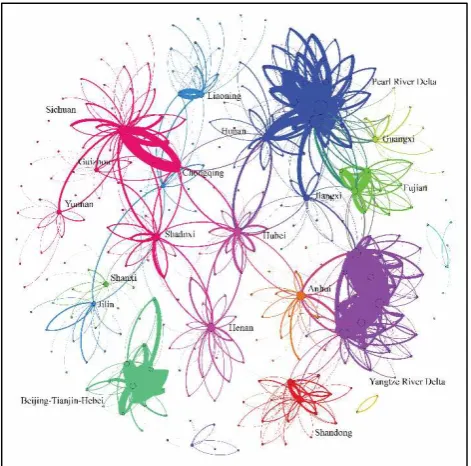
We can oberserve the distinct partitions in Fig. 1 when the flow intensity gets stronger. It indicates that most strong connections are intra-community flows while most inter-community flows are weak. To more clearly identify the communities in the urban network, we use two algorithms for community detection introduced by M. E. Newman (2004) and Blondel, Guillaume, Lambiotte, and Lefebvre (2008). The basic principle is that the nodes which are densely connected are grouped together. Both algorithms find around fourteen communicites in the migration process. We display the community structure in Fig. 2.
Figure 2 The community structure based on the migration flows (l >16). Different colors represent different community affiliations, the size of the node indicates the number of cities connected to it, the width of the line shows the intensity of migration flows.
We have a general understanding of the communities from the portrayal—one community may consist of cities from one or several provinces; cities from one certain province usualy belong to one certain community; communities are quite different in the size and structure. Three communities are relatively isolated— Xinjiang, Inner Mongolia and Hainan Island, they don’t have close connections with other communities. Five communities
show the boundary effect of the province , such as Shangdong, Anhui, Fujian, Guangxi, and Shanxi. The composition of multi-province communities are a bit more complicated. However, even some communities defined by the algorithm contain two or more provinces, such as Henan-Hubei community, Sichuan-Chongqing-Yunnan-Guizhou-Shaanxi community, Pearl River Delta-Changsha-Jiangxi community, and Liaoning-Heilongjiang-Jilin community, we suggest that they can be further decomposed due to the relative sparse connections between the subgroups. Pearl River Delta, Yangtze River Delta and Beijing-Tianjin-Hebei MCR are three regions with the strongest intra-community interactions. The quick detection gives us a basic impression about the community structure among Chinese cities. It provides a foundation for us to define the MCRs. Based on this preliminary partition result, we can further examine the major components of each MCR according to the properties of cities and characters of migration flows between cities.
3.2 Mega-city regions
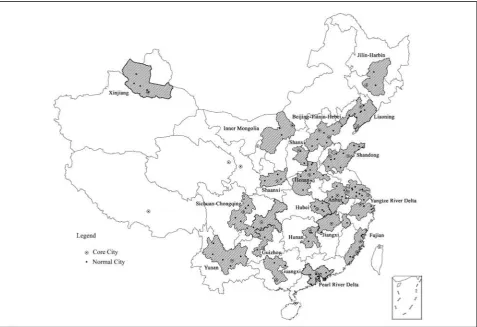
We regard the MCR as the most connected part of the community. We proposed three criteria in defintion: (i) there should be at least three cities, the urban population of the core city should be above one million; (ii) cities should have geographical proximity; (iii) cities should have close connections with each other. Here we use the index degree to measures how many neighbours node i has in the community. The degree of a city in the urban system is the number of other cities connected to it (Amaral, Scala, Barthelemy, & Stanley, 2000; Barabási & Albert, 1999). Usually the nodes with the highest degrees also play important roles in the functioning of the system (M. Newman, 2010). We suggest that the degree of a city in the MCR should be no less than the average degree of cities in the community ( �̅�� ). The “geographical proximity” can be further analyzed by the spatial distance, but in this article, we simply explain it from perspective of adjacency. The major mega-city regions defined by our methods are shown in Fig. 3 and listed below.
Yangtze River Delta. The core cities are Shanghai, Hangzhou, and Nanjing, surrounded by seven cities from Jiangsu province and four cities from Zhejiang province. These cities are Suzhou, Changzhou, Wuxi, Taizhou, Nantong, Yangzhou, Zhenjiang, Ningbo, Jinghua, Jiaxing, and Shaoxing.
Pearl River Delta.The core cities are Guangzhou and Shenzhen, surrounded by Dongguan, Foshan, Zhongshan, Zhuhai, Hong Kong, Huizhou, Jiangmen, and Zhaoqing.
Beijing-Tianjin-Hebei MCR. The core cities are Beijing and Tianjing, surrounded by six cities from Hebei province— Langfang, Qinhuangdao, Shijiazhuang, Tangshan, Baoding, and Cangzhou.
Fujian MCR. The core cities are Xiamen and Fuzhou, surrounded by Quanzhou, Zhangzhou, Ningde, and Putian.
Sichuan-Chongqing MCR. The core cities are Chengdu and Chongqing, surrounded by Mianyang, Nanchong, Deyang, Zigong, Leshan, Meishan, Yaan, Luzhou, and Yibin.
Shandong MCR. The core cities are Jinan and Qingdao, surrounded by Yantai, Taian, Weihai, Weifang, Linyi, Zibo, Jining, and Rizhao.
core city is Xi’an, surrounded by Baoji, Xianyang, Tongchuan and Weinan.
Liaoning MCR. The core cities are Shenyang and Dalian, surrounded by Jinzhou, Anshan, Fushun, Dandong, Huludao, Panjin, Yingkou, and Benxi.
Henan MCR. The core cities are Zhengzhou and Luoyang, surrounded by Xinxiang, Kaifeng, Anyang, Nanyang, Pingdingshan, Jiaozuo, Shangqiu, and Xuchang.
Hubei MCR. The core city is Wuhan, surrounded by Huangshi, Huanggang, and Xiaogan.
Hunan MCR. The core city is Changsha, surrounded by Hengyang, Zhuzhou, and Xiangtan.
Yunan MCR. The core city is Kunming, surrounded by Qujing, Yuxi, Chuxiong, Dali, and Lijiang.
Xinjiang MCR. The core city is Urumuqi, surrounded by Ili, Karamay, Shihezi, and Changji.
Jilin-Heilongjiang MCR. The core city is Changchun, surrounded by Harbin and Jilin.
Jiangxi MCR. The core city is Nanchang, surrounded by Jiujiang, Shangrao, and Yichun.
Guangxi MCR. The core city is Naning, surrouned by Hechi and Liuzhou.
There are three types of MCRs according to our observation. Fisrt is the developed regions, such as Yangtze River Delta, Pearl River Delta, Beijing-Tianjin-Hebei MCR, Fujian MCR. There are two or more core cities in these regions. The normal cities have close connections with not only the core cities but also with each other. Second is the developing regions, such as Sichuan-Chongqing MCR, Liaoning MCR, and Shandong MCR. There are one or two core cities in these regions, the surrounding normal cities have close connections with the core cities, but they have few interactions between each other. The third type is the underdeveloped regions, such as Xinjiang MCR, Guangxi MCR, or Jiangxi MCR. Strictly speaking they can hardly be called MCRs. There is one core city in these regions, but it is not attractive enough to the surrounding cities. The connections are weak, and there is few interactions between normal cities.
If we compare the division results with the urban regions defined by Fang et al. (2011), which are mainly based on the population, urbanization, economic development and regional plans, we find that for the developed MCRs, their constitutions are quite similar. But for the developing and underdeveloped ones, there might be some differences. Even some cities are geographically close to the core cities, currently they don’t have tight connections to be regarded as one region. For example, in Guangxi province, Nanning is supposed to be the core city of the urban region which includes three southern cities Beihai, Fangchengang and Qinzhou (Fang et al., 2011). However, we find that the interactions within the south region are weak and sparse, even not comparable with the interactions between cities in the north. There is a possibility that the north part will be developed into a MCR before the south part. These findings may provide some insights for the regional plan and policy making.
3.2 Measurement of polycentricity
The polycentricity means different things in different contexts and at different spatial scales (Davoudi, 2003). In this article, we would like to use it at the macro level of inter-urban scale to denote the spatial structure and existence of multiple centers in a MCR. We use the indices as follows:
Network density. For each defined mega-city region, we conceptualize the cities into nodes and migration flows between cities into edges. In a MCR graph,
∆= ���
�(�−1) , (3)
where ∆ is the network density, ��� is the total number of edges, � is the number of nodes. ∆ ranges from 0 to 1, which means no connection to fully connected with each other.
Connection intensity. We use connection intensity to measure the average strength of edges in each MCR,
�̅=∑ ∑ ���� �
��� , (4)
where �̅ is the connection intensify of a MCR, ∑ ∑ �� � �� is the total volume of migration flows in the MCR, ��� is the total number of edges in graph.
Polycentricity. It is often described as the morphological polycentricity (Green, 2007; Liu et al., 2015),
�= 1− ��
����� , (5)
where P represent the polycentricity of a MCR, ranging from 0 (complete monocentricity) to 1 (perfect polycentricity). �� is the standard deviation of degree in the MCR, ����� is the standard deviation of degree in a two-node network where one node has zero degree and the other has the highest degree value in the MCR.
Symmetry. The symmetry of the node and the edge are both examined, the formula is introduced by Zhao, Li, Zhong, and Derudder (2016):
��= 1−1
2∑ ∑ ��� � ��− ���� , (6)
��= 1−1
2∑ �∑ �� � ��− ∑ �� ��� , (7)
where SL indicates the edge symmetry and SN indicates the node symmetry. ��� is the relative strength of the migration flow from city i to city j compared to the total flow volume in the MCR. SL and SN range from 0 (complete monocentricity) to 1 (perfect polycentricity).
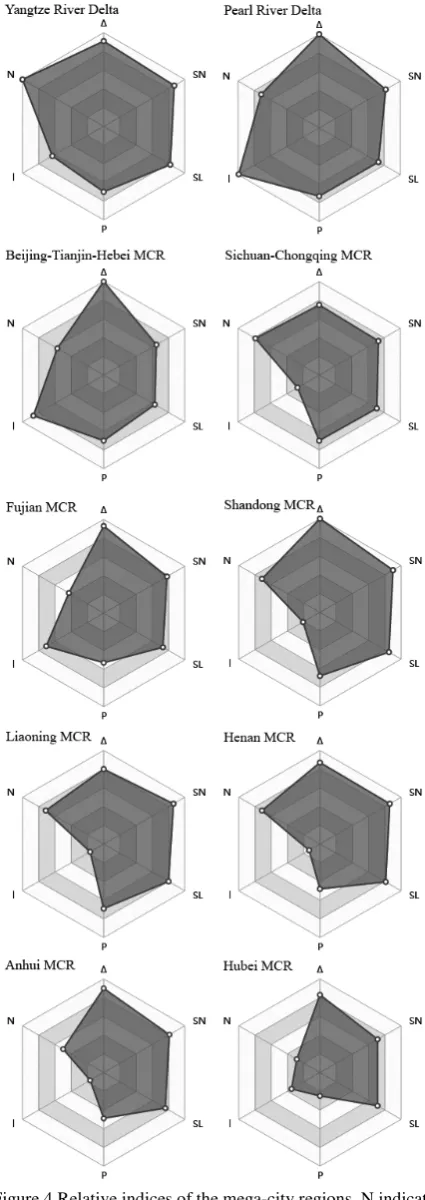
The indices values show the disparities between different MCRs: N ranges from 4 to 14, �̅ ranges from 16 to 119, ∆ ranges from 0.75 to 1, P ranges from 0.25 to 0.73, SL ranges from 0.63 to 0.85, SN ranges from 0.65 to 0.9.
We list the relative indices of ten MCRs in Fig. 4, they are Beijin-Tianjin-Hebei (BTH) MCR, Pearl River Delta (PRD), Yangtze River Delta (YRD), Sichuan-Chonqing (SCH) MCR, Fujian (FJ)
MCR, Shandong (SHD) MCR, Liaoning (LN) MCR, Henan (HN) MCR, Anhui (AH) MCR, and Hubei (HB) MCR.
We get the information that MCR sizes are quite different from each other. Six MCRs contain ten or more than ten prefectural-level cities. The large network density value means the defined MCRs have dense connections within the region. But the connectin densities vary a lot. BTH, PRD and YRD have the most active migrations, then followed by FJ MCR. The average strenght of migration flows in other MCRs are relatively much weaker. MCRs with a P value above 0.5 usually have two or more than two core cities, such as YRD, PRD, BTH, SCH, SHD, LN and FJ MCR, most of which locate in in the eastern coastal area except SCH. SCH is the only region in the western area which shows certain polycentricity. MCRs with a P value below 0.5 usually have only one core city, such HN, AH, and HB MCRs, which locate in the central area. SN and SL values show how evenly the migration flows distribute. We find that BTH MCR show the significant asymmetry, because flows between Beijing and Tianjin account for a large part of the whole migration.
4 CONCLUSIONS
The MCR and the polycentric development has been flourishing in China both in regional plans and academic studies. Based on the existing common recognition of urban regions, the current studies have analyzed the polycentricity of urban regions in China from the perspective of transportation network (Liu et al., 2015) and enterprise association network (Zhao et al., 2016). This article contributes to the literature in several ways. First we explore the connections between cities via migration flows, and for the first time define the mega-city region from an interaction perspective. It is a verification and examination of the previous definition. Second we use a successive narrow down method to detect the MCRs—from the community to the core area, and then the regions. We will further improve the method for better detection and more reasonable definition. This method can be applied to detect the specific area via various flows. We can not only find the core areas but also the buffer areas. Third we use six indices to describe the structure of ten major MCRs, revealing the characteristics of spatial development of these important regions.
The results show that the MCRs in China are unevenly distributed and disparities exist in different MCRs. Most developed MCRs locate in the eastern costal area. These MCRs show the polycentricity in their spatial structure with two or more core cities. Cities have dense and tight connections with each other. Most of the developing MCRs locate in the central area. They usually lack of polycentricity with only one core city. There are well connections between the core city and normal cities but few connections between normal cities. Few MCRs locate in the western area except the SCH MCR. We suggest that we may consider the actual interactions between cities when we are designing the future development for the cities.
NOTES
1. Please refer to Urban population growth, available at http://www.who.int/gho/urban_health/situation_trends/urba
n_population_growth_text/en/.
2. The selected cities include 292 prefecture-level cities (diji shi), 30 autonomous prefectures (zizhi zhou), 3 leagues (meng) and 8 prefectures (diqu), 4 direct-controlled municipalities (zhixia shi), 2 special administrative regions, and 6 counties. For simplicity, we use the term “city” to call all these units.
ACKNOWLEDGEMENTS
We thank Yin Zhu and Jing Yuan’s help in collecting the social media data, as well as Xiaohu Zhang’s contribution in running the algorithm on community detection.
REFERENCES
Amaral, L. A. N., Scala, A., Barthelemy, M., & Stanley, H. E., 2000. Classes of small-world networks. Proceedings of the National Academy of Sciences, 97(21), pp. 11149-11152.
Barabási, A.-L., & Albert, R., 1999. Emergence of scaling in random networks. Science, 286(5439), pp. 509-512.
Blondel, V. D., Guillaume, J.-L., Lambiotte, R., & Lefebvre, E., 2008. Fast unfolding of communities in large networks. Journal of statistical mechanics: theory and experiment, 2008(10), P10008.
China Internet Network Information Center, 2016. The 37th statistical report on Internet development in China. Beijing, China: China Internet Network Information Center.
Davoudi, S., 2003. European briefing: Polycentricity in European spatial planning: from an analytical tool to a normative agenda. European Planning Studies, 11(8), pp. 979-999.
Fang, C., Yao, S., & Liu, C., 2011. The development report of Chinese urban regions 2010. Beijing: Science Press. (in Chinese)
Florida, R., Gulden, T., & Mellander, C., 2008. The rise of the mega-region. Cambridge Journal of Regions, Economy and Society, 1(3), pp. 459-476.
Gottmann, J., 1961. Megalopolis: The urbanized northeast seaboard of the United States. Cambridge, MA: MIT Press.
Green, N., 2007. Functional polycentricity: a formal definition in terms of social network analysis. Urban Studies, 44(11), pp. 2077-2103.
Hall, P. G., & Pain, K., 2006. The polycentric metropolis: learning from mega-city regions in Europe: Routledge.
Kundu, D., 2015. Urbanization trends of Indian metropolises: A case of Delhi with specific reference to the urban poor. In Urban Development Challenges, Risks and Resilience in Asian Mega Cities, Janpan: Springer, pp. 31-47
Lang, R. E., & Dhavale, D., 2005. Beyond megalopolis: Exploring America’s new “negapolitan” geography. Metropolitan Institute Census Report Series, Census Report. Lee, E. S., 1966. A theory of migration. Demography, 3(1), pp. 47-57.
Liu, X., Derudder, B., & Wu, K., 2015. Measuring polycentric urban development in China: An intercity transportation network perspective. Regional Studies, pp. 1-14.
McGee, T. G., & Robinson, I. M., 1995. The mega-urban regions of Southeast Asia: UBC Press.
Newman, M. E., 2004. Fast algorithm for detecting community structure in networks. Physical review E, 69(6), 066133.
Smith, D. A., & Timberlake, M. F., 2001. World city networks and hierarchies, 1977-1997, an empirical analysis of global air travel links. American Behavioral Scientist, 44(10), pp. 1656-1678.
Weibo Company, 2016. Weibo corp fourth quarter and fiscal year 2015 financial results. Retrieved from
http://ir.weibo.com/phoenix.zhtml?c=253076&p=irol-newsArticle&ID=2113781 (25 Mar. 2016)
Yang, J., Song, G., & Lin, J., 2014. Measuring spatial structure of China’s megaregions. Journal of Urban Planning and Development. 141(2), 04014021.
Yeh, A. G., Yang, F. F., & Wang, J., 2014. Producer service linkages and city connectivity in the mega-city region of China: A case study of the Pearl River Delta. Urban Studies, 52(13), pp. 2458-82.
Yusuf, S., 2007. About urban mega regions: Knowns and unknowns. World Bank Policy Research Working Paper No. 4252. Available at SSRN: http://ssrn.com/abstract=994076 (20 Apr. 2016)
Zagheni, E., Garimella, V. R. K., & Weber, I., 2014. Inferring international and internal migration patterns from Twitter data. Paper presented at the Proceedings of the companion publication of the 23rd international conference on World wide web companion.