SPECTRAL IMAGING FROM UAVS UNDER VARYING ILLUMINATION CONDITIONS
T. Hakala1, E. Honkavaara1, H. Saari2, J. Mäkynen2, J. Kaivosoja3, L. Pesonen3, I. Pölönen4
1 Finnish Geodetic Institute, Department of Remote Sensing and Photogrammetry, Geodeetinrinne 2, P.O. Box 15, FI-02431 Masala, Finland – (teemu.hakala, eija.honkavaara)@fgi.fi
2
VTT Technical Research Center of Finland, Photonic Devices and Measurement Solutions, P.O.Box 1000, FI-02044 VTT, Finland – (heikki.saari, jussi.makynen)@vtt.fi
3MTT Agrifood Research Finland, FI-31600 Jokioinen, Finland – (jere.kaivosoja, liisa.pesonen)@mtt.fi 4Department of Mathematical Information Tech., University of Jyväskylä, P.O.Box 35, FI-40014, Jyväskylä, Finland –
(ilkka.polonen)@jyu.fi
KEY WORDS: Photogrammetry, Geometry, Radiometry, Hyper spectral, Environment, Classification, High-resolution
ABSTRACT:
Rapidly developing unmanned aerial vehicles (UAV) have provided the remote sensing community with a new rapidly deployable tool for small area monitoring. The progress of small payload UAVs has introduced greater demand for light weight aerial payloads. For applications requiring aerial images, a simple consumer camera provides acceptable data. For applications requiring more detailed spectral information about the surface, a new Fabry-Perot interferometer based spectral imaging technology has been developed. This new technology produces tens of successive images of the scene at different wavelength bands in very short time. These images can be assembled in spectral data cubes with stereoscopic overlaps. On field the weather conditions vary and the UAV operator often has to decide between flight in sub optimal conditions and no flight. Our objective was to investigate methods for quantitative radiometric processing of images taken under varying illumination conditions, thus expanding the range of weather conditions during which successful imaging flights can be made. A new method that is based on insitu measurement of irradiance either in UAV platform or in ground was developed. We tested the methods in a precision agriculture application using realistic data collected in difficult illumination conditions. Internal homogeneity of the original image data (average coefficient of variation in overlapping images) was 0.14-0.18. In the corrected data, the homogeneity was 0.10-0.12 with a correction based on broadband irradiance measured in UAV, 0.07-0.09 with a correction based on spectral irradiance measurement on ground, and 0.05-0.08 with a radiometric block adjustment based on image data. Our results were very promising, indicating that quantitative UAV based remote sensing could be operational in diverse conditions, which is prerequisite for many environmental remote sensing applications.
1. INTRODUCTION
The Fabry-Perot interferometer (FPI) based light-weight spectrometric camera developed by the VTT Technical Research Centre Finland (Mäkynen et al., 2011; Saari et al., 2011) is one of the most exciting new technologies in UAV sensors. It takes successive images at different wavelengths. These rectangular format images can be combined into a spectral data cube. During UAV operation these data cubes are overlapping each other, enabling the use of photogrammetric methods for producing spectral 3D information.
One of the most important advantages of UAVs is the flexibility of operation. UAV operator can more freely choose the moment of flight compared to manned aircrafts. Often the limiting factor for UAVs is the weather conditions. Many applications require clear sky conditions or at least even illumination. Unfortunately such days are sparse in many climate regions. We have developed processing methods for utilizing partially cloudy days for successful measurements. Improved post processing allows UAV operators to fly during the suboptimal days and still to provide acceptable radiometric quality, increasing the utilization rate of the equipment. All-weather data collection is also a prerequisite in many time critical applications.
Previously we have used the FPI camera in precision farming (Saari et al., 2011; Honkavaara et al., 2012; 2013a) and in water quality mapping (Honkavaara et al., 2013b). Both of these applications are time critical requiring remote sensing data at
exact dates. The utilization of the full potential of the FPI camera requires advanced methods for radiometric correction.
During summer 2012 we carried out imaging campaigns with the FPI spectral camera from manned and unmanned platforms. The weather was poor in Finland for remote sensing in the entire season, and as a result we had a lot of variable quality data. To overcome this we have investigated different post processing methods to improve the data uniformity. Our first approach was a radiometric block adjustment that was based on image information only (Honkavaara et al., 2012, 2013a). In this investigation, our objective was to investigate a new method, which utilizes insitu irradiance measurements. We describe theoretical background of our radiometric correction approach in Section 2. Empirical investigation is described in Section 3 and results are presented in Section 4.
2. METHODS FOR RADIOMETRIC CORRECTION OF UAV IMAGE DATA
The conventional quantitative methods for physically based atmospheric correction of airborne images have been developed for multispectral and hyperspectral imagery operating with pushbroom imaging geometry (Richter and Schläpfer, 2002; Beisl et al., 2008). Recently, these methods are being extended for airborne sensors with rectangular image format (López et al., 2011), and also for UAVs (Honkavaara et al., 2012, 2013a). Another extreme is the measurement of reflectance in field using goniospectrometers (Demicran et al., 2000; Schopfer et al., 2008; Suomalainen et al., 2009). These methods provide International Archives of the Photogrammetry, Remote Sensing and Spatial Information Sciences, Volume XL-1/W2, 2013
very accurate information of reflection properties of objects. The measurement setup in local-area UAV applications is between these two cases. The major difference in comparison to remote sensing with manned aircrafts is related to flying height, which is typically 50-150 m for UAVs and 400 m – 10 000 m for manned platforms. Because of this, the atmosphere between the ground and measurement device causes significantly less disturbances with UAVs. In comparison to goniometric measurement, in typical UAV application the area of interest is larger and it contains differing levels of incident and diffuse illumination, and often quality requirements are not as high. Furthermore, UAV imaging is carried out often in diverse conditions. New methods are needed for radiometric processing of UAV-imagery for quantitative applications.
For a very low altitude imagery the central radiation components entering the sensor are the surface reflected sunlight (Lsu
(λ)) and surface reflected diffuse radiance (Lsd (λ)) (adopted from Schowengerdt, 2007):
L at_sensor (λ)= Lsu(λ)+ Lsd(λ)= ρ(λ, θi, φi, θr, φr)τv(λ) τs(λ) E0(λ) cos(θ(x,y))/π + F(x,y)ρ(λ, 2π, θr, φr) τv(λ) Ed(λ) /π (1)
where ρ(λ, θi, φi, θr, φr) is the bidirectional spectral reflectance distribution function (BRDF) and ρ(λ,2π,θr,φr) is reflectance distribution function for diffuse light, τv(λ) and τs(λ) are the atmospheric transmittance in the view and solar paths, respectively, E0(λ) is the spectral irradiance on top of the atmosphere, Ed(λ) is the spectral irradiance at the surface due to diffuse illumination and θ is the solar incidence angle on a surface. θi and θr are the illumination and reflected light zenith angles and φi and φr are the azimuth angles, respectively. F(x,y) is the fraction of hemisphere visible to the sensor. To solve reflectance factor, information about diffuse light and other atmospheric influences are needed (Demicran et al., 2000; Richter and Schläpfer, 2002; Schaepman-Strub, 2006; Schopfer et al., 2008; Suomalainen et al., 2009).
We have developed a radiometric block adjustment method for UAV image blocks in order to produce homogeneous data from non-homogeneous input data (Honkavaara et al., 2012, 2013a). The basic principle of the approach is to use radiometric tie points in overlapping images and to determine a model for the differences in the grey values. Currently, we use the following model for a grey value (digital number, DN):
DNjk = arel_j (aabs Rjk(θiφi,θr,φr) + babs) + brel_j (2)
where Rk(θi,φi,θr,φr) is the bi-directional reflectance factor (BRF) of the object point, k in image j; aabs and babs are the parameters for the empirical line model for reflectance transformation and arel_j and brel_j are relative correction parameters with respect to the reference image. This model includes many simplifications, but can be extended by physical parameters.
In this study, we investigated how the insitu irradiance measurements (total irradiance with solar and diffuse components) could be utilized in the image block correction. With certain assumptions, it can be shown that differing levels of irradiance can be eliminated from at-sensor radiance measurements in two images by:
Ljc(λ)at_sensor = Lj(λ)at_sensor/(Ej(λ)/Eref(λ)) = Lj(λ)at_sensor Cj(λ) (3)
Where Cj(λ) is a correction factor for image j to normalize irradiance level to that of a reference image ref. If the assumptions are not valid, the accuracy of the correction will be reduced. When applying this method to DNs, ignorance of
sensor’s absolute radiometric calibration parameters (c1, c2) can cause some inaccuracy to the result; the dependency of DN and at-sensor radiance is DN= c1L(λ) at_sensor + c2.
3. EXPERIMENTAL DATA
3.1 FPI spectrometric camera
A spectrometric camera (Figure 1) based on a Piezoactuated Fabry-Perot interferometer (FPI) with an adjustable air gap has been developed in VTT Technology Research Center of Finland (Mäkynen et al., 2011; Saari et al., 2011). The imager rapidly changes the wavelength filter (FPI) pass band and takes successive images at different wavelength settings. These images are taken in less than a second and can be later on combined into a spectral data cube. The spectral range of the imager is 400-1000 nm with full width at half maximum (FWHM) of 10-40 nm. The number and spectral properties of the channels can be selected flexibly for each application. The 2012 prototype of the imager weighs about 600 g and has image size of 1024 x 648 pixels with 11 μm pixel size. GPS and irradiance sensor can be connected to the imager.
Figure 1. The Fabry-Perot interferometer spectral camera with GPS receiver, battery and irradiance sensors.
3.2 In situ irradiance measurement
We used two methods in measuring the irradiance: a ground based measurement and an irradiance sensor in the UAV (Figure 2).
During the flights, an ASD FieldSpec pro FR spectroradiometer (Analytical Spectral Devices Inc., Boulder Colorado) was positioned to the area being measured. The spectroradiometer had 180° cosine collector irradiance optics viewing the entire hemisphere of sky and was measuring the spectral irradiance (W/m2/nm) at spectral range of 350-2500 nm. Full width at half maximum (FWHM) of the irradiance spectrum was 3 nm for 350-1000 nm. A GPS receiver was attached to the spectroradiometer and a GPS time was acquired for each spectra. The data of the spectroradiometer and the UAV images were synchronized with GPS times.
For each FPI imager image and spectral layer same wavelength channels at same FWHM were separated from the ASD irradiance spectra taken at same time as the FPI image. For each image this gives an irradiance reference value for each spectral layer. These irradiance reference values were normalized between 0 and 1 and used to calculate multiplicative correction factors Cj(λ) (Equation 3).
Figure 2. Left, the cosine collector of the ASD FieldSpec pro was placed on a tripod about 1.5 meters from the ground. Right, the FPI spectral camera mounted under a helicopter UAV and the irradiance sensor mounted to the tail boom.
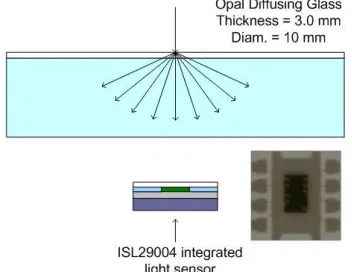
The irradiance sensor installed in the UAV is based on the Intersil ISL29004 photodetector (Intersil, 2011). The structure of the down dwelling irradiance sensor is described in figure 3. The photodetector dimensions are 3 mm x 3 mm x 1.0 mm. The signal dynamic range is 16 bits. The spectral sensitivity range is 400 – 1000 nm (D2 output used, see Figure 4). The acceptance angle of the sensor has been increased by placing an opal glass diffuser in front of the sensor (distance 3 mm). The sensor was not calibrated to measure in W/m2 and only relative, broadband irradiance intensity values were obtained, providing single correction factor for all layers, Cj.
Figure 3. The optical construction of the sensor module. An opal glass diffuser was used in the module to increase the acceptance angle of the sensor.
Figure 4. Relative spectral response plot of the Intersil ISL29004 photodetector. The normalized D2 output was used in the down dwelling irradiance sensor module.
3.3 Campaign with UAV
An empirical campaign was carried out at the MTT Agrifood Research Finland (MTT) agricultural test site in Vihti (N 60° 25' 21'', E 24° 22' 28''). The test area, a 76 m x 385 m (2.9 ha) patch of land, has a rather flat topography with a terrain height variation of 11 m and maximum slopes of 3.5 degrees. There were altogether 10 targeted XYZ ground control points (GCPs), with a relative accuracy of 2 cm and 10 natural XYZ GCPs, with a relative accuracy of 20 cm.
An image block was collected with the FPI spectral camera using a single-rotor helicopter UAV with a 5 kg payload and autopilot to enable an autonomous flight (Figure 2). The campaign was carried out between 10:39 and 10:50 in the morning local time (UTC +3). During the campaign, the illumination conditions were poor with fluctuating levels of cloudiness. The solar elevation and azimuth angles were 43° and 125°, respectively. The flight was carried out at a flying altitude of 140 m, producing GSD of 14 cm; the flying speed was 3.5 m/s. The block used in this investigation consisted of five image strips and a total of 80 images; the forward and side overlaps were 78% and 67%, respectively (Figure 5).
Figure 5. Image block and flight lines.
The FPI camera was equipped with a 500-900 nm filter. The camera was operated in free running mode and took spectral data cubes at the given intervals; the integration time was 5 ms. For the data, the usual radiometric calibration preprocessing steps were applied (Section 3.4). There were a total of 42 bands in the original raw data out of which it was possible to generate 36 spectral smile-corrected spectral layers. However, the images lacked data in some of the layers; so, ultimately, there were altogether 30 corrected spectral layers.
Table 1. Parameters of the UAV flight on 2.7.2012. Disturbed layers are in slanted and the layers 7, 16 and 29 are in bold.
Central wavelength (nm): (507.60, 508.80, 509.50,) 511.80, 517.90, 526.60, 7: 535.50, 544.20, 553.30, 562.50, 573.10, 582.70, 590.60, 595.20, 599.50, 16: 606.20, 620.00, 634.40, 648.00, 662.50, (678.30, 693.80, 707.00,) 716.80, 728.20, 742.90, 757.00, 772.10, 29: 787.50, 801.60, 815.70, 830.30, 844.40, 859.00, 873.90, 887.30
FWHM (nm): (15.19, 16.73, 14.69,) 19.66, 23.81, 25.53, 7: 24.87, 22.65, 23.90, 23.02, 27.15, 21.40, 18.32, 41.14, 22.11, 16: 44.03, 41.46, 41.05, 35.33, 40.39, (36.48, 38.32, 33.46,) 29.88, 32.73, 32.81, 27.58, 31.83, 29: 32.12, 25.87, 28.23, 29.53, 26.54, 28.32, 28.42, 26.41
3.4 Processing of FPI imager data
We have developed a processing chain for FPI imagery: 1. System corrections of the imagery using the
laboratory calibration, spectral smile correction and dark signal correction. These corrections values and algorithms are provided by VTT (Mäkynen et al., 2011; Rainio, 2013).
2. Format transformation from float format to unsigned integer format.
3. Matching of layers of individual images to eliminate layer mismatch (Honkavaara et al., 2013a).
4. Determination of image orientations of reference layers using a self-calibrating bundle block adjustment (Rosnell and Honkavaara, 2012). 5. Optionally also a DSM can be calculated (Rosnell and
Honkavaara, 2012).
6. Determination of radiometric imaging model to compensate radiometric disturbances from images, as well as reflectance transformation. A radiometric block adjustment method is being developed to determine optimal parameters by utilizing overlapping images (Honkavaara et al., 2012, 2013a).
7. Calculation of output georeferenced reflectance products, such as 3D point clouds and spectrometric image mosaics (Honkavaara et al., 2012).
We presented the results of processing steps 1-5 of the Vihti data in our recent publication (Honkavaara et al., 2013a). Our emphasis in this study is to carry out radiometric processing of orthophoto mosaics. Based on the previous assessment, the expected planimetric accuracy is 0.4 m.
In this investigation, our major emphasis was to improve methods for radiometric processing in step 6. Multiplicative correction factors were calculated using the irradiance measurements carried out in UAV as well as in ground (Equation 3). Furthermore, we used radiometric block adjustment with two parameter sets: BRDF model and brel_j; parameter arel_j (Equation 2).
We also tested very simple method where we calculated correction factors using average DNs of individual images. This method was considered only as a reference. It is very much dependent on object imaged, and is thus feasible only for uniform object areas. For this method, the correction factor is:
Cj(λ)= averageDNj(λ)/averageDNref(λ) (4)
To summarize, we used the following methods: 1. uav: broadband irradiance in UAV
2. ground: spectral irradiance on ground by ASD 3. average: image averages
4. BA: relB, BRDF: block adjustment with relative offset and BRDF correction
5. BA: relA: block adjustment with relative coefficient
When reflectance is needed, the reflectance transformation from DNs can be calculated for the entire corrected image mosaic by using insitu reflectance targets and an empirical line method.
We used the average coefficient of variation as the indicator of the radiometric homogeneity of image block. We calculated it using of DN differences of radiometric tie points: a grid of points over the block with a point interval of 10 m; in each overlapping image the average DN was calculated in an image
window of size 4.5 m x 4.5 m. First, coefficient of variation was calculated for each radiometric tie point using DNs of overlapping images and then average for all radiometric tie points was calculated.
4. RESULTS
4.1 Irradiance measurements
Relative values of the irradiance measurements by different sensors are presented in Figure 6. The different illumination conditions in each strip are clearly visible in the data. Strips 1-3 were collected under cloudy conditions. In the middle of strip 4 the conditions turned lighter and strip 5 was collected under brightest conditions. As the insitu irradiance sensor was stationary with a variable distance to the UAV of up to 100 meters, some difference between the irradiance data and the radiance seen by the UAV sensor is to be expected.
a) Vertical lines separate the different image strips.
4.2 Image correction
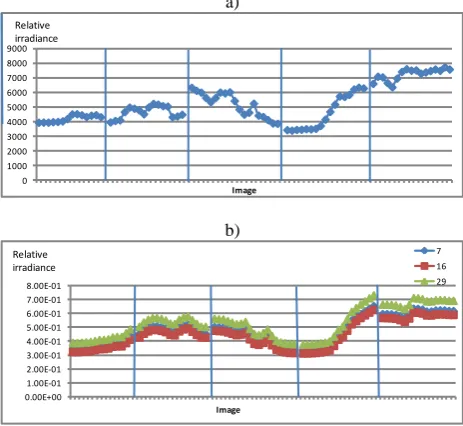
We calculated multiplicative correction factors for each image using image 132 as reference image (Equation 3, 4). It appeared that each correction factor followed similar trends (Figure 7a, b). The correction factor based on DN averages in images appeared to have slightly more variability than other factors; this is due to the impact of image content.
We used the correction factors based on ground measurement as the reference in evaluating performance of other methods (Figure 7c). The UAV based correction factor had a dependence on the flying direction: when UAV was flying to northeast (strips 1, 3, 5), the UAV based factor was larger than the ground based factor, and when UAV was flying to southwest (strips 2 and 4) the factors were more similar. The likely reason for this is that the orientation of the irradiance sensor varied with the flying direction. The factor based on radiometric block adjustment showed slight drift behavior.
a)
0 0.5 1 1.5 2 2.5 3
Image
ground, 7 uav BA: relA, 7 average, 7
b)
0 0.5 1 1.5 2 2.5 3
Image
ground, 29 uav BA: relA, 29 average, 29
c)
-50 -40 -30 -20 -10 0 10 20 30 40 50
Image
BA: relA, 29 average, 29 uav, 29 %
Figure 7. Multiplicative correction factors of different cases (see Section 3.4) for layers a) 7 and b) 29. c) Relative differences of different correction factors to correction factor based on ground irradiance measurement in layer 29 (in %).
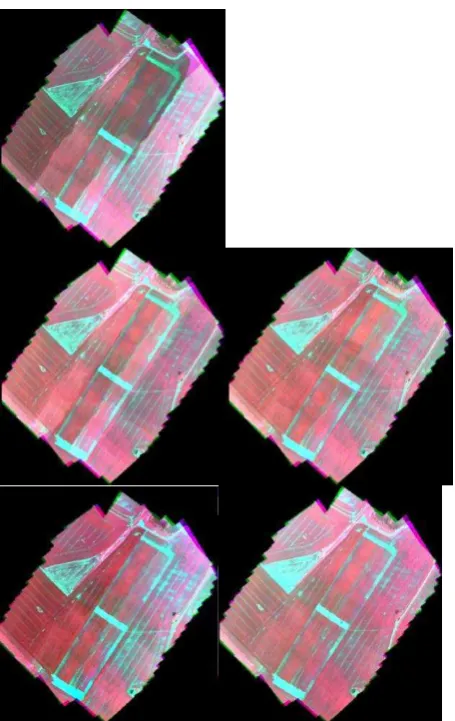
Image mosaics calculated for each correction case are shown in Figure 8. The block adjustment appeared to provide the best internal uniformity, but also some brightening appeared towards to the strips collected in brightest conditions (especially with BRDF correction, which was not ideal for the data collected in variable cloudy conditions). The correction factors based on irradiance measurements improved the uniformity greatly in comparison to the uncorrected case, but internal uniformity was not as good as in block adjusted data (brightness differences in individual images). On the other hand, the mosaics with irradiance based correction appeared to provide better absolute radiometric quality (no drift) than the block adjustment.
The results of homogeneity evaluation are shown in Figure 9. The average coefficient of variation was 0.14-0.18 if radiometric correction were not performed. The correction based on irradiance measurement in UAV provided the homogeneity on the level of 0.10-0-12 and the correction using ground irradiance measurement provided even better results, variation coefficient was 0.065-0.09. The possible reasons for poorer performance of UAV-method could be the installation issues and/or the use of broadband irradiance instead of spectral irradiance. The radiometric block adjustment with multiplicative correction term provided the best homogeneity, on the level of 0.05-0.075; the relative offset and BRDF
correction did not fit to the data. These homogeneity results are poorer than what we obtained from the analysis of single strip (0.02-0.04) (Honkavaara et al., 2013a), but especially the corrections with ground irradiance measurement and relative adjustment are likely to be accurate enough for agricultural application. It should be noted that in addition to the differences caused by illumination, the observing the object from different directions can have some influence on the results.
Figure 8. Image mosaics with different corrections. From top left to bottom: no correction, rel UAV, rel ground, BA: relB, BRDF; BA: relA (Section 3.4).
0 0.02 0.04 0.06 0.08 0.1 0.12 0.14 0.16 0.18 0.2
500 600 700 800 900
Wavelength (nm)
no corr uav ground BA: relB, BRDF BA: relA Coefficient of
variation
Figure 9. Average coefficients of variation (homogeneity) at radiometric tie points for non corrected data (no corr) and different correction case (Section 3.4). International Archives of the Photogrammetry, Remote Sensing and Spatial Information Sciences, Volume XL-1/W2, 2013
5. DISCUSSION AND CONCLUSIONS
We presented a new method based on insitu irradiance measurement for radiometric correction of UAV imagery that has been collected in variable imaging conditions.
We compared the new method to our previously developed radiometric block adjustment method based on image information only. Our conclusion was that the new method provided better absolute consistency than the method based only on image information. On the other hand, the block adjustment method provided the highest internal consistency. The radiometric correction based on spectral irradiance measured on ground provided better results than the correction based on broadband irradiance measured in UAV. However, it is likely that if the conditions were very complex, the illumination changes would be measured more accurately in the UAV. Ideally, spectral irradiance is measured in ground and in UAV. The results indicated that the best results could be obtained by a combined adjustment approach by integrating insitu irradiance measurements and image measurements.
Our theoretical considerations showed that the new approach is rigorous in certain circumstances. The typical measurement setup in UAV operation gives many possibilities for advanced radiometric correction. In many cases it is easy to integrate irradiance sensors to the UAV. Furthermore, it is often also possible to provide ground reference targets and measurement devices in target area, because the flights are often operated locally. More comprehensive approach will enable better reflection characterization. In all these cases the solution should depend on the application, and for many applications simple field operation and low cost are the critical factors.
Our results were very promising, indicating that high accuracy UAV remote sensing, with stereoscopic and spectrometric capabilities, is possible also in diverse conditions. This makes these methods suitable for many environmental measurement and monitoring applications. In the future we plan to continue the development of radiometric correction methods, and also evaluate the requirements of different applications.
6. ACKNOWLEDGEMENTS
The research carried out in this study was partially funded by the Academy of Finland (Project No. 134181). We are grateful to the colleagues at Finnish Geodetic Institute, Lauri Markelin, Tomi Rosenll, Juha Suomalainen and Jouni Peltoniemi, for their support and for assisting us in field campaigns in summer 2012.
7. REFERENCES
Beisl, U., Telaar, J., Schönermark, M. V., 2008. Atmospheric correction, reflectance calibration and BRDF correction for ADS40 image data. International Archives of the Photogrammetry, Remote Sensing and Spatial Information Sciences, 37 (Part B7), (on CD-ROM).
Demircan, A., Schuster, R., Radke, M., Schönermark, M., Röser, H.P., 2000. Use of a wide angle CCD line camera for BRDF measurements. Infrared Physics & Technology 41: 11– 19.
Honkavaara, E., Kaivosoja, J., Mäkynen, J., Pellikka, I., Pesonen, L., Saari, H., Salo, H., Hakala, T., Markelin, L., and Rosnell, T., 2012. Hyperspectral reflectance signatures and
point clouds for precision agriculture by light weight UAV imaging system, ISPRS Ann. Photogramm. Remote Sens. Spatial Inf. Sci., I-7, 353-358,
Honkavaara, E., Saari, H., Kaivosoja, J., Pölönen, I., Teemu Hakala, T., Litkey, P., Mäkynen, J., Pesonen, L., 2013a. Processing and assessment of spectrometric, stereoscopic imagery collected by a light weight UAV spectral camera for precision agriculture. Submitted.
Honkavaara, E., Hakala, T., Kirjasniemi, J., Lindfors, A., Mäkynen, J., Nurminen, K., Ruokokoski, P., Saari, H., Markelin, L., 2013b. New light-weight stereosopic spectrometric airborne imaging technology for high-resolution environmental remote sensing – Case studies in water quality mapping. ISPRS Ann. Photogramm. Remote Sens. Spatial Inf. Sci., Vol. XL-1/W1, ISPRS Hannover Workshop 2013, 21 – 24 May 2013, Hannover, Germany
Intersil 2011, ISL29004 datasheet
http://www.intersil.com/content/dam/Intersil/documents/fn62/fn 6221.pdf, (accessed 18.4.2013).
López, D.H., García, B.F., Piqueras, J.G., Aöcázar, G.V., 2011. An approach to the radiometric aerotriangulation of photogrammetric images. ISPRS Journal of Photogrammetry and Remote Sensing 66 (6), 883-893.
Mäkynen, J., Holmlund, C., Saari, H., Ojala, K., Antila, T., 2011. Unmanned aerial vehicle (UAV) operated megapixel spectral camera, Proc. SPIE 8186B.
Rainio, K., Instructions for FP_HC_Viewer.exe program. VTT Techical Research Centre of Finland, 10 p. 11.1.2013.
Richter, R., Schläpfer, D., 2002. Geo-atmospheric processing of airborne imaging spectrometry data. Part 2: atmospheric/topographic correction. International Journal of Remote Sensing, 23, 2631-2649.
Rosnell, T., Honkavaara, E, 2012. Point Cloud Generation from Aerial Image Data Acquired by a Quadrocopter Type Micro Unmanned Aerial Vehicle and a Digital Still Camera. Sensors 2012, 12, 453-480.
Saari, H., Pellikka, I., Pesonen, L., Tuominen, S., Heikkilä, J., Holmlund, C., Mäkynen, J., Ojala, K., Antila, T., 2011. Unmanned Aerial Vehicle (UAV) operated spectral camera system for forest and agriculture applications, Proc. SPIE 8174.
Schaepman-Strub, G., Schaepman M.E., Painter, T.H., Dangel, S., Martonchik, J.V, 2006. Reflectance quantities in optical remote sensing—definitions and case studies, Remote Sensing of Environment 103 (1), 27–42.
Schopfer, J., Dangel, S, Kneubühler, M., Itten, K.I. 2008. The Improved Dual-view Field Goniometer System FIGOS. Sensors 8, no. 8: 5120-5140.
Schowengerdt, R. A., 2007. Remote Sensing, Models and Methods for Image Processing, third ed. - Academic Press Inc., San Diego, CA, USA.
Suomalainen J, Hakala T, Peltoniemi J, Puttonen E., 2009. Polarised Multiangular Reflectance Measurements Using the Finnish Geodetic Institute Field Goniospectrometer. Sensors. 2009; 9(5): 3891-3907.