3D MAPPING OF CULTURAL HERITAGE: SPECIAL PROBLEMS AND
BEST PRACTICES IN EXTREME CASE-STUDIES
P. Patias
a, D. Kaimaris
b, Ch. Georgiadis
c, A. Stamnas
a, D. Antoniadis
a, D. Papadimitrakis
da
School of Rural and Surveying Engineering, Aristotle University of Thessaloniki, Greece - [email protected],
[email protected], [email protected]
b
School of Spatial Planning and Development (Eng.), Aristotle University of Thessaloniki, Greece - [email protected]
cSchool of Civil Engineering, Aristotle University of Thessaloniki, Greece - [email protected]
dFaculty of Forestry and Natural Environment, Aristotle University of Thessaloniki, Greece - [email protected]
KEY WORDS: Cultural heritage, Photogrammetry, Laser scanning, UAV-helicopter, 3D modeling.
ABSTRACT:
Photogrammetrey has a long successful history in the area of 3D modelling and documentation of cultural heritage monuments. In some cases an extensive study, preparation and the application of novel solutions is required for the successful documentation and 3D modelling of monuments. In most of the cases the problem that we have to face is difficulties regarding accessing, photographing, and measuring the monument from the optimal distance, in combination with the need for a high spatial resolution mapping. This paper is highlighting the special problems and the novel solutions, performed during mapping of two significant cultural heritage monuments in Greece. The Roussanou monastery (1527-1529 A.C., Meteora, Center Greece) and its underlying rock, had to be photographed and measured from a far distance and measured with various spatial resolutions. In the lakeside Neolithic settlement of Dispilio (6.000 B.C., western Greece) the enclosure which is covered with vegetation above a height of 3m, had to be measured with high spatial resolution. The combined use of a laser scanner, a digital camera equipped with a telephoto lens and UAV allowed the successful mapping and the production of orthophotomaps in each case.
1. ΙNTRODUCTION
Photogrammetry has a long history of successful achievements in 3D recording and documentation. Since the first steps of photogrammetry, unconventional documentation problems could be tackled with the help of remotely taken images in order to achieve 3-dimensional mapping of high accuracy. From that time on, close-range photogrammetry developed innovative and novel tools, techniques, and best practices to handle special and extreme, in some cases, technical problems in 3D mapping. Inaccessibility of monuments, visibility problems, highly oblique images, low texture objects, requirements for multiple resolutions, and restrictions in time and/or budget, inadequate technology etc. are but a few (Lambers et al., 2007; Patias et al., 2008a; Patias et al., 2008b; Remondino, 2011; Roncat et al., 2011; Ruther et al., 2009).
A major technology boost with the introduction of digital images and the universal use of laser scanning, along with the development of new digital image processing techniques, opened up new application frontiers and offered solutions never imagined before. However, scientific curiosity and engineering necessity is as greedy as the technological development. So, alongside with the developments in technology, new scientific and practical demands arose in the 3D modeling research area pushing the needs for new solutions even higher.
The wide menu of realized applications in the vast related literature highly suggests that there is no reason at all to publish just another application. What would be, however, useful instead is a presentation of pitfalls and technical problems one can meet when attempting to push current technology to its limits. In most of the cases, this is due to some scientific engineering specifications imposed either by the object itself (more often) or by the purpose of the mapping (less often). This is the motivation of this publication. During our 3D mapping projects we are often faced by technical challenges, which required innovative solutions. We anticipate that others may benefit from these experiences, that are rarely presented in
published works, which are usually focused on ‘‘success stories’’ minimizing the impact of met irregularities or half-way solutions. Here we present only two examples, of 3D objects that attract the public interest due to their uniqueness, historical value and worldwide visibility.
2. CASE STUDY 1: THE ROUSSANOU MONASTERY IN METEORA, GREECE
2.1 Introduction
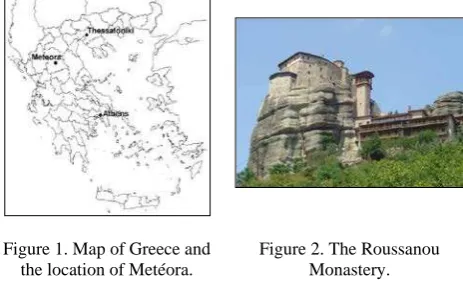
Metéora is one of the largest and most important complexes of
Eastern Orthodox monasteries in Greece (Fig. 1). Metéora is included in UNESCO World Heritage list since 1988 (UNESCO, 2013). The monasteries are perched atop rocky pillars and for that reason there has not been, so far, any metrical documentation of these unique monuments.
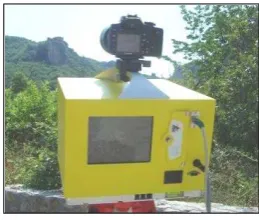
The Roussanou Monastery (Fig. 2), built between 1527 and 1529, is one of the twenty four monasteries of Metéora. The monastery and its natural sandstone rock pillar can only be photographed and measured from a far distance, which was the case for this research study.
Figure 1. Map of Greece and the location of Metéora.
Figure 2. The Roussanou Monastery. ISPRS Annals of the Photogrammetry, Remote Sensing and Spatial Information Sciences, Volume II-5/W1, 2013
The most important issues that we faced during this study were (a) difficulties in accessibility, which led to long measuring distances from the monument, (b) calibration problems concerning the use of long focal length lenses, and (c) geo-reference of images and point clouds, in multiple resolutions, which resulted in huge datasets.
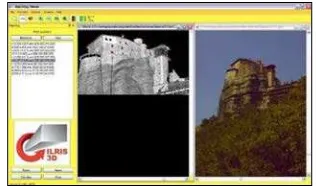
The first stage was the laboratory calibration of the 10 Mp digital camera, equipped with telephoto lens of variable focal length from 70 to 300mm. The second stage was the collection of DSM of the monastery and its rock pillar, at different spatial resolutions, using laser scanning (Fig. 3).
Figure 3. Laser Scanner with telephoto lens camera configuration
2.2 Equipment
The system of the camera and the telephoto lens comprised of the Canon EOS 400D, DSLR camera, and the telephoto lens Sigma (Tab. 1, Fig. 3). The Leica TCR305 geodetic station (Tab. 1) was used for control points measurement and Optech ILRIS36D laser scanner for DSM collection of the monastery and its rock pillar. (Tab. 1, Fig. 3).
Canon EOS 400D
Sensor CCD 10,1Mp
Resolution 3888x2592pixels
Telephoto Lens Sigma
Focal length 70-300mm
Aperture f 4-5.6
Leica TCR305 Angular accuracy 7’’ ή 20cc. Distance measuring without
reflector
500m with accuracy 3mm ± 2 ppm. Laser Scanner ILRIS36D Optech Raw range/positional accuracy,
single shot (100m):
7/8 mm
Scanning density 1.2 mm at 200m
Scanning speed 2,000points/sec
Dynamic range 3 - 1,500m
On-board digital camera 2Mp Table 1. Technical details of the equipment.
2.3 Special problems encountered: Long focal length lens calibration
One of the major problems we encountered was the camera calibration when using the 70-300 mm lens (manual and automatic focus). For the calibration of the camera four different attempts were made using 2 different software (Iwitness, and ShapeCapture) and by applying different approaches.
For the first attempt the Iwitness targets were placed in a makeshift base and the images were taken from a distance of
approximately 10 meters from the target. During the second attempt the Iwitness targets were mounted on a layered metal base (Fig. 4), and the images were taken from a distance of approximately 80-100m from the target. During the third attempt the images of a building were taken from a distance of approximately 600m and control points were used for the calibration. Finally, during the fourth attempt the images of the building were taken from a distance of approximately 400m and control points were also used.
The calibration performed when using the 70 mm lens and manual focus is the only one that gave acceptable results (Tab. 2). The calibration accuracy was 0.17 pixel, which was well within accuracy limits (0,1 - 2,0 pixel) that can be achieved by the software. In addition the quality factor of self-calibration was satisfactory with a value of 1.0. During this stage we were not able to acquire reliable results for the calibration of the 300 mm lens, from the two different types of software we used. More recently, new calibration algorithms and techniques (Stamatopoulos et al., 2010) have been developed that allow the calibration of lens with large focal lengths. It has been realized that existing calibration models exhibit high correlation between different parameters, making their estimation a numerically weak and unstable adjustment problem.
Figure. 4. Image with 70 mm autofocus focal length. The targets of Iwitness software mounted on a
layered metal base c
(mm)
Xp (mm)
Υp
(mm) Κ1 Κ2 Κ3
73,304 0,160 0,532 4.8 10-5 -2.3 10-7 1.0 10-9
Table 2. Results of calibration at 70 mm. 2.4 Fieldwork and site measuring
Four stations (Fig. 5) have been realized in order to capture the Roussanou monastery and its rock pillar. The distance from the monument varied from 190 to 570 m. A detailed view of, distances from the monastery, scan resolution and positions where images have been captured (70mm) are presented in Table 3.
Figure 5. Stations used to capture the Roussanou monastery and its rock pillar.
S
Table 3. Data collection details. 2.4.1 Point Cloud coloring
During the data collection process an external digital camera was used to acquire color information for the point cloud. In order to color the point cloud the Matching Viewer software by Optech has been used and algorithm Boresight - Position Orientation was applied. During the process homologous points between the 3D point cloud and the image were chosen (Fig. 6, Tab. 3), and the image point cloud projection parameters were computed. The cloud was finally colored using the Parser software by applying the calibration file of the resection and to the corresponding image, and scan file.
Initially, the images taken with the internal camera of the laser scanner have been used for the coloring of the 3D points (Fig. 7).
Figure 6. Selecting homologous points for station B.
Figure 7. The colored point cloud of station B using the
internal camera.
Figure 8. The colored point cloud of station B using the camera – zoom lens system.
Station
Table 4. Camera Laser scanner Calibration.
Then, images taken with the 70 mm camera – zoom lens system have been used, with remarkably better results in terms of visual
quality (compare Fig. 7 vs. Fig. 8). The summary table below (Tab. 4) provides the accuracies for the camera laser scanner calibration using the internal camera and the external camera – 70mm lens system that was finally used.
2.4.2 Registration and Modeling
The point clouds of all stations were merged using the IMAlign component of Polyworks software. During the registration stage 3 pairs of homologous points were selected for each overlapping pair of point cloud, providing initial values for the ICP algorithm.
The processing of the final 3D point cloud (10,5 million points) has been performed using Geomagic 10 and can be described as follows:
- manual removal of 3D-points that added noise to the model; - automatic noise reduction;
- adding new points at various locations of the monastery. Finally, the whole model (Fig. 9) consisted of 13 million points (approximately 2,5 million new points have been added).
a. b.
Figure 9. View of the final 3D point cloud of the monastery. However, the large number of 3D points made further processing quite difficult, at the time. For that reason, a uniform sample algorithm has been used to decrease the number of points to 1,3 million without altering the characteristics of the 3D model.
2.4.3 Orthophotomaps Production
The Z-Map software was used for the production of orthoimages (Fig. 10, 11). Images of the facades of the building and calibration parameters of the camera were used as input. A digital elevation model of the building was then created and control points between the elevation models and images of each facade have been selected. For each image the number of control points used, the RMS in cm along the two axis and orthophoto pixel size is presented in Tab. 5
Figure 10. Orthoimage of station C.
Figure 11. Orthomosaic of station B and D.
Table 5. Resection Results for Orthoimage production. ISPRS Annals of the Photogrammetry, Remote Sensing and Spatial Information Sciences, Volume II-5/W1, 2013
3. CASE STUDY 2 : 3D MAPPING OF THE LIMNETIC NEOLITHIC SETTLEMENT OF DISPILIO, GREECE.
PROBLEM DESCRIPTION.
3.1 Introduction
The lakeside Neolithic settlement of Dispilio is located 8 km from Kastoria (West Macedonia, Greece, Fig. 12). Although the archaeological site is known since the 1930s, systematic excavations started in 1992 by the Aristotle University of Thessaloniki. A settlement has been uncovered which dates to the mid-Neolithic period, i.e. the middle of the 6th millennium BC. The aim of the excavations is to study the settlement as a unique cultural system (Chourmouziadis, 2002; Patias et al., 2009). A number of items has been discovered, including ceramics, wooden structural elements, and the remains of wooden walkways, seeds, bones, figurines, personal ornaments, flutes - one of which is the oldest ever found in Europe - and one of the most significant findings, the inscribed tablet. The Dispilio tablet (also known as the Dispilio scripture or the Dispilio disk) is a wooden tablet bearing inscribed markings, unearthed during George Hourmouziadis's excavations of Dispilio and C14-dated to about 5260 BC. The tablet's discovery was announced at a symposium in February 1994 at the University of Thessaloniki (Chourmouziadis, 2002).
a. b.
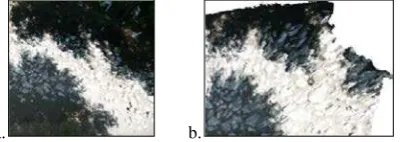
Figure 12. The location of the Neolithic settlement of Dispilio in W. Macedonia, Greece (a) and an aerial view of
the archaeological site (b).
Our assignment is to document the progress of the excavations by producing orthophotomaps of the Neolithic settlement at scales of 1:20 to 1:200. As a result, a detailed study comprising of the 3D documentation of two archaeological trenches, including the mapping of the stratigraphy of their side walls, and the mapping of the settlement’s enclosure that is not visible from above due to dense vegetation, was produced.
For that reason, a UAV-helicopter was used for aerial image acquisition of the two trenches, trench A with dimensions ~25x20m, trench B with dimensions ~15x15m, and the enclosure, which has a length of ~200m and width of 2 to 5m (Fig. 13). For the mapping of the trench B (detailed study of the stratigraphy) and of the enclosure, laser scanning techniques have been also used. Both the UAV system and the laser scanner were equipped with a high resolution digital camera (Patias et al., 2008, Georgoula et al., 2008, Patias et al., 2009). Additionally, a 3m tall wooden platform has been used to acquire oblique terrestrial images (~40ο) for the areas of the enclosure that were covered by the vegetation (Fig. 14). To summarize, the most important issues that we faced during the study were the following: very oblique terrestrial images (enclosure), multiple resolution (stratigraphy profile scanning / aerial mapping) and huge datasets.
Figure 13. The location of A and B trenches and of the
enclosure.
Figure 14. The enclosure and the deck used for the
acquisition images. 3.2 Equipment and used – Data processing
A UAV-helicopter (Tab. 6) capable of autonomous flight, built by AUTH, has been used during the project. In addition, the Optech ILRIS36D, and the Trimble laser scanners have been used for the acquisition of the enclosure’s DSM and a Leica TCR305 geodetic station for the control point measurement. During the data processing stage, Innovmetric Polyworks 11 and Erdas Imagine 9.2 software have been used. Innovmetric Polyworks 11 software provided a number of tools for point cloud registration and three-dimensional model processing. Finally, orthorectified images have been produced using Erdas Imagine 9.0 software.
UAV-helicopter VARIO
Length x width x opening of helix 1.39x0.15x1.53 (m)
Weight 5.1 Kgr
Lifting faculty 1 Kgr
Table 6. UAV technical characteristics. 3.3 Special problems encountered : the enclosure
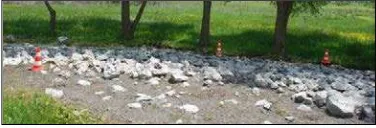
For the collection of the DSM two teams have been formed, each team using a different laser scanner. The resolution of the scans was set to 10 mm. For the full coverage of the project area a total of 71 stations have been realized, 38 using the Optech ILRIS 3D and 33 using the TRIMBLE laser scanner. In order to have distinctive points for the registration procedure traffic cones and tennis balls (Fig. 15) have been used as tie points between different laser scans. Each team started from the edges of the enclosure, and they met at the center of it. The data collection work lasted 5 days and resulted in the collection of 64 millions points.
Figure 15. Traffic cones and tennis balls used for point cloud registration.
3.3.1 Data processing
Innovemetric Polyworks software was used for the registration of different point clouds. For each scan pair we used 3 or more tie points to initialize the ICP algorithm provided by the software. The registration accuracy most of the time was better ISPRS Annals of the Photogrammetry, Remote Sensing and Spatial Information Sciences, Volume II-5/W1, 2013
than 1 cm. The data from each scanner have been individually processed and then merged to form the final point cloud. More specifically 33 scans, acquired by the Trimble scanner, have been processed to form a point cloud of 22 million points, while 38 scans, acquired by the Optech ILRIS 3D scanner, formed a point cloud of 42 million points. Finally the two point clouds were merged to a common point cloud. The following step was to create the 3D (TIN) model of the enclosure with a surface sampling step of 1,5 cm and a maximum triangle length of 30 cm.
During the data processing stage, the most serious problem encountered was the vast amount of data to be processed, which made the whole procedure slow. This is the reason why we decided to process individually each scan and merge them afterwards. Another aspect of the project was that the scans were oblique and from a low height, and as a result the final 3D model had a lot of holes that needed filling, and careful processing.
3.3.2 Orthophoto production
The final stage of the project was the production of the orthoimages of the enclosure. For that reason a deck of approximately 3 m high has been used for image acquisition (fig 14). For the calculation of image orientation a single image resection has been applied using the tennis balls as control points. Although the images were accurately orientated, the created ortoimages were distorted (Fig. 16). The problem that caused the distortions was the high oblique angle of the image capture.
a. b.
Figure 16. Failed effort while creating an orthophoto, a. initial image, b. final orthophoto.
3.4 Solution given
3.4.1 Mapping of the enclosure
The study area consists of two archaeological trenches and the enclosure of the lakeside Neolithic settlement. In the whole area 143 control and check points have been established (Fig. 17). In the first archaeological trench 42 points have been established, in the second trench 24 points and in the enclosure 77 points. These points were tennis balls, stuck with nail in the ground. The points have been distributed properly in order to cover all the study area, both the two trenches and the enclosure, and to be easily identified in all images. The coordinates of these points have been measured with traditional surveying methods, using the reflectorless TCR305 Leica total station with an accuracy of 2cm in both planimetry and height. A survey network consisting of 3 points (Fig. 17) has been established in order to measure the coordinates of these points in the national system (EGSA87).
For the photogrammetric documentation of the study area an autonomous UAV helicopter (Fig. 18), equipped with a digital camera, has been used. The camera mounted to the helicopter was the 10.1 Mpixel Canon EOS D400, which was placed on a special platform in order to eliminate the vibrations of the helicopter and allow the 360o rotation in horizontal and 320o
vertical direction. The camera has been calibrated and the focal length was c=18mm. In order to ensure sufficient image overlap and an overall view of the area, the signal of a video camera, installed on the helicopter, was transmitted to the ground control station via RF and displayed on a monitor.
Figure 17. Distribution of control and check points.
Figure 18. The UAV-helicopter used for image
acquisition.
Figure 19. Orthomosaic of the enclosure.
For the production of the final orthophotos of the two archaeological trenches, and the enclosure at a scale of 1:50, images have been acquired from an average flight height of 8 m corresponding to an average image scale of 1:400.The ground coverage in each image at a scale of 1:800 was 8.88x5.92m. As far as the image processing is concerned, 18 images have been used for the production of the orthophoto (Fig. 19) of the enclosure. All the work has been completed using the software package LPS 9.2 (Leica Photogrammetry Suite. The orthophoto generation process was carried out, applying the single photo resection (SPR), using the DTM of the enclosure that derived from the laser scanner data.A total amount of 77 GCPs have been used in the procedure as control or check points. The final step comprised of orthophoto production for the enclosure which was the most time consuming procedure.
3.4.2 Mapping of the stratigraphy
For the mapping of the stratigraphy the following procedure was applied: First, the trench facades were scanned using the Optech ILRIS 3D laser scanner, then terrestrial photographs were taken and finally the orthophotos were produced. Each trench facade was individually scanned from a distance of approximately 20m with a resolution of 5mm. In Table 7 the number of scans, scan resolutions and the number of points captured for each trench facade, are presented. The scans were ISPRS Annals of the Photogrammetry, Remote Sensing and Spatial Information Sciences, Volume II-5/W1, 2013
processed using the Inovemetric Polyworks software. At first we merged the 2 scans for the North and South trench facade and then we merged all the scans to a final point cloud. Finally the 3d model (TIN model) of the trench was created and processed in order to fill any holes in the model.
Facade Number of
Table 7. Laser scanner measurements.
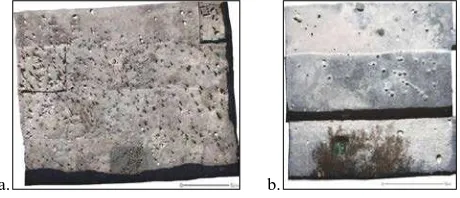
After the scanning, terrestrial photographs were also taken. For the creation of the orthorectified images of the side walls of the two trenches, the Erdas Imagine 9.2 software used the calibration parameters of the camera and the final cloud of the 3D points. The accuracies of the resection solutions were from 0.1 to 0.2mm and the pixel size of all the orthorectified images of the side walls (Fig. 20.a and 20.b) was 0.2 mm, which is sufficient for 1:20 scale mapping.
Figure 20.a. West face of section B.
Figure 20.b. North face of section B. 3.4.3 Mapping of the trenches
The orthorectified images of the archaeological trenches A and B were created using LPS 9.2 software. For this purpose, four overlapping aerial images for trench A and two for trench B were used. In the first archaeological trench 42 points were used, while 24 were used for the second trench. The bundle solution allowed the production of orthorectified images to scale 1:50 (Fig. 21).
a. b.
Figure 21. Orthorectified image of a. trench A, b. trench B. 4. CONCLUSIONS
Regarding the case study of Meteora, the Laser Scanner measurements had a lot of noise in distances greater than 400m, while serious return signal problems arose in distances greater than 600m, mostly due to the dark colored rocks. During our study we only managed to calibrate the telephoto lens for a focal length of 70 mm. Despite the above mentioned calibration problems, using the 70 mm lens photos we managed to create a 3D model of the monastery and its underlying rock with high
spatial resolution and also produce detailed orthophotomaps. As a result we were able to successfully address the access difficulties.
Regarding the case of the archaeological site of Dispilio different approaches for the creation of 3D models and maps were used. During the course of this work, close range photogrammetry and laser scanner techniques along with their combinations were used. For the creation of the 3D model of the enclosure, laser scanner techniques were used producing a DTM with a spatial resolution of 0.5cm. For the creation of the ortho rectified images, a UAV was used to acquire a large number of vertical images from a height of 2-3m. For the mapping of the stratigraphy, a combined laser scanner and close range photogrammetric approached was used leading to the production of a DTM with a spatial resolution of 0.5cm and orthophotos with a resolution of 0.2cm. Finally, for the mapping of trenches A and B, traditional photogrammetric techniques were used using data acquired by the UAV.
REFERENCES
Chourmoziadis G., 2002. Dispilio 7500 years after. University Studio Press, Thessaloniki, Greece.
Lambers, K., Eisenbeiss, H., Sauerbier, M., Kupferschmidt, D., Gaisecker, T., Sotoodeh, S., Hanusch, T., 2007. Combining photogrammetry and laser scanning for the recording and modelling of the Late Intermediate Period site of Pinchango Alto, Palpa, Peru. Journal of Archaeological Science 34(10), pp. 1702-1712.
Patias, P., Georgoula, O., Kaimaris, D., 2009. The Chronicle of the photogrammetric surveys in the Neolithic Lakeside Settlement of Dispilio Kastoria. Excavation Journal Anaskamma 2(1), pp. 81-86.
Patias, P., Geogoula, O., Kaimaris, D., Georgiadis, Ch., Stylianidis, S., Stamnas, A., 2008a. 3D Mapping using Model Helicopter and Laser Scanning: case study activities of the laboratory of Photogrammetry and Remote Sensing, AUTh. 14th International Conference on Virtual Systems and Multimedia (VSMM) dedicated to Cultural Heritage, Nicosia, Cyprus, pp.1-5.
Patias, P., Sylaiou, S., Georgiadis Ch., Georgoula, O., Kaimaris, D., Stylianidis, S., 2008b. 3D mapping of cultural and natural heritage: the case study of the cave of polyphemus cyclope. 14th International Conference on Virtual Systems and Multimedia (VSMM) dedicated to Cultural Heritage, Nicosia, Cyprus, pp.108-113.
Remondino F., 2011. Heritage Recording and 3D Modeling with Photogrammetry and 3D Scanning. Remote Sensing 3(1), pp. 1104-1138, doi:10.3390/rs3061104.
Roncat, A., Dublyansky, Y., Spötl, C., Dorninger, P., 2011. Full-3D Surveying of Caves: A Case Study of Märchenhöhle (Austria). IAMG 2011, Annual Conference of the International Association for Mathematical Geosciences, Mathematical Geosciences at the Crossroads of Theory and Practice, Salzburg, pp. 1393-1403. doi:10.5242/iamg.2011.0074.
Ruther, H., Chazan, M., Schroeder, R., Neeser, R., Held, C., Walker, J., S., Matmon, A., Horwitz, K., L., 2009. Laser scanning for conservation and research of African cultural heritage sites: the case study of Wonderwerk Cave, South Africa. Journal of Archaeological Science 36, pp. 1847-1856. Stamatopoulos, C., Fraser, C. S., Cronk, S., 2010. On the self-calibration of long focal length lenses. International Archives of Photogrammetry, Remote Sensing and Spatial Information Sciences, Vol. XXXVIII, Part 5 Commission V Symposium, Newcastle upon Tyne, UK, pp. 560-564.
UNESCO, 2013. Meteora. http://whc.unesco.org/en/list/455 (01 April 2013).