STATUS AND FUTURE TRANSITION OF RAPID URBANIZING LANDSCAPE IN
CENTRAL WESTERN GHATS
–
CA BASED APPROACH
Bharath Setturu a, b*, Rajan K S b and Ramachandra T V a, c
a Energy and Wetlands Research Group, Centre for Ecological Sciences [CES]
b Lab of Spatial Informatics,International Institute of Information Technology, Gachibowli, Hyderabad 500032, India- [email protected]; [email protected]
c Centre for infrastructure, Sustainable Transportation and Urban Planning [CiSTUP], Indian Institute of Science, Bangalore, Karnataka, 560012, [email protected]
Commission VI, WG VI/4
KEY WORDS: Land use, Vegetation transition, Neighborhood impact, CA-MARKOV, Western Ghats
ABSTRACT:
The land use changes in forested landscape are highly complex and dynamic, affected by the natural, socio-economic, cultural, political and other factors. The remote sensing (RS) and geographical information system (GIS) techniques coupled with multi-criteria evaluation functions such as Markov-cellular automata (CA–Markov) model helps in analysing intensity, extent and future forecasting of human activities affecting the terrestrial biosphere. Karwar taluk of Central Western Ghats in Karnataka state, India has seen rapid transitions in its forest cover due to various anthropogenic activities, primarily driven by major industrial activities. A study based on Landsat and IRS derived data along with CA–Markov method has helped in characterizing the patterns and trends of land use changes over a period of 2004–2013, expected transitions was predicted for a set of scenarios through 2013-2022. The analysis reveals the loss of pristine forest cover from 75.51% to 67.36% (1973 to 2013) and increase in agriculture land as well as built-up area of 8.65% (2013), causing impact on local flora and fauna. The other factors driving these changes are the aggregated level of demand for land, local and regional effects of land use activities such as deforestation, improper practices in expansion of agriculture and infrastructure development, deteriorating natural resources availability. The spatio temporal models helped in visualizing on-going changes apart from prediction of likely changes. The CA-Markov based analysis provides us insights into the localized changes impacting these regions and can be useful in developing appropriate mitigation management approaches based on the modelled future impacts. This necessitates immediate measures for minimizing the future impacts.
1. INTRODUCTION
The land use/land cover (LULC) alterations due to human activities have been affecting the environment at global scale. The LULC changes in mid-20th century have resulted in rapid transitions of forest with crop land expansion (Safriel, 2007) and decline in eco-environment quality of landscape. LULC changes have affected adversely the regional biodiversity through loss of habitat, fragmentation, isolation, and degradation of remaining habitat (Hepinstall et al., 2008). The comprehensive information on land-use changes will facilitate effective land management while enhancing the capability of assessing and predicting future land-use change trends (Veldkamp and Lambin 2001; Verburg and Overmars, 2009). Therefore, an understanding of how the current trajectory of landscape dynamics is essential for local and regional planners to mitigate environmental impacts (Clark et al. 2001; Wimberly and Ohmann, 2004). Models forecasting changes in the landscape are required to address regional issues at global as well as local scales. The modeling of landscape dynamics should focus to mimic large scale global processes as the dynamics of human-nature systems are influenced by larger scale markets and governance that affects the local people and ecosystems far away (Liu et al., 2007).
Modelling and Geovisualisation of landscape dynamics helps in understanding the causes and consequences. Modelling tools are
suitable to make an accurate assessment of impacts on ecosystem with the predict land use changes, to get a better knowledge of the drivers behind it (Haase and Schwarz, 2009) and also its potential impacts. Biophysical features such as percent steep slope or wetlands, topography (Schneider and Pontius, 2001), distance to roads and central business districts/markets (Turner et al., 1996), proximity to residential areas (Schneider and Pontius, 2001) are important predictors of land cover changes in modelling. Recent studies have also found that land use configuration (van Eck and Koomen, 2008) and neighboring land use (Hagoort et al., 2008) have an effect on land use dynamics. The modelling of landscape changes focuses on analysing the biophysical, socio-economic context at multiple scales, visualising and quantifying the potential effects of land use changes to support policy makers in their decision making process. The wide range of land use change models already exist, ranging from specific case studies to generic tools (Bell, 2001; Batty et al., 2003; Sheppard and Meitner, 2005; Nole et al., 2013; Larocque et al., 2014), differing in terms of their structure, representation in space, time, human decisions, and also in methodological implementation (Haase and Schwarz, 2009). The remote sensing techniques for identifying land uses, measuring the biophysical properties of ecosystems and detecting environmental change will be effective by integrating with existing ecological data. The temporal remote sensing data
available from 1970’s provide opportunities for sustainable
Cellular Automata (CA) with Markov approach has been widely applied for land use assessment and future prediction. CA with Markov makes analyses more powerful in the utilization of land use dynamics (Xin et al.,2012; Arsanjani et al., 2013; Riccioli et al., 2013), as it can assess probability parameters related to Transitional Probability Matrix, Transitional Area Matrix, and Markov factors. The specification of transition rules is the most essential part of a CA model to obtain realistic simulations of land use and land cover change, which helps in complicated decision-making process (Verburg et al. 2004; Moreno et al., 2009). A central concern of CA is the validity of the neighbourhood rules, which specify the behavior of land-uses (Sui and Zeng, 2001; Hansen, 2012), while it is noted that the combined effects of spatial externalities, in the sense of mutual attraction and repulsion of land-use types, average out over the region if chosen appropriately. If these rules are defined and calibrated on an ad-hoc basis by trial and error methods, the model results will be ambiguous (Hagoort et al., 2008). CA– Markov model accomplishes the contiguity rule, which simulates the growth of a land use class near to the existing similar land use (Kamusoko et al., 2009) except at the border.
This paper aims at the study and assessment of Land use changes in the Karwar taluk, a region within the Western Ghats ecological region. The objectives of this analysis is to (i) identify the temporal changes between the period 2004-2013, (ii) find out the key neighbourhood effects that influence the processes of land use change, primarily Urbanization in this region and how their net intensity can influence the high forested landscape, (iii) visualization of landscape in 2022 by incorporation of previous land use extents and course of these locational interaction.
2. MATERIALS AND METHOD
2.1 Study area
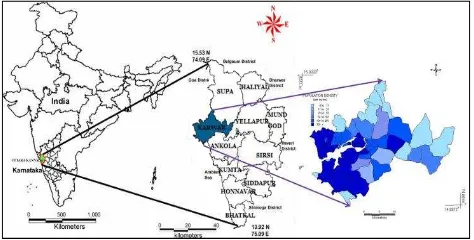
Karwar taluk is the coastal taluk of Uttara Kannada district in Karnataka (Figure 1). The taluk has Arabian Sea in the west side and the Western Ghats on the eastern side. Karwar town is the administrative headquarters of Uttara Kannada district, lies about 15 kilometers south of the Karnataka-Goa border. The taluk has a population of 153165 and population density is accounted to be 206 persons/sq.km. In Karwar taluk, as one goes from west to east the forest types gradually change from laterite thorn, deciduous to moist deciduous and laterite semi-evergreen to evergreen. The deciduous forests in lower slopes tend to be towards high forests, yielding valuable timber, the upper slopes and lower valleys and banks of perennial streams contain patches of evergreen forests.
Karwar taluk forest’s major portion is part of the conservation reserve Anshi-Dandeli Tiger Reserve (ADTR), showing the ecological sensitiveness of the region.
Figure 1. Study area-Karwar taluk.
The Karwar region displays high economic development and a high density of population. A little to the south, Kali river joins the Arabian Sea, forming an estuary and supporting fishing activity. The Karwar town is situated in the Kali river basin, the port of Karwar is always active as a result of mining activity in the district and nearby districts. The taluk has two major hydro-electric projects on Kodasalli dam and theKadra dam on Kali river. The Kaiga Nuclear power project is situated in thick primeval evergreen forest. The Sea Bird project of Navy has added one more dimension to this place. All these cascading developmental projects have driven the unplanned growth in the district causing serious threat to flora, fauna and also rise in land surface temperature (Bharath et al., 2013), flash floods. The taluk is rich in minerals such as iron, lime-stone, manganese, bauxite, molluscan shells etc., the total mining area reported to be 148.94 sq.km causing various disturbances to the ecosystem, soil erosion by runoff causing damage to forests, agriculture and rivers. 2.2 Method
Method followed in the analysis is out lined in the Figure 2. The analysis involves (i) data collection and preprocessing, (ii) land use analysis, (iii) modelling and prediction.
Figure 2. Method used in the analysis.
ancillary data includes land cover maps, administration boundary details, transportation data (road network) and field data using GPS (Global Positioning System – Garmin GPS). The raw satellite data are geo-corrected, followed by radiometric correction and resampled to 30 m resolution to maintain common resolution for multi temporal data comparisons and geo-visualisation.
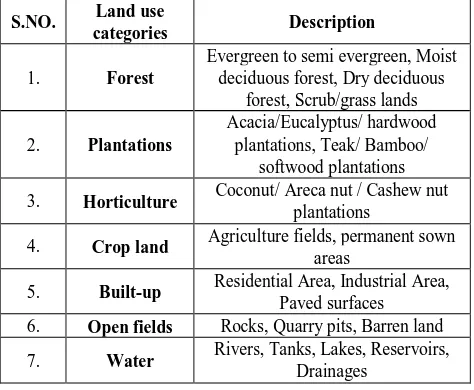
2.2.2 Temporal Land use analysis: The temporal land use analysis was carried out by using supervised classification scheme of Gaussian maximum likelihood classifier under 7 different land use classes as shown in Table 1. The field data (65%) covering various land use categories was used for training and rest used for validation. To classify earlier time-period data, training polygon along with attribute details were compiled from the historical published topographic maps, French Institute vegetation maps, revenue maps, land records available from local regulatory authorities, etc. Land use analysis was carried out by using free and open source GIS software GRASS- Geographic Resource Analysis Support System, providing robust support for vector and raster data processing (http://wgbis.ces.iisc.ernet.in/grass/). Improvements in the development of free and open source software have emerged as an alternative economical approach for a wide range of applications with multiple data formats (Bharath et al. 2012). An accuracy assessment is performed to validate the classification, which is a statistical assessment that decides the quality of the information derived from remotely sensed data considering reference pixels. These test samples are then used to create the error matrix (also referred as confusion matrix) kappa (κ) statistics and overall (producer's and user's) accuracies to assess the classification accuracies (Lillesand et al., 2004).
S.NO. Land use
categories Description
1. Forest
Evergreen to semi evergreen, Moist deciduous forest, Dry deciduous
forest, Scrub/grass lands 2. Plantations
Acacia/Eucalyptus/ hardwood plantations, Teak/ Bamboo/
softwood plantations 3. Horticulture Coconut/ Areca nut / Cashew nut
plantations
4. Crop land Agriculture fields, permanent sown areas
5. Built-up Residential Area, Industrial Area, Paved surfaces 6. Open fields Rocks, Quarry pits, Barren land 7. Water Rivers, Tanks, Lakes, Reservoirs,
Drainages Table 1. Land use categories of Karwar taluk
2.2.3 Modelling and prediction: The temporal land use analysis has provided spatio-temporal patterns, which satisfies the properties of Markovian process. Markovian process is a random process, defines suitability of state as a weighted linear sum of a series of affecting factors, normalized to values in the range of 0– 1. The neighbourhood influence area is thus calculated as summed effect of each transitional potential and its interaction with its neighbors and the transition rules were determined by various
demands of the land use classes, population growth etc. The two temporal land use analysis maps were used to account for the stable and transformed land use classes which satisfy non-transition properties such as urban class to water or vice versa. The transition probability map and area matrix are obtained based on probability distribution over next state of the current cell that is assumed to only depend on current state (Equations 1 & 2). CA was used to obtain a spatial context and distribution map which defines the state of the cell based on the previous state of the cells within a neighbourhood, using a set of transition rules. CA has a potential for modelling complex spatio-temporal processes that made up of elements represented by an array of cells, each residing in a state at any one time, discrete number of class (states), the neighbourhood effect and the transition functions, which define what the state of any given cell is going to be in the future time period. The net neighbourhood influences were determined by 5×5 contiguity filter which explains past land use changes and used to simulate future changes. CA filter creates spatial weights according to the distance of the neighboring territory from the cell to determine changes in the cellular status. The explanatory power of the neighbourhood rules that were derived are assessed by calibration and validation of the CA land use model. The CA coupled with Markov chain land use predictions of 2010 and 2013 were made by using the transitional probability area matrix generated from 2004-2007; 2007-2010 respectively. The validity of the predictions was made with the reference land use maps of 2007 and 2010. Based on these validations the model outputs were then visualized for 2022 by considering similar time interval.
The original transition probability matrix (denoted by P) of land use type has been obtained from two former land use maps.
(1)
Where P(N)=state probability of any time, P(N−1)=preliminary state probability. Transition area matrix can be obtained by,
[
] (2)
Where A=the transition area matrix,
Aij= the sum of areas from the ith land use class to the jth class during the years from start point to target simulation periods, N = land use type.
3. RESULTS
3.1. Land use analysis
major industries, etc.) and inappropriate management has led to imbalances in the ecosystem, evident from series of landslides in the district. The agriculture and deforestation took place at the expense of the irreversible losses of forest cover which has led to the losses of vital ecosystem goods and services ranging from biodiversity to regulation of hydrological cycle. It is also evident that the increase in plantation of exotic species such as Acacia auriculiformis, Casuarina equisetifolia, Eucalyptus spp., and Tectona grandis has led to removal of primeval forest cover. The field data and Google earth data sets are used for analysing accuracy of classification and the accuracy assessment was included in Table 3, shows Producer Accuracy (PA), User Accuracy (UA), Kappa, Overall Accuracy values. This approach has provided us more consistent results. The areas of each category are also verified with available administrative reports, statistical department data and forest division annual reports.
Category Actual Land use (Hectares)
2004 2007 2010 2013
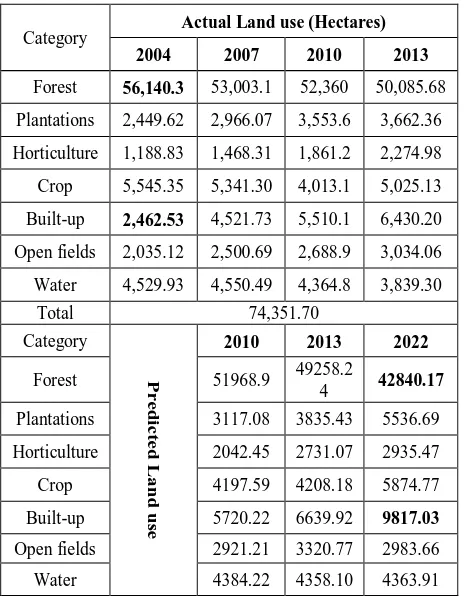
Forest 56,140.3 53,003.1 52,360 50,085.68 Plantations 2,449.62 2,966.07 3,553.6 3,662.36 Horticulture 1,188.83 1,468.31 1,861.2 2,274.98 Crop 5,545.35 5,341.30 4,013.1 5,025.13 Built-up 2,462.53 4,521.73 5,510.1 6,430.20 Open fields 2,035.12 2,500.69 2,688.9 3,034.06 Water 4,529.93 4,550.49 4,364.8 3,839.30
Forest 51968.9 49258.2
4 42840.17
Plantations 3117.08 3835.43 5536.69 Horticulture 2042.45 2731.07 2935.47
Crop 4197.59 4208.18 5874.77
Built-up 5720.22 6639.92 9817.03 Open fields 2921.21 3320.77 2983.66
Water 4384.22 4358.10 4363.91
Table 2. Land use changes from 2004 to 2022.
Year 2004 2007 2010 2013
Table 3. Accuracy assessment from 2004 to 2013.
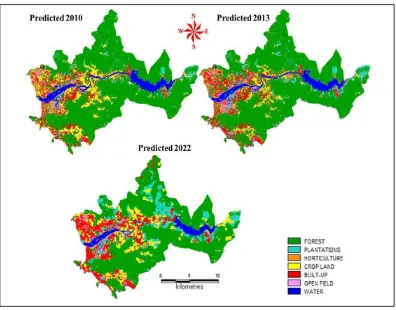
Figure 3. Land use analysis of Karwar taluk actual and predicted.
3.2 Geo-visualisation and prediction
Land use transitions with respect to each category were calculated to predict land use for 2010, using Markov chain process based on 2004 and 2007 land use and CA loop time of 3 years, and was continued for 2013 by using 2007, 2010 land use maps. The transition probability as shown in Table 4 (a, b), with the knowledge of 2004-2007, 2007-2010 and 2010-2013 for 2022 is predicted under different conditions (i.e. transition rules, iteration numbers). This prediction has been done considering water bodies as a constraint and assumed to remain constant over all time frames. The model was analyzed for allowable error by validating the predicted versus the actual for the years 2010 and 2013 land use maps shown in Figure 5. The validation results showed in Table 5 provides a very good agreement between the actual and predicted maps of 2010, 2013 land use with kappa of 0.84 and 0.83. The Kappa-standard index of optimum point as well as Kappa-location index was computed and they show a significant correlation between the simulated and the actual maps.
Index Predicted 2010 Predicted 2013
Kno 0.90 0.89
Klocation 0.86 0.87
Kstandard 0.84 0.83
Figure 4. Temporal land use from 2004-2013.
Given Probability of changing to
Table 4(a). Transition probability matrix for 2007-2010.
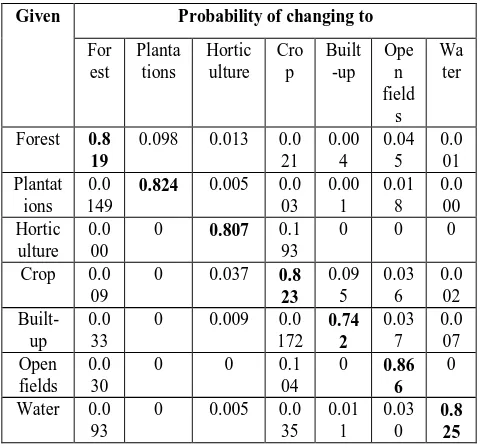
Given Probability of changing to
For
Table 4(b). Transition probability matrix for 2010-2013. The simulated land use (Table 2, Fig.5) shows likely increase in built up from 3.31 % (2004) to 13.20% (2022). The process of urbanization is observed to be high in the areas near project Sea bird, Kaiga power house and the national/state highways. The analysis highlighted the decline of forest cover from 75.51 (2004) to 57.62% (2022) with increase in monoculture plantations from 3.29% to 7.45%. The natural vegetation being replaced by the plantation activities in recent time also indicates their further growth in future years. The taluk has witnessed changes within and in the neighbourhood due to the introduction of major developmental projects that has led to rapid urbanisation. The adverse effects of ad-hoc approaches in the developmental activities have led to landslides, higher erosion of top soil, etc.. This necessitates comprehensive land use management focusing on restoration of ecosystems to mitigate the impacts further. Analysis and comparison of the simulated and actual land-use maps of 2022 reveal that the CA–Markov model has provided
insights in terms of change quantification and continuous-space change modelling.
4. CONCLUSION
The temporal change in the forested landscape is assessed with help of remote sensing data significantly identifying the change trajectories. The forest cover has changed from 75.51 (2004) to 67.36% (2013) and paved surfaces have reached to 8.65% (2013). The unplanned developments, construction of hydro projects, Kaiga nuclear projects, Project Sea bird etc. have contributed to the decline of forest cover. Geo-visualisation indicates landscape composition and configuration changes. CA Markov analysis was able to effectively simulate land use changes based on the dynamic simulation capability and simple calibration of complex patterns. However, CA Markov model is limited by its capacity to incorporate human decision making, any environmental and socio-economic variables of driving factors affecting the region over time. Recently, multi-agent models combining knowledge and tools from biophysical and socio-economic sciences have been developed to simulate land conversions through considering the behaviour of the existing agents, as well as other actors. The major impacts of intensive commercial usage of forests should be controlled by regulatory authorities, which will help to maintain sustainable use of resources than exploiting. The information generated in this study will help in analysing underlying causes of change and designing management strategies, as it identifies the spatio-temporal patterns associated with landscape processes that affect policy making, conservation and restoration programs.
5. ACKNOWLEDGEMENT
We are grateful to the Ministry of Environment & Forests, the Ministry of Science and Technology (DST), Government of India, Karnataka Biodiversity Board, Western Ghats Task Force, Government of Karnataka and Indian Institute of Science for the financial and infrastructure support.
6. REFERENCES
Arsanjani, J.J., Helbich, M., Kainz, W., Darvishi, A., 2013. Integration of logistic regression, Markov chain and cellular automata models to simulate urban expansion - the case of Tehran. International Journal of Applied Earth Observation and.Geoinformation, 21, pp. 265-275.
Batty, M., Jake D., Duxbury, E., 2003. The discrete dynamics of small-scale spatial events: agent-based models of mobility in carnivals and street parades. International Journal of Geographical Information Science, 17 (7), pp. 673-697.
Bharath, S., Rajan, K.S., Ramachandra, T.V., 2013. Land Surface Temperature Responses to Land Use Land Cover Dynamics. Geoinformatics Geostatistics: An Overview, 1(4).
Bell, S., 2001. Landscape pattern, perception and visualisation in the visual management of forests. Landscape and Urban planning, 54(1), pp. 201-211.
Clark, J.S., Carpenter, S.R., Barber, M., et al., 2001. Ecological forecasts: an emerging imperative. Science, 293, pp. 657–660. Haase, D., Schwarz, N., 2009. Simulation models on human-nature interactions in urban landscapes–a review including system dynamics, cellular automata and agent-based approaches. Living Reviews in Landscape Research, 3, 2.
Hagoort, M., Geertman, S., Ottens, H., 2008. Spatial externalities, neighbourhood rules and CA land-use modelling. Ann Reg Sci, 42, pp.39–56.
Hansen, H.S., 2012. Empirically derived neighbourhood rules for urban land use modelling. Environment and Planning, 39(2), pp. 213–228.
Hepinstall, J.A., Alberti, M., Marzluff, J.M., 2008. Predicting land cover change and avian community responses in rapidly urbanizing environments. Landscape Ecology, 23(10), pp. 1257-1276.
Kamusoko, C., Aniya, M., Adi, B., Manjoro, M., 2009. Rural sustainability under threat in Zimbabwe – Simulation of future land use/cover changes in the Bindura district based on the Markov-cellular automata model. Applied Geography, 29 (3), pp. 435-447.
Larocque, G.R., Bhatti, J., Arsenault, A., 2014. Integrated modelling software platform development for effective use of ecosystem models. Ecological Modelling, 288, pp. 195-202. Lillesand, T.M., Kiefer, R.W., Chipman, J.W., 2004. Remote Sensing and Image Interpretation. John Wiley and Sons, New York.
Liu, J., Dietz, T., Carpenter, S.R., Alberti, M., Folke, C., Moran, E., Pell, A.N., Deadman, P., Kratz, T., Lubchenko, J., Ostrom, E., Quyang, Z., Provencher, W., Redman, C.L., Schenider, S.H., Taylor, W.W., 2007. Complexity of Coupled Human and Natural Systems, Science, 317, pp. 1513-1516.
Nole Gabriele, Rosa Lasaponara, Beniamino Murgante., 2013. Applying spatial autocorrelation techniques to multi-temporal satellite data for measuring urban sprawl. International Journal of Environmental Protection, 3 (7), pp. 11-21.
Ramachandra, T.V., Setturu Bharath and Aithal Bharath., 2014. Spatio-temporal dynamics along the terrain gradient of diverse landscape, Journal of Environmental Engineering and Landscape Management, 22 (1), pp. 50-63.
Safriel, U.N., 2007. The assessment of global trends in land
degradation. In: Sivakumar MVK, Ndiang’ui (eds) Climate and
Land Degradation, Springer, pp. 1–38.
Schneider, L.C., Pontius, R.G.Jr., 2001. Modelling land-use change in the Ipswich Watershed, Massachusetts, USA. Agriculture Ecosystem and Environment, 85, pp. 83–94. Moreno, N., Wang, F., and Marceau, D.J., 2009. Implementation of a dynamic neighbourhood in a land-use vector-based cellular automata model. Computers, Environment and Urban Systems, 33 (1), 44–54.
Sheppard, S.R., Meitner, M., 2005. Using multi-criteria analysis and visualisation for sustainable forest management planning with stakeholder groups. Forest Ecology and Management, 207 (1), pp. 171-187.
Sui, D.Z., Zeng, H., 2001. Modelling the dynamics of landscape
structure in Asia’s emerging Desakota regions:a case study in
Shenzhen. Landscape Urban Planning, 53(1–4), pp. 37–52. Turner, M.G., Wear, D.N., Flamm, R.O., 1996. Land ownership and land-cover change in the southern Appalachian highlands and the Olympic peninsula. Ecological Applications, 6, pp. 1150– 1172.
van Eck, J.R., Koomen, E., 2008. Characterising urban concentration and land-use diversity in simulations of future land use. Ann Reg Sci 42:123–140. doi:10.1007/s00168-007-0141-7. Veldkamp, A., Lambin, E.F., 2001. Predicting land-use change. Agriculture Ecosystems and Environment, 85(1-3), pp. 1-6. Verburg, P.H., De Nijs Ton, C.M., Van Eck, J.R., Visser, H., De Jong, K., 2004. A method to analyse neighbourhood characteristics of land use patterns. Computers, Environment and Urban Systems, 28, pp. 667–690.
Verburg P.H., Overmars, K., 2009. Combining top-down and bottom-up dynamics in land use modelling: exploring the future of abandoned farmlands in Europe with the Dyna-CLUE model. Landscape Ecology, 24:1167-1181.