DECISION LEVEL FUSION OF LIDAR DATA AND AERIAL COLOR IMAGERY
BASED ON BAYESIAN THEORY FOR URBAN AREA CLASSIFICATION
H. Rastiveis*
a School of Surveying and Geospatial Engineering, Faculty of Engineering, University of Tehran, Tehran, Iran, [email protected]
KEY WORDS: High Resolution LiDAR Data, Naïve Bayes Classifier, Decision Level Fusion, Classification
ABSTRACT:
Airborne Light Detection and Ranging (LiDAR) generates high-density 3D point clouds to provide a comprehensive information from object surfaces. Combining this data with aerial/satellite imagery is quite promising for improving land cover classification. In this study, fusion of LiDAR data and aerial imagery based on Bayesian theory in a three-level fusion algorithm is presented. In the first level, pixel-level fusion, the proper descriptors for both LiDAR and image data are extracted. In the next level of fusion, feature-level, using extracted features the area are classified into six classes of “Buildings”, “Trees”, “Asphalt Roads”, “Concrete roads”, “Grass” and “Cars” using Naïve Bayes classification algorithm. This classification is performed in three different strategies: (1) using merely LiDAR data, (2) using merely image data, and (3) using all extracted features from LiDAR and image. The results of three classifiers are integrated in the last phase, decision level fusion, based on Naïve Bayes algorithm. To evaluate the proposed algorithm, a high resolution color orthophoto and LiDAR data over the urban areas of Zeebruges, Belgium were applied. Obtained results from the decision level fusion phase revealed an improvement in overall accuracy and kappa coefficient.
1. INTRODUCTION
Airborne Light Detection and Ranging (LiDAR) generates high-density 3D point clouds to provide a comprehensive information of object surfaces. Recently, the use of LiDAR data has increased in many applications, such as 3D city modeling and urban planning. Although the spatial resolution of this data has intensely improved, however, the lack of spectral and textural information is still a big problem of LiDAR technology. On the other hand, high resolution aerial/satellite imageries offer very detailed spectral and textural information but poor structural information. Therefore, LiDAR data and aerial/satellite imagery are complementary to each other and, combining them is quite promising for improving land cover classification (Lee et al., 2008; Li et al., 2007; Pedergnana et al., 2012; Rottensteiner et al., 2005; Schenk and CsathA, 2002).
Many methods for fusion of LiDAR data and multispectral aerial/satellite image have been proposed by researchers, in recent years(Li et al., 2013; Malpica et al., 2013; Schenk and CsathA, 2002; Sohn and Dowman, 2007; Trinder and Salah, 2012; Yousef and Iftekharuddin, 2014). The majority of these studies have applied aerial image instead of satellite image as a complementary of LiDAR data. Moreover, there are a number of researches fused hayper-spectral image and LiDAR data for different applications(Bigdeli et al., 2014; Dalponte et al., 2008). Here, a few number of these studies are briefly discussed.
Bigdeli et al. (2014) addressed the use of a decision fusion methodology for the combination of hyperspectral and LIDAR data in land cover classification. The proposed method applied a support vector machine (SVM)-based classifier fusion system for fusion of hyperspectral and LIDAR data in the decision level. First, feature spaces are extracted from LIDAR and hyperspectral data. Then, SVM classifiers are applied on each feature data. After producing several of classifiers, Naive Bayes as a classifier fusion method combines the results of SVM classifiers from two data sets. The results discovered that the overall accuracies of
* Corresponding author
SVM classification on hyperspectral and LIDAR data separately were 88% and 58% while the decision fusion methodology receive the accuracy up to 91%(Bigdeli et al., 2014).
An analysis on the joint effect of hyperspectral and light detection and ranging (LIDAR) data for the classification of complex forest area based on SVM algorithm is proposed in (Dalponte et al., 2008).
Hong et al. (2009) proposed a fusion method by fusing the LiDAR points with the extracted points from image matching through three steps: (1) registration of the image and LiDAR data using the LiDAR data as control information; (2) image matching using the LiDAR data as the initial ground approximation and (3) robust interpolation of the LiDAR points and the object points resulted from image matching into a grid(Hong, 2009).
Zabuawala et al. (2009) proposed an automated and accurate method for building footprint extraction based on the fusion of aerial images and LiDAR. In the proposed algorithm, first initial building footprint was extracted from a LiDAR point cloud based on an iterative morphological filtering. This initial segmentation result was refined by fusing LiDAR data and the corresponding colour aerial images, and then applying the watershed algorithm initialised by the LiDAR segmentation ridge lines on the surface were founded(Zabuawala et al., 2009).
The fusion of aerial imagery and LiDAR data has been proposed to improve the geometrical quality of the building outlines (Rottensteiner et al., 2005). They are also applied to improve planar segmentation due to the complementary of these data sources (Khoshelham et al., 2008).
In this paper, a multi-level fusion technique is proposed for land cover classification using LiDAR data and aerial imagery. This method is performed through four consecutive phases: pre-processing, pixel-level fusion, feature-level fusion and decision level fusion.
2. NAÏVE BAYES FUSION METHOD
The Bayesian algorithm combines training data with a priori information to calculate a posteriori probability of a hypothesis. So, the most probable hypothesis according to the training data is possible to figure out. The basis for all Bayesian Learning Algorithms is the Bayes Rule which is Equation 1.
( | ) ( ) calculateP(x | w )i j . A priori probability may also be calculated based on the size of the training data in each class. Estimated posterior probability in each classification may also be applied in decision level fusion. In this case, one can calculate a priori information of each classification using its resulted confusion matrix.
3. HIGH RESOLUTION LIDAR AND IMAGE FUSION
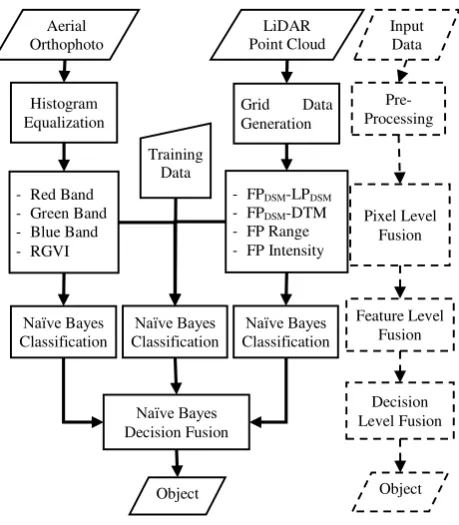
The proposed method for fusion of high resolution LiDAR data and aerial orthophoto is based on the flowchart shown in Fig. 1. First, in a pre-processing step, conversion of LiDAR point cloud into grid form and contrast enhancement of the orthophoto are performed. Then, classification of the area is executed in three sequential fusion levels: pixel level fusion, feature level fusion, and decision level fusion.
As seen in Fig. 1, in pixel level fusion useful descriptors are calculated from both LiDAR and image. After that, extracted features are applied for classification of the area in three different strategies: (1) using merely LiDAR data, (2) using merely image data, (3) using all extracted features from LiDAR and image. Finally, all the classification results from these implementations are used in decision level fusion for making last decision about the pixels. Further details of the proposed method are described in the following sections.
Figure 1. Flowchart of the proposed method
3.1 Pre-Processing
In the pre-processing phase, to simplify the process and, ability to deal with the LiDAR data as an image, irregular 3D point cloud is converted into regular form using interpolation techniques. Although, the interpolation process may cause the loss of information, however, it is negligible in this paper. Note, it is assumed that LiDAR data and aerial image are accurately registered. Moreover, histogram equalization of the color orthophoto is performed due to its effectiveness on contrast enhancement.
3.2 Pixel Level Fusion
The aim of pixel-level phase is to generate the proper descriptors for both data. In this step, eight descriptors are extracted on LiDAR data (four features) and aerial image (four features). These features are selected based on the previous literatures of LiDAR or aerial image classification (Bigdeli et al., 2014; Li et al., 2007). For example, “the height differences between the first pulse range and DTM “to distinguish buildings and trees from other objects and, also, “the height differences between the first pulse and the last pulse” to distinguish tree class from other classes can be seen in several studies (Bigdeli et al., 2014; Li et al., 2007; Rottensteiner et al., 2005). These descriptors can be calculated using equations 4 and 5. “First pulse range” and “First pulse Intensity” are the other descriptors which are extracted considered for classification. Here, therefore, only GRVI feature is calculated through pixel level fusion of Red and Green channels. Same as NDVI in remote sensing data analyses, GRVI
Aerial The International Archives of the Photogrammetry, Remote Sensing and Spatial Information Sciences, Volume XL-1/W5, 2015
may help to distinguish vegetation area from other objects. Equation 6 shows the fusion formula for calculating this feature.
R G
R -G GRVI
(6)
3.3 Feature Level Fusion
In the feature-level fusion phase, the area are classified into six classes of “Buildings”, “Trees”, “Asphalt Roads”, “Concrete roads”, “Grass” and “Cars” using aforementioned extracted features from LiDAR and image data. Training and check data set of each class are manually selected for the classification.
Three different classifiers are implemented in this level. (1) a classifier which merely used LiDAR data, (2) a classifier which merely used image data, (3) a classifier that applied all extracted features from LiDAR and image data.
Although in Naïve Bayes classifier as a soft classifier membership degrees of each pixel to the classes are calculated, here, only one class with higher degree of membership (maximum probability), which is shown in Equation 2, is selected. However, the degree of membership to the classes are kept to be used in the next phase of the algorithm, which will be described in the following section.
3.4 Decision Level Fusion
In this step, three previous classification results are integrated for making final decision about a pixel. There are different decision fusion techniques in pattern recognition literature such as Simple Voting, Weighted Voting, Rule Based Fuzzy System, Dempster-Shafer and Naïve Bayes. Voting and Weighted Voting algorithms can be applied for fusing crisp classification results while other methods would be able to integrate soft classification results.
In this paper, the decision level fusion is implemented based on Bayesian theorem. For this purpose, Naïve Bayes provides a method for computing the a posteriori degree of membership, based on previous estimated degrees. In the resulted a posteriori
degrees of membership of each pixel to the classes, the maximum degree can be considered as the final class label. Here, resulted confusion matrix for each classifier can be applied to estimate a priori probability of each class.
4. EXPERIMENT AND RESULTS 4.1 Dataset
To evaluate the proposed algorithm, high resolution color orthophoto and LiDAR data over the urban areas of Zeebruges, Belgium were applied. The point density for the LiDAR sensor is approximately 65 points/m² and the color orthophoto were taken at nadir and have a spatial resolution of approximately 5 cm. From this data set a building block which included 1.03 million points was cropped as sample data. Selected area as a test data is depicted in Figure 2.
a
b
Figure 2. Study area. a. High resolution aerial orthophoto. b. High resolution LiDAR point cloud.
4.2 Results
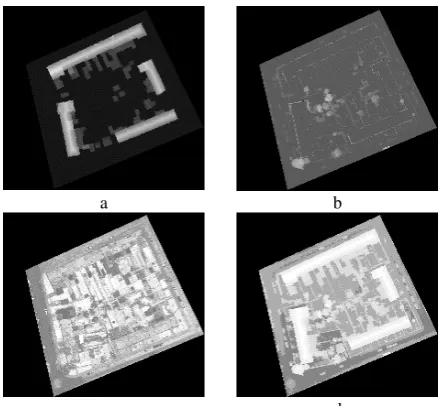
After generating regular LiDAR data with 5 cm spatial resolution from point cloud, and contrast enhancing of the orthophoto, in the pre-processing step, the features for both LiDAR and orthophoto were extracted. These features from LiDAR data and orthoimage are displayed in Figure 3 and 4, respectively.
a b
c d
Figure 3. Extracted Features for LiDAR data. a. difference between last pulse and DTM. b. difference between first and last pulse range. c. First pulse intensity. d. First pulse range. The International Archives of the Photogrammetry, Remote Sensing and Spatial Information Sciences, Volume XL-1/W5, 2015
a b
c d
Figure 4. Extracted Features of orthophoto. a. Red channel. b. Green channel. c. Blue channel. d. NDGI.
Sample data collection is the next step after feature extraction. In this case, as all the evaluation parameters are computed based on these samples, here, a huge number of sample data were collected. The collected sample data were divided into two groups of training and check data for calculating the probability density functions and confusion matrix, respectively. In this study, 421515 sample pixels were collected and 266156 and 155359 sample pixels were collected as training and check data, respectively. Selected samples are shown in Figure 5.
Figure 5. Manually observed sample data.
After collecting sample data, Naïve Bayes classifiers were designed and executed on the sample data set in three different strategies. Naïve Bayes classifier is a soft classification technique and results degree of memberships for each pixel in different classes. In this case, the class with higher degree of membership (maximum probability) is selected for a pixel. The obtained classification results and corresponding confusion matrix can be seen in Figures 6-8. However, the degree of membership to the classes were kept to be used for decision level fusion.
Figure 6. Obtained results from Bayesian classifiers based on merely orthophoto.
Figure 7. Obtained results from Bayesian classifiers based on merely LiDAR feature space.
Figure 8. Obtained results from Bayesian classifiers based on LiDAR and image feature space.
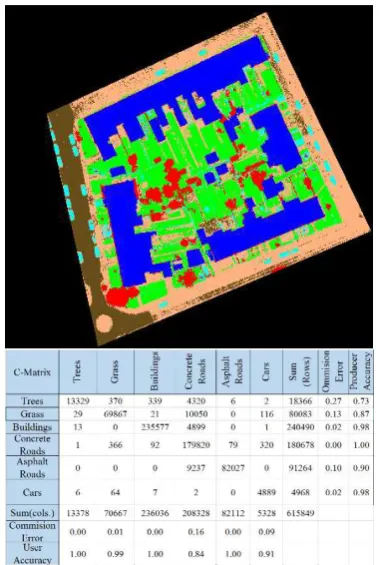
The results of three classification algorithm were finally integrated based on Naïve Bayes data fusion algorithm. Final classification results is shown in Figure 9. As can be seen from the figure, the confusion matrix obtained from fusion of previous classification presents more promising results.
Figure 9. Final obtained classification from decision level fusion.
4.3 Discussion
Among the obtained three classifier in feature level fusion, the one which simultaneously used both LiDAR and Image features presented better results. Furthermore, fusing the three classification through Naïve Bayes classifier fusion method proved an improvement in classification results. Figure 10 shows resulted overall accuracy and kappa coefficient for all the classifications. As can be seen from the figure, the best performance was achieved for final decision level fusion while obtained results from merely image features was dispiriting. The performance of the classifier which used merely image features in detecting trees and cars classes was very disappointing. Low values of user accuracies for these classes in Figure 6 proved this.
The overall accuracy and kappa coefficient of the classifier which used merely LiDAR features is approximately the same as the one which used all LiDAR and Image features. However, it is seen in Figure 7 that lack of spectral information in LiDAR data causes mixing grass, asphalt roads and concrete roads classes, especially in south-eastern part of the test area.
Moreover, as previously reported in researches multiple data resources obtained more promising results in comparison with each data resource individually(Bigdeli et al., 2014).
Figure 10. Comparison between classification results.
5. CONCLUSION
In this paper, fusion of high resolution aerial orthophoto and LiDAR data based on Naïve Bayesian algorithm were discussed. Three different classification were designed using training data set: (1) using merely LiDAR data, (2) using merely image data, (3) using all extracted features from LiDAR and image. The results of these classification were integrated using Naïve Bayes algorithm. Among all the classification results, the results of final decision fusion were the best.
Although the features and number of classes have important roles in classification, it is theoretically expected that the same results would be achieved for different feature spaces and number of classes. However, it is recommended to test the algorithm for other case studies. It is also suggested to test other decision fusion algorithm such as fuzzy inference system.
REFERENCES
Bigdeli, B., Samadzadegan, F., Reinartz, P., 2014. A decision fusion method based on multiple support vector machine system The International Archives of the Photogrammetry, Remote Sensing and Spatial Information Sciences, Volume XL-1/W5, 2015
for fusion of hyperspectral and LIDAR data. International Journal of Image and Data Fusion 5, 196-209.
Dalponte, M., Bruzzone, L., Gianelle, D., 2008. Fusion of hyperspectral and LIDAR remote sensing data for classification of complex forest areas. Geoscience and Remote Sensing, IEEE Transactions on 46, 1416-1427.
GRSS_DFC, 2015. 2015 IEEE GRSS Data Fusion, 2015 IEEE GRSS Data Fusion Contest. , in: IEEE (Ed.), Online:
http://www.grss-ieee.org/community/technical-committees/data-fusion”.
Hong, J., 2009. Data fusion of LiDAR and image data for generation of a high-quality urban DSM, Proceedings of the joint urban remote sensing event. IEEE., Shanghai, China.
Khoshelham, K., Nedkov, S., Nardinocchi, C., 2008. A comparison of Bayesian and evidence-based fusion methods for automated building detection in aerial data. International Archives of the Photogrammetry, Remote Sensing and Spatial Information Sciences 37, 1183-1188.
Lee, D.H., Lee, K.M., Lee, S.U., 2008. Fusion of lidar and imagery for reliable building extraction. Photogrammetric Engineering & Remote Sensing 74, 215-225.
Li, H., Gu, H., Han, Y., Yang, J., 2007. Fusion of high-resolution aerial imagery and lidar data for object-oriented urban land-cover classification based on svm. Proceedings of the ISPRS Working Group IV/1:“Dynamic and Multi-dimensional GIS, 179-184.
Li, Y., Wu, H., An, R., Xu, H., He, Q., Xu, J., 2013. An improved building boundary extraction algorithm based on fusion of optical imagery and LiDAR data. Optik-International Journal for Light and Electron Optics 124, 5357-5362.
Malpica, J.A., Alonso, M.C., Papí, F., Arozarena, A., Martínez De Agirre, A., 2013. Change detection of buildings from satellite
imagery and lidar data. International journal of remote sensing 34, 1652-1675.
Pedergnana, M., Marpu, P.R., Mura, M.D., Benediktsson, J.A., Bruzzone, L., 2012. Classification of remote sensing optical and lidar data using extended attribute profiles. Selected Topics in Signal Processing, IEEE Journal of 6, 856-865.
Rottensteiner, F., Trinder, J., Clode, S., Kubik, K., 2005. Using the Dempster-Shafer method for the fusion of LIDAR data and multi-spectral images for building detection. Information fusion 6, 283-300.
Schenk, T., CsathA, B., 2002. Fusion of LIDAR data and aerial imagery for a more complete surface description. International Archives of Photogrammetry Remote Sensing and Spatial Information Sciences 34, 310-317.
Sohn, G., Dowman, I., 2007. Data fusion of high-resolution satellite imagery and LiDAR data for automatic building extraction. ISPRS Journal of Photogrammetry and Remote Sensing 62, 43-63.
Trinder, J., Salah, M., 2012. Aerial images and LiDAR data fusion for disaster change detection. ISPRS Annals of Photogrammetry, Remote Sensing and Spatial Information Sciences 1, 227-232.
Yousef, A., Iftekharuddin, K., 2014. Shoreline extraction from the fusion of LiDAR DEM data and aerial images using mutual information and genetic algrithms, Neural Networks (IJCNN), 2014 International Joint Conference on. IEEE, pp. 1007-1014.
Zabuawala, S., Nguyen, H., Wei, H., Yadegar, J., 2009. Fusion of LiDAR and aerial imagery for accurate building footprint extraction, IS&T/SPIE Electronic Imaging. International Society for Optics and Photonics, pp. 72510Z-72510Z-72511.