APPLICATIONS OF MEDIUM C-BAND AND HIGH RESOLUTION X-BAND
MULTI-TEMPORAL INTERFEROMETRY IN LANDSLIDE INVESTIGATIONS
J. Wasowski a *, F. Bovenga b, R. Nutricato c, D. O. Nitti c, M. T. Chiaradia d
a CNR-IRPI, National Research Council, 70126 Bari, Italy - [email protected] b CNR-ISSIA, National Research Council, 70126 Bari, Italy - [email protected] c GAP srl, c/o Politecnico di Bari, 70126 Bari, Italy – (raffaele.nutricato, davide.nitti)@gapsrl.eu d Dipartimento Interateneo di Fisica, Politecnico di Bari, 70126 Bari, Italy - [email protected]
KEY WORDS: COSMO-SkyMed, ENVISAT, ERS, Multi-Temporal Interferometry, Landslide
ABSTRACT:
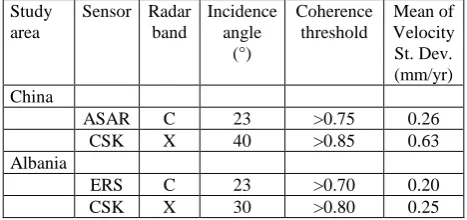
With the increasing quantity and quality of the imagery available from a growing number of SAR satellites and the improved processing algorithms, multi-temporal interferometry (MTI) is expected to be commonly applied in landslide studies. MTI can now provide long-term (years), regular (weekly-monthly), precise (mm) measurements of ground displacements over large areas (thousands of km2), at medium (~20 m) to high (up to 1-3 m) spatial resolutions, combined with the possibility of multi-scale (regional to local) investigations, using the same series of radar images. We focus on the benefits as well as challenges of multi-sensor and multi-scale investigations by discussing MTI results regarding two landslide prone regions with distinctly different topographic, climatic and vegetation conditions (mountains in Central Albania and Southern Gansu, China), for which C-band (ERS or ENVISAT) and X-band COSMO-SkyMed (CSK) imagery was available (all in Stripmap descending mode). In both cases X-band MTI outperformed C-band MTI by providing more valuable information for the regional to local scale detection of slope deformations and landslide hazard assessment. This is related to the better spatial-temporal resolutions and more suitable incidence angles (40°-30° versus 23°) of CSK data While the use of medium resolution imagery may be appropriate and more cost-effective in reconnaissance or regional scale investigations, high resolution data could be preferentially exploited when focusing on urbanized landslides or potentially unstable slopes in urban/peri-urban areas, and slopes traversed by lifelines and other engineering structures.
* Corresponding author
1. INTRODUCTION
Slope hazards constitute a worldwide problem because landslides not only occur in mountains, but can also affect even modest artificial reliefs, coastal zones and river banks. It is also recognized that landslide related socio-economic losses have been increasing globally, especially in developing or recently industrialized countries (e.g., Petley, 2012).
Ground-based investigations and monitoring of terrain prone to landsliding are expensive, typically conducted only after the slope failure, and limited in terms of spatial and temporal coverage. Hence, the employment of complementary, cost-effective approaches to slope hazard detection and assessment is desirable.
Different remote sensing techniques can be used to detect and monitor ground surface displacements generated by landsliding. These include ground-based radar interferometry, air-borne and terrestrial LiDAR and air- and space-borne image matching (cf. overview by Wasowski and Bovenga, 2014a and references therein).
In this paper we focus on the application of advanced satellite MTI in landslide investigations. MTI can be considered cost-effective, especially when exploited over large areas, in as much as it can deliver great quantities of useful information for scientists and practitioners engaged in slope hazard mitigation.
MTI offers very good surveying capability of ground surface
deformations, including those related to landslide activity (e.g., Colesanti et al., 2003; Hanssen 2005; Colesanti and Wasowski, 2006; Hooper et al., 2012; Motagh et al., 2013; Bally, 2013; Wasowski and Bovenga 2014a,b). The strengths of the technique include:
- Large area coverage (thousands of km2) together with high spatial resolution (1-3 m) of the new radar sensors e.g., CSK, TerraSAR-X and multi-scale investigation option (regional to local);
- Very high precision (mm-cm) of surface displacement measurements only marginally influenced by bad weather;
- Regular, high frequency (days-weeks) of measurements over long periods (years);
- Retrospective studies using long-period (>20 years) archived radar imagery.
We discuss the performance of MTI in regional to local-scale landslide investigations by comparing the results obtained from medium resolution C-band data (ERS and ENVISAT) and from high resolution X-band data (CSK, Stripmap mode) for two landslide prone areas located in different geomorphic, climatic and vegetation settings: moderate elevation mountains of Central Albania and high mountains in Southern Gansu, north-western China. Such comparisons are still infrequent in literature and more case studies from different environments are desirable to better assess the benefits and challenges of medium and high resolution MTI applied to landslide analyses.
2. RADAR DATA AND MTI PROCESSING
2.1 Data
For the Chinese site we used the following SAR datasets: 32 C-band images acquired between July 2003 and August 2010 by ENVISAT ASAR; 22 X-band images acquired between November 2010 and February 2012 by CSK. For the Albanian site we used: 35 C-band images acquired between November 1992 and December 2000 by ERS; 39 X-band images acquired between May 2011 and June 2014 by CSK.
All the images were acquired in Stripmap mode along descending pass. For the CSK data we selected suitable incident angle by considering the topography of the studied areas. No such a possibility existed in case of the ERS and ENVISAT data. Specifications regarding the SAR datasets and processing results are given in Table 1.
2.2 MTI processing
We used the SPINUA (Stable Point INterferometry over Unurbanized Areas) algorithm. This PSI-like algorithm, developed for detecting and monitoring targets (PS) in non- or scarcely-urbanized areas (Bovenga et al., 2005; Bovenga et al., 2006), has been updated to increase its flexibility also in cases involving densely urbanized areas, as well as to assure proper processing of X-band data from CSK and TerraSAR-X (Bovenga et al., 2012) and from Sentinel-1A IWS mode.
SPINUA algorithm includes a patch-wise processing scheme that relies on processing small zones (usually a few km2) within a radar image. The patches are selected to optimize the density and the distribution of potential coherent targets. Their small size allows using locally an approximate model for the atmospheric phase signal, which in turn ensures high processing robustness. Such ad hoc solutions enable obtaining quickly results on small areas using even low number of images (e.g., Bovenga et al., 2012). Moreover, in case of local scale analysis, this approach is robust against phase unwrapping errors occurring where target density is low. In case of large areas, atmospheric phase residuals are interpolated through a kriging procedure, and an ad hoc integration scheme is used to stitch the displacement maps retrieved on the single patches. SPINUA has been applied to investigate different studies including landslides, subsidence processes and post-seismic deformations (Bovenga et al., 2006; Nitti et al., 2009; Reale et al., 2011).
In this work, similar, relatively high coherence thresholds were adopted during processing to assure the quality and comparability of C- and X-band results (Table 1). Indeed, in all cases low standard deviations of movement velocity estimates (on total PS samples) were obtained.
Table 1. Specifications for SAR datasets and processing results
3. ASSESSMENT OF MTI RESULTS FROM C-BAND
AND X-BAND DATA occasionally intense storm episodes (Tang et al., 2011).
Vegetation cover is limited. Grass is common in the highest elevation areas which also include some forest and shrub. The barren ground is also common on the high steep slopes and it generally corresponds to rocky outcrops. The cultivated land is present on the middle-lower elevations. The area is scarcely populated, but contains many small towns, villages and infrastructure concentrated within the major river valleys.
3.1.1 Regional scale assessment of MTI results: The first CSK-based results concerning the north-western part of the study area (~40 km2 around the town of Zhouqu) were presented by Wasowski and Bovenga (2014b) and Wasowski et al. (2014). High density of radar targets (>1000/km2) and detection of active slope movements were reported. Radar visibility and landslide maps were also presented and discussed.
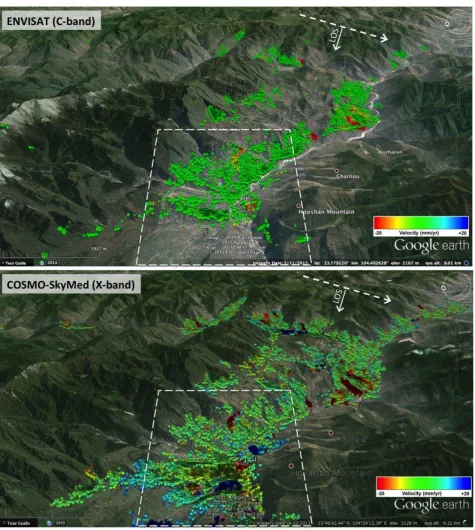
Here we consider the larger area corresponding to the full CSK frame (~1700 km2), and along with X-band results we present the outcomes of C-band data processing. The comparison of the results (Figure 1) shows that in both cases quite different densities of radar targets are obtained (~13 PS/km2 and >300 PS/km2, respectively for C- and X-band data). Most PS are motionless and concentrate along the middle-lower slopes of major river valleys. A number of large clusters of moving PS are also present. Many of these have the characteristically elongated shape and correspond to very large slow landslides.
Furthermore, the evaluation of the results shows that, in terms of landslide detection capability, X-band MTI clearly outperforms C-band MTI. In particular, at the small scale of Figure 1, the CSK and ENVISAT results allow the recognition of, respectively, 18 and 6 large-sized active landslides.
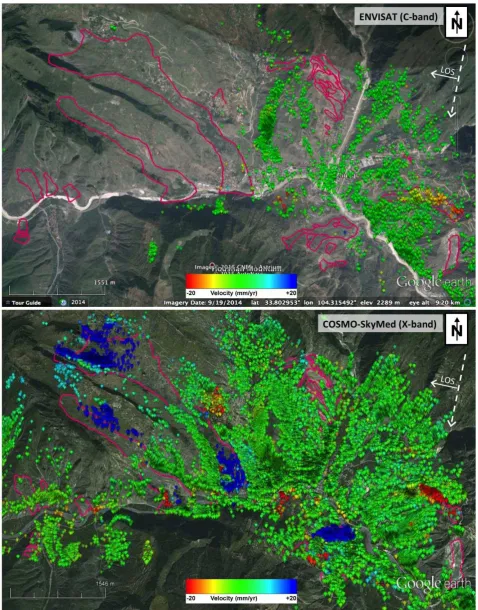
3.1.2 Local scale assessment of MTI results: Such assessment is useful, because landslides are local scale features. Here we consider the north-western portion of the study area amounting to ~53 km2, for which we had an inventory of larger landslides mapped from GETM (Figure 2). In this case the PS densities obtained from C- and X-band data are, respectively, ~108 PS/km2 and ~1450 PS/km2. Furthermore, evident differences exist in the distribution of C-band and X-band PS, with the former notably lacking on E and SE-facing slopes.
The scarcity of PS and/or their inhomogeneous distribution have direct influence on landslide detection capability. Using C-band MTI, the activity of only one out of 25 mapped landslides was detected; two other large landslides contained few moving PS, but their number and distribution were unsuitable for a slope hazard assessment. Two smaller slides with several non-moving PS were classified as inactive. The X-band MTI allowed the detection of 6 moving landslides; 10 additional slides contained an adequate number of suitably distributed non-moving PS, so that their inactivity was indicated. The International Archives of the Photogrammetry, Remote Sensing and Spatial Information Sciences, Volume XL-1/W5, 2015
Figure 1. Regional scale (~1700 km2) overviews of the distribution and average line of sight (LOS) velocity of radar targets (PS) in Southern Gansu Mountains, China. Velocity values are saturated to ±20 mm/year. Yellowish-reddish and bluish dots represent radar targets moving, respectively, away from and toward the satellite sensor. White dashed line polygons indicate the areas shown in Figure 2. Background images are from Google EarthTM. (Upper) MTI results obtained from ENVISAT ASAR data. (Lower) MTI
results obtained from CSK data.
Figure 2. Local scale (~53 km2) overviews of the distribution and average line of sight (LOS) velocity of radar targets in the Zhouqu area, Southern Gansu Mountains, China. Velocity values are saturated to ±20 mm/year. Yellowish-reddish and bluish dots represent radar targets moving, respectively, away from and toward the satellite sensor. The outlines of 25 landslides (in pink), mapped using Google EarthTM, are from Wasowski and Bovenga (2014b). Background images are from Google EarthTM. (Upper) MTI results
obtained from ENVISAT data. (Lower) MTI results obtained from CSK data
3.2 Mountains of Central Albania
The mountains of interest are located just to the east of Tirana, the country’s capital (Figure 3). In comparison with the Chinese site, the topography is lower (typically below 1500 m) and slopes less steep. However the average annual precipitation in the Albanian mountains is much higher and can reach over 2000 mm (Meco and Aliaj, 2000). Winter represents the most rainy season with snow precipitation being common.
In relation to the relatively wet climate, the vegetation cover is more abundant (mainly trees and shrub) than in Southern Gansu. The GETM imagery also reveals that barren ground can locally be common, especially in the areas most prone to landsliding and erosion (Figures 3, 4). Grass is less abundant, while the amount of cultivated land appears insignificant, because the mountains are very scarcely populated.
3.2.1 (Sub)regional scale assessment of MTI results: We build upon the recent study of Wasowski et al. (2015, in press), who presented the first MTI results for Central Albania based on Stripmap CSK data. In particular, for the sake of comparison with X-band, MTI we present and discuss the results derived from processing of C-band ERS data.
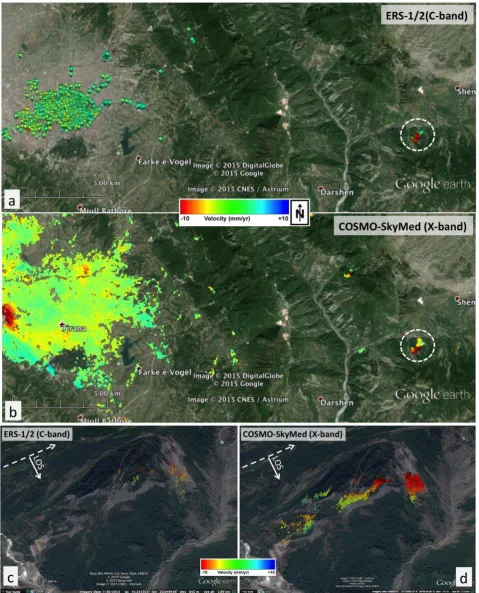
Figure 3a,b provides a wide-area overview of C-band and X-band MTI results for the Central Albania region. In both cases a large cluster of PS stands out in the western-most part of the region (lowland), which corresponds to the city of Tirana. However, PS appear very scarce in the mountainous area to the east. In particular, only few small clusters of PS are derived from C-band data. The number of PS clusters obtained from X-band processing is about three times greater. Finally, some of the PS groups show elongated shape, which, especially in case of moving PS, can be associated with slope movements. This possibility is further explored by examining MTI results at a local scale.
3.2.2 Local (slope) scale assessment of MTI results: Here we focus on a single mountain for which a considerable number of PS was derived from both C-band and X-band data (Figure 3c,d). In both cases movements were detected on north and west facing slopes. The number of C-band PS was much lower than that of X-band PS, but when considered within the geomorphic context of instability indicated from GETM optical imagery (Figure 3), the information obtained from ERS data was sufficient for a meaningful interpretation. Only CSK data provided information (PS) for the middle-lower part of north facing slope, where slowly moving PS indicated the presence of instability conditions.
4. DISCUSSION AND CONCLUSIONS
The outcomes of this study, and in particular the comparisons of the results derived from C- and X-band data, provide useful insight on the applicability of MTI in regional to local scale slope hazard investigations, including the capability of detecting active landslides. Although the C- and X-band datasets were not coeval, such comparisons are still of interest, because slope movements are very common and persistent in both Central Albania and Southern Gansu mountains in relation to the high seismic activity, presence of weak geological materials and recurrence of hydrological triggers (Meco and Aliaj, 2000; Dijkstra et al, 2012; Wasowski et al., 2014).
Despite the significant environmental differences between the studied areas, in both cases X-band MTI proved to be more effective in terms of providing better coverage of features of interest (landslides). This was observed on all scales, from regional, sub-regional to local, and can be ascribed to much better spatial (and temporal) resolution, as well as to the higher incidence angles (40° and 30°) of X-band CSK data.
The above findings are consistent with what has been reported in the literature on X-band MTI applied to landslide investigations in other mountain ranges such as e.g., the Pyrenees (Notti et al., 2010; Herrera et al., 2013), Alps (Bovenga et al., 2012), Apennines (Wasowski and Bovenga, 2014a,b). However, with shorter revisit times, improved applicability of medium resolution C-band MTI in landslide investigations is expected from new sensors such as the ESA’s Sentinel-1A. In particular, the full Sentinel-1 constellation will provide a revisit time of six days, and this should guarantee coherent interferometric phase measurements over a wider range of ground surfaces (e.g., Morishita and Hanssen, 2015).
Furthermore, the presented examples show that, while simple slope visibility maps can suffice to define suitable sensor acquisition geometry and estimate a priori the MTI potential to provide useful results in high mountain, semi-arid environments with limited vegetation cover, in densely vegetated mountains like those in Albania, more comprehensive MTI feasibility assessments based also on land cover / land-use information (cf. Cigna et al., 2014; Wasowski and Bovenga, 2014b) could be needed. A detailed MTI feasibility assessment can be recommended especially for very local, slope scale investigations.
MTI studies that rely on the use of multi-sensor and multi-band data are attractive, because such approach can deliver complementary information. However, in applied MTI the choice of the investigative approach will ought to be tailored to the specific study region conditions, landslide types and their likely dynamics, keeping in mind the objectives of the work and budget constraints. Considering that landslides are local scale features, one can argue that, in general, higher spatial resolution imagery will likely lead to improved MTI applicability (more detailed slope instability assessment). Temporal resolutions are also of practical importance e.g., for timely assessment of slope hazard via high frequency measurements, and for revealing detailed patterns of landslide activity and their relationships to causative and triggering factors.
ACKNOWLEDGEMENTS
Work carried out using CSK® Products© of the Italian Space Agency (ASI), delivered under a license to use by ASI. CSK imagery for the Chinese and Albanian sites were obtained within the projects, respectively, COSMO-SkyMed AO ID 1820 and “Studio su instabilità del terreno sull’area di Tirana (Albania)”. European Space Agency (ESA) provided ERS and ENVISAT data (CAT-1 C1P2653 Advanced SAR interferometry techniques for landslide warning management). We thank Tom Dijkstra (BGS) and Xingmin Meng (University of Lanzhou) for valuable discussions on geology and landslide processes in Gansu Province, as well as Spartak Kucaj (Polytechnic University of Tirana) for his help within the Albanian project.
Figure 3. MTI results obtained from ERS and CSK data for the Central Albanian mountains. The distribution and average line of sight (LOS) velocity of radar targets are shown. Velocity values are saturated to ±10 mm/year. Yellowish-reddish and bluish dots represent radar targets moving, respectively, away from and toward the satellite sensor. (a) and (b) sub-regional scale overviews; (c) and (d) MTI results for a single hillslope (location marked by dashed circles in upper figures). Background from Google EarthTM
REFERENCES
Bally, P. (Ed), 2013. Satellite Earth Observation for Geohazard Risk Management - The Santorini Conference - Santorini, Greece, 21-23 May 2012. ESA Publication STM-282 doi:10.5270/esa-geo-hzrd-2012
Bovenga, F., Nutricato, R., Refice, A., Wasowski, J., 2006. Application of Multi-temporal Differential Interferometry to Slope Instability Detection in Urban/Peri-urban Areas. Engineering Geology, 88(3-4), pp. 218-239.
Bovenga, F., Refice, A., Nutricato, R., Guerriero, L., Chiaradia, M.T., 2005. SPINUA: a flexible processing chain for ERS / ENVISAT long term Interferometry. Proceedings of ESA-ENVISAT Symposium, September 6-10, 2004, Salzburg, Austria. ESA Sp. Publ. SP-572, April 2005, CD.
Bovenga, F., Wasowski, J., Nitti, D.O., Nutricato, R., Chiaradia, M.T., 2012. Using Cosmo/SkyMed X-band and ENVISAT C-band SAR Interferometry for landslide analysis. Remote Sensing of Environment, 119, pp. 272-285.
Cigna, F., Bateson, L., Jordan, C., Dashwood, C., 2014. Simulating SAR geometric distortions and predicting Persistent Scatterer densities for ERS-1/2 and ENVISAT C-band SAR and InSAR applications: Nationwide feasibility assessment to monitor the landmass of Great Britain with SAR imagery. Remote Sensing of Environment, 152, pp. 441-466.
Colesanti, C., Ferretti, A., Prati, C., Rocca, F., 2003. Monitoring landslides and tectonic motion with the permanent scatterers technique. Engineering Geology, 68, pp. 3-14.
Colesanti, C., Wasowski, J., 2006. Investigating landslides with space-borne Synthetic Aperture Radar (SAR) interferometry. Engineering Geology, 88(3-4), pp. 173–199.
Dijkstra T. A., Chandler J. H., Wackrow R., Meng X. M., Ma D. T., Gibson A., Whitworth M., Foster C., Lee K., Hobbs P.R.N., Reeves H. J., Wasowski J., (2012) Geomorphic controls and debris flows - the 2010 Zhouqu disaster, China. Proceedings of the 11th ISL & 2nd North American Symposium on Landslides, 3-8 June, 2012, Banff, Canada.
Hanssen, R., 2005. Satellite radar interferometry for deformation monitoring: a priori assessment of feasibility and accuracy. Int. Journal of Applied Earth Observation and Geoinformation, 6, pp. 253-260.
Herrera G., Gutiérrez F., García-Davalillo J. C., Guerrero J., Notti D., Galve J.P., Fernández-Merodo J.A., Cooksley, G., 2013. Multi-sensor advanced DInSAR monitoring of very slow landslides: The Tena Valley case study (Central Spanish Pyrenees). Remote Sensing of Environment, 128, pp. 31–43.
Hooper, A., Bekaert, D., Spaans, K., Arıkan M.T., 2012. Recent advances in SAR interferometry time series analysis for measuring crustal deformation. Tectonophysics, 514–517, pp. 1-13.
Meço S., Aliaj S. (2000): Geology of Albania. Gebruder Borntraeger, Berlin (ISBN 978-3-443-11028-4). 246p.
Morishita Y., Hanssen R., 2015. Temporal decorrelation in L-, C- and X-band satellite radar interferometry for pasture on drained peat soils. IEEE Trans. Geosci. Remote Sens., 53(2), pp. 1096–1104.
Motagh, M., Wetzel, H.-U., Roessner, S., Kaufmann, H., 2013. A TerraSAR-X InSAR study of landslides in southern Kyrgyzstan, Central Asia. Remote Sensing Letters, 4(7), pp. 657-666.
Nitti, D.O., Bovenga, F., Refice, A., Wasowski, J., Conte, D., Nutricato, R., 2009b. L- and C-band SAR Interferometry analysis of the Wieliczka salt mine area (UNESCO heritage site, Poland). Proceedings ALOS PI 2008 Symposium, 3 – 7 Nov., 2008, Rhodes, Greece. ESA SP-664, January 2009.
Notti, D., Davalillo, J. C., Herrera, G., Mora, O., 2010. Assessment of the performance of X-band satellite radar data for landslide mapping and monitoring: Upper Tena valley case study. Natural Hazards and Earth System Sciences, 10, pp. 1865–1875.
Petley, D., 2012. Global patterns of loss of life from landslides. Geology, 40(10), pp. 927–930.
Reale, D., Nitti, D. O., Peduto, D., Nutricato, R., Bovenga, F., Fornaro, G., 2011. Post-seismic Deformation Monitoring With The COSMO/SKYMED Constellation. IEEE Geoscience and Remote Sensing Letters, 8(4), pp. 696-00.
Tang, C., Rengers, N., van Asch, T.W.J., Yang, Y.H., Wand G.F., 2011. Triggering conditions and depositional characteristic of a disastrous debris flow event in Zhouqu city, Gansu Province, northwestern China. Natural Hazards and Earth Systems Sciences, doi:10.5194/nhess-11-2903-2011.
Wasowski J., Bovenga F., 2014a. Remote Sensing of Landslide Motion with Emphasis on Satellite Multitemporal Interferometry Applications: An Overview. In T. Davies Ed. Landslide Hazards, Risks and Disasters. pp. 345-403. http://dx.doi.org/10.1016/B978-0-12-396452-6.00011-2 Elsevier Inc.
Wasowski J., Bovenga F., 2014b. Investigating landslides and unstable slopes with satellite Multi Temporal Interferometry: Current issues and future perspectives. Engineering Geology, 174, pp. 103–138.
Wasowski J., Bovenga F., Dijkstra T., Meng X., Nutricato R.,
Chiaradia M.T., 2014. Persistent Scatterers Interferometry
Provides Insight on SlopeDeformations and Landslide Activity in the Mountains of Zhouqu, Gansu, China. In K. Sassa et al.
satellite multi-temporal interferometry for detecting and monitoring landslide and subsidence hazards. Proceedings 10th Asian Regional Conference of IAEG, Kyoto, 26-27 Sept., 2015. The International Archives of the Photogrammetry, Remote Sensing and Spatial Information Sciences, Volume XL-1/W5, 2015