Towards an automated monitoring of human settlements in South Africa using high
resolution SPOT satellite imagery
T. Kemper a, *, N. Mudau b, P. Mangara b, M. Pesaresi a
a
European Commission, Joint Research Centre (JRC), Institute for the Protection and Security of the Citizen (IPSC), Global Security and Crisis Management Unit, Via Enrico Fermi 2749, 21027 Ispra VA, Italy – [email protected]
b
South African National Space Agency (SANSA), Earth Observation, Pretoria, South Africa
KEY WORDS: Automated Image Information Extraction, Settlement Mapping, Urbanization Monitoring, Informal Settlements, Low Cost Housing, South Africa
ABSTRACT:
Urban areas in sub-Saharan Africa are growing at an unprecedented pace. Much of this growth is taking place in informal settlements. In South Africa more than 10% of the population live in urban informal settlements. South Africa has established a National Informal Settlement Development Programme (NUSP) to respond to these challenges. This programme is designed to support the National Department of Human Settlement (NDHS) in its implementation of the Upgrading Informal Settlements Programme (UISP) with the objective of eventually upgrading all informal settlements in the country. Currently, the NDHS does not have access to an updated national dataset captured at the same scale using source data that can be used to understand the status of informal settlements in the country.
This pilot study is developing a fully automated workflow for the wall-to-wall processing of SPOT-5 satellite imagery of South Africa. The workflow includes an automatic image information extraction based on multiscale textural and morphological image features extraction. The advanced image feature compression and optimization together with innovative learning and classification techniques allow a processing of the SPOT-5 images using the Landsat-based National Land Cover (NLC) of South Africa from the year 2000 as low-resolution thematic reference layers as. The workflow was tested on 42 SPOT scenes based on a stratified sampling. The derived building information was validated against a visually interpreted building point data set and produced an accuracy of 97 per cent. Given this positive result, is planned to process the most recent wall-to-wall coverage as well as the archived imagery available since 2007 in the near future.
* Corresponding author
1. INTRODUCTION
According to the 2014 revision of the World Urbanization Prospects 54 per cent of the world’s population lives in urban areas and it will increase to 66 per cent by 2050 (UNDESA, 2014). Much of the expected urban growth will take place in countries of the developing regions, particularly Africa. As a result, these countries will face numerous challenges in meeting the needs of their growing urban populations, including for housing, infrastructure, transportation, energy and employment, as well as for basic services such as education and health care. Therefore the management of urban areas has become one of the most important development challenges of the 21st century. Understanding the dynamics of human settlements is a pre-requisite for sustainable development and environmental management (UNDESA, 2014).
In South Africa, the proportion of people living in urban areas increased from 52% in 1990 to 62% in 2011. Both cities and smaller towns are experiencing high growth rates in South Africa. In addition to natural population growth and migration of people from rural areas to cities, urbanisation in South Africa is also enhanced by migration of people from neighbouring countries and other parts of Africa (STATSSA, Census, 2011). Proliferation of informal settlements around the South African cities and towns is evident as poor people settle in informal settlements in search of employment. In South Africa, about 1 249 777 households live in informal settlements excluding backyard shacks (STATSSA, Census 2011). This translates to
4.2 million people of South Africa’s 51.7 million living in informal settlements.
The South African government is party to the United Nations MDG 7 Target 11 which provide for the improvement of people living in informal settlements and has established an Upgrading of Informal Settlement Programme (UISP), which is aimed at upgrading all informal settlements in the country using a phased approach. To fast track the service delivery, in 2010 the South African government has established an outcome based approach, which focused on the upgrading of 400 000 units in informal settlements by 2014. But there is a need to continuously track the developments of informal settlements to support sustainable development and resources allocation for informal settlement upgrade programmes. One of the challenges faced by local authorities, responsible for upgrading of the informal settlements, is access to timely and consistent spatial information on the informal settlements development.
In South Africa, there are a number of initiatives that are aimed at capturing human settlements data for different levels of planning and management. These initiatives include Eskom’s SPOT Building Count, STATSSA dwelling Frame and land cover and land use by various levels of government departments. The methodologies used for these initiatives are time consuming and resource intensive.
human settlements information that is being developed through a collaboration between JRC and SANSA has far reaching applications and will support a plethora of legislative mandates assigned to the different government departments and public entities in South Africa. Some of the most prominent legislative acts include: Electoral Act through the demarcation of voting districts and verification of voting stations, the Statistics Act through supporting the dwelling frame and census planning, National Human Settlements Land Inventory Act through the quantifying of areas occupied by human settlements, Conservation of Agricultural Resources Act by monitoring encroachment of human settlements in fertile agricultural land, the Spatial Planning and Land Use Management Act through the provision of information relating to the spatial extends of human settlement and the Disaster Management Act since information on human settlements is critical for post disaster verification, disaster risking profiling and assessment , and for monitoring and evaluating the impacts of passive and active disasters.
2. DATA AND STUDY AREA
2.1 Satellite data
SANSA has been acquiring since 2006 SPOT 5 imagery annually to support various aspects of government planning and monitoring ranging from infrastructure to environmental management.
For this study 485 scenes covering the entire country were available, including a panchromatic (2.5m spatial resolution) and a multispectral (10m spatial resolution) image for each scene. The imagery was acquired between January and December 2012. The images were georeferenced using aerial photography provided by the Department of Rural Development and Land Reform, and 20m Digital Elevation Model (DEM) and projected to the Universal Transverse Mercator (UTM) system. Both the panchromatic and multispectral images were georeferenced using the SARMES system (Lück et al., 2007) that automatically georeferences raw imagery. The images that yielded high RSME errors were georeferenced manually. The accuracy assessment was done by manually assessing the geographic positions of points in the satellite imagery and on the aerial photography. An accuracy of 12m at 2-sigma was achieved. To improve the spatial resolution of the satellite imagery, the 2.5m spatial resolution panchromatic imagery and four multispectral bands with 10m spatial resolution imagery were pansharpened using the PCI software to produce 2.5m resolution imagery.
2.2 Ancillary data
The automated workflow used in this study requires information regarding the potential presence of buildings. This information is derived from the South African National Land Cover (NLC 2000, van den Berg, 2008). The NLC 2000 data set was derived using multi temporal Landsat 7 ETM imagery acquired in 2000-2003. It contains 49 land cover and land use classes of which 16 are urban land use classes. The vegetation and natural environmental land cover classes were mapped using pixel based classification whereas human settlements and other spectral heterogeneous land use classes were mapped through manual digitisation.
For the validation and the identification of settlements in remote areas, SPOT Building Count (SBC) data set of the year 2012 were used. The SBC is a point and polygon data set derived from SPOT 5 satellite imagery and is funded by Eskom, the
power utility company. The first layer of SBC was generated using SPOT 5 imagery acquired in 2006. This dataset is updated annually after each national SPOT 5 release. The SBC layer is developed through visual interpretation and manual digitisation of the building structures. The location of individual building structures identifiable from SPOT 5 2.5 natural colour image is mapped by points whereas the extent of informal settlements is mapped by polygon as individual dwellings within informal settlements cannot be identified using 2.5m spatial resolution imagery. The layer used in this study was updated using 2012 SPOT 5 imagery. The SBC layer was used mainly for the validation of the settlement mask. In addition it is used in scarcely populated areas to mark potentially settled areas.
2.3 Study Area
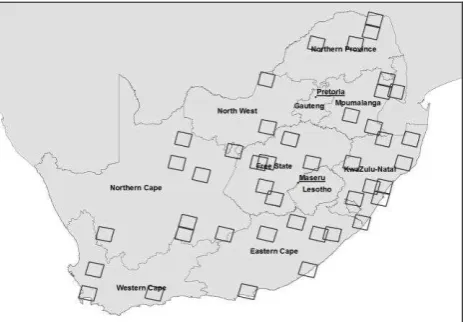
The results presented in this paper are a precursor for the first automatically generated wall-to-wall map of settlements of South Africa derived from high resolution satellite imagery. From the 485 scenes that cover the entire territory of South Africa, 42 were selected based on a stratified sampling approach. The stratification took into account two factors: the vegetation and the population/settlement density. The vegetation density information was derived from the maximum Leaf Area Index (LAI) derived from the GLASS LAI product (Xiao et al., 2013) and included 4 classes. The settlement density is based on the BUREF layer (Pesaresi et al., 2013), which is a combination of the urban class of the MODIS Land Cover Product and the LandScan1 2010 population layers. The BUREF values were split into 3 classes. Depending on the size of the strata different numbers of samples were drawn. The location and distribution of the selected scenes is shown in Figure 1.
Figure 1. Study area and selected satellite scenes
3. METHODOLOGY
This chapter describes the high level workflow and the different processing steps (feature detection, advanced learning and classification), and the validation approach.
3.1 Workflow
The workflow presented in this paper is focussing on the information extraction and does not include any image
1
preprocessing. As described in section 2.1 the input imagery was already orthorectified and radiometrically corrected. The processing starts with the calculation of a luminance image (the maximum reflectance in the visible bands). This maximises the settlement contrast with the background and reduces the image size to a single band image. The geographic extend (bounding box) of the image is used to cut the equivalent area from the countrywide NLC 2000 data set, which is used later during the learning as reference set.
Figure 2. GHSL South Africa workflow
3.2 Feature Detection
The feature detection is based on the extraction of three different classes of features: texture, morphological and radiometric features. The following describes each of the three features.
The textural image features are derived from grey-level co-occurrence matrix (GLCM) contrast textural measurements (Haralick et al. 1973). The contrast textural measures calculated using anisotropic displacement vectors are combined in a rotation-invariant image feature called PANTEX (Pesaresi et al. 2008) by using minima and/or maxima operators. Pesaresi et al. demonstrated that the PANTEX measurement is strongly correlated with the presence of buildings (Pesaresi et al. 2011a) as well as their spatial density (Pesaresi et al. 2011b). The capacity of PANTEX to discriminate built-up from non-built-up areas is mainly linked to the fact that it is a corner detector and that the BU areas generate high local image spectral heterogeneity due to the of heterogeneity of building materials and because the buildings generally cast shadows (Gueguen et al. 2012).
The morphological feature analysis extracts single objects of different sizes, which can be used to identify building footprint candidates. The morphological features are summarized in an information layer that is a product of a multi-scale morphological analysis protocol referred to as the “mtDAP” (Ouzounis et al. 2012). The mtDAP protocol computes the Differential Attribute Profile (DAP) vector field (Mura et al. 2010) from the input imagery. DAPs are nonlinear spatial signatures that are used extensively in remote sensing optical image analysis in ways analogous to spectral signatures. The DAP of a pixel is the concatenation of two response vectors. The first registers intensity differences, i.e., contrast, within a top-hat scale-scape of an anti-extensive attribute filter, and the second intensity differences on the bottom-hat scale-space of an extensive attribute filter. The pair defines an adjunction with the first typically being a connected attribute opening and the second being a connected attribute closing. The mtDAP can be configured with any morphological attribute filter, but in this
case simple area openings and closings prove to be sufficient. The area attribute is used to order objects based on size and it is computed incrementally. More detailed information is provided in Pesaresi et al. (2013).
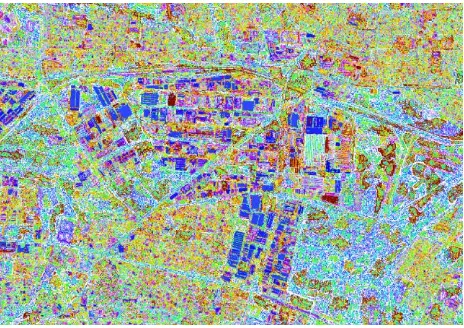
The resolution of the DAPs (vector length and the between-scale spacing) is a critical parameter in their utilization as feature descriptors. On the one hand, higher spatial input resolution offers a more detailed profile for each pixel. On the other hand by increasing the vector length the number of DAP vector field planes increases proportionally. This can become an issue with large data sets at higher resolution. Hence, Pesaresi et al. (2012) proposed a compression model that was devised to radically reduce the dimensionality of the DAP descriptors. It is called the Characteristic-Saliency-Level, or CSL Model, and is a medium abstraction semantic layer that can be projected on the HSV colour space for the visual exploration of built-up extracted from VHR satellite imagery. The CSL model is a nonlinear mixture model consisting of three characteristic parameters extracted from the DAP of each pixel. That is the minimum scale at which the maximal contrast response is observed in the DAP (the characteristic), the contrast value (the saliency) and the highest peak component level from which this value is computed. The model is computed directly from the polychotomy of the two tree-based data structures and with no need for exporting the DAP vector fields. It reduces radically the dimensionality of the DAP vector field to a three-band representation in a statistical-model free approach, i.e. it avoids clustering based on the statistical distribution of the DAP features of a given image. It does not require manual tuning and its computation is independent of the length of the DAP. The radiometric feature detection is analysing the feature space by grouping pixels based on their radiometric behaviour. This is obtained by quantization and subsequent sampling of the feature space comparable to a cluster analysis. Figure 3 shows an example of the feature extraction. Large industrial buildings are clearly discernible, while smaller features, such as residential houses are less apparent.
Figure 3. Radiometric feature extraction. The colours mark similar features.
3.3 Learning and Feature Classification
analysis. These techniques are well established tools in, for example, medical diagnosis, protein sequences, census data, fraud detection in web and credit card business genome characterization studies (e.g. Anandhavalli et al., 2010). The system searches for relevant, systematic relations between image features and spatial information encoded in the reference landcover data set. For each pixel, the system calculates the probability to belong to a specific LULC class and the class with the highest probability is finally selected. For the binary case of built-up (either a pixel is built-up or it is not), the system calculates a probability to belong to the built-up class. Values are ranging from -1 to +1, where -1 represents the non-built-up class and +1 the non-built-up.
3.4 Validation
The validation of the results is based on a confusion matrix. A set of accuracy measures is calculated on a per-pixel basis as recommended by Foody (2008). These are based on two-class contingency tables resulting from the overlay of the settlement layer and the high resolution validation data: The overall accuracy measures the classification accuracy as the share of all correctly classified urban and non-urban pixels in the error matrix and thus, gives general information regarding the overall map accuracy. However, this measure does not take into account unequal class distributions and thus, does not paint a detailed picture of the accuracy across individual land cover classes. The sensitivity (completeness) relates to the ability/probability to classify urban pixels as defined by the building reference correctly. It is the percentage of the building reference data which corresponds to the classification output of the respective urban extent layer and is closely related to the error of omission (1-sensitivity). The ideal value for the completeness is 100 percent. In turn, the ability of classifying the absence of urban areas correctly is called specificity. The specificity relates to the test’s ability to identify negative results. Precision (correctness) relates to the classifier’s ability to exclude non-urban areas correctly from the urban extent classification as defined by the building reference. This measure is closely related to the error of commission (1-precision) and reaches and ideal value of 100 percent. Finally, the True Skill Statistic (TSS) or informedness is designed to measure the agreement between the classification and the building reference layer. It is calculated as the specificity (fraction of correctly classified urban pixels) plus the sensitivity (fraction of correctly classified non-urban pixels) minus one. Compared to Kappa it has the advantage of being independent from unequal class distributions and thus provides a more robust measure of classification accuracy (Allouche et al., 2006). Its range spans from negative values (systematic disagreement) to 1 (perfect agreement), with a value of 0 indicating a random classification result.
4. RESULTS
The workflow described in this study produces two main outputs: a building density layer and a landuse layer. Both data sets are produced at a pixel resolution of 10 m, which is a trade-off between geolocation accuracy, classification accuracy and file size.
SBC2012 data set as well as the zonal statistics of the built-up density layer was calculated. In order to create a contingency table each 50 m circle was declared as built-up according to the reference, if at least one building point was present. Accordingly a circle was declared as built-up in the output, if at least one pixel had a value greater than zero. Since the percentage of built-up in an area is generally very low, there is a tendency to underestimate the built-up with the standard threshold of zero. Therefore, a receiver operating characteristic (ROC) analysis was carried out to determine the best threshold for the built-up. The Minimum Error Rate (MER) threshold was 0,30. For both thresholds the accuracy measures were calculated as described in section 3.4 (Table 1).
Accuracy Measures Standard
Table 1. Accuracy measures for the standard and optimised threshold.
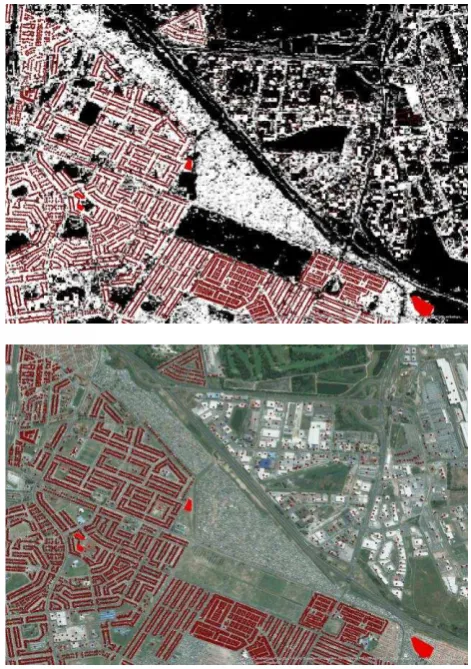
The overall accuracy is very strong with 97%. However, as anticipated earlier this is strongly influenced by the large percentage of non-built-up areas. Nevertheless, also the balanced accuracy with 90% and the true skill statistics with 0.78/0.81 are very good. These values tend to be more robust against the skewed distribution of built-up and non-built-up. The error of omission is acceptable with 19.63% and 16.41%, respectively. The error of commission is rather high with 52.28% and 58.46%. To some extent this is due inaccuracies of the reference layer rather than processing errors. Figure 4 shows an area west of the international airport of Cape Town with the Boquinar Airport Industrial Area in the north-east and the Gugulethu and Nyanga townships in the south and south-west. While most of the township dwellings and industrial buildings are marked with points or polygons, the central part including the informal settlements of Kanana, Barcelona and KTC, is not marked at all. There are various other examples in the data set not shown here. Additional sources of commission error occur in coastal zones (rocky shoreline or sand dunes with patches of vegetation), areas with rock outcrops and bush land areas with small groups of shrubs and trees mixed with open herb- or grassland. The selected area (Figure 4) highlights also some of the problems of the current workflow settings. In the industrial area a number of big buildings are not mapped properly. In fact the current workflow uses a maximum building size limit to speed-up the processing and avoiding erroneous classification of agricultural areas as built-up areas (due to their often rectangular shape). For the wall-to-wall mapping of settlements this has to be taken into account.
Figure 4. Cape Town. Comparison of SBC points (red dots and polygons) with built-up mask (top) and reference image
(bottom).
For the landuse map no adequate independent data set was available for validation. Hence we provide here only a qualitative assessment. Prior to the information extraction the NLC2000 data was recoded to reduce the number of classes from initially 49 to 18. The recoding focussed mostly the non-built-up; the full list of classes is available in Kemper at al. (2014). Figure 5 (top) shows the landuse classes that were obtained from the coarser resolution NLC 2000 (Figure 5, bottom) for the same area as in Figure 4. The new high-resolution landuse map shows a much greater level of detail compared to the NLC 2000. While the large clusters of industrial, informal squatter camp and township are present, the new map also highlights important details such as open and vegetated areas. On the other hand there is a significant portion of noise due to single pixels (or small clusters), e.g. the small clusters of water in the industrial areas, which are most likely misclassifications of shadow areas. Such noise should be reduced with post-classification filtering approaches. In addition, the example shows the limitations of automated image analysis in terms of separation of similar landuse classes. From an image information mining point of view there is hardly any difference between the dwellings in a formal township and those in informal squatter camps. Consequently, we see a lot of areas in the informal squatter camp area mapped as formal township.
Figure 5. Cape Town. Comparison of high resolution landuse map (top) with coarse resolution learning input (bottom).
5. CONCLUSIONS
There is a strong demand for up-to-date information on formal and informal settlements in South Africa. This paper demonstrated the potential of remote sensing to map the settlements of South Africa in an automated manner. The study proofed that the tools developed by the JRC for the Global Human Settlement Layer (Pesaresi et al., 2013) could be adapted to the South African context. With the new workflow developed for South Africa it is even possible to go beyond the state of the art. Instead of providing information on the presence of settlements, the new workflow allows also the classification of major LULC classes.
were identified. In particular the identification of larger buildings is currently not optimal and needs improvement. In addition, there is more work needed for the LULC classes: To what level can different settlement types (e.g. formal vs. informal township) be separated? How do we assure that LULC classes are consistent in neighbouring scenes?
The above mentioned points will be taken into consideration in the improvements of the workflow for the creation of a wall-to-wall settlement map for South Africa of the year 2012, which is planned for 2015. Subsequently it is foreseen to process on the one hand older archived imagery and on the other hand to process newer information layers, possibly including the new SPOT 6 and 7 data acquired by SANSA.
REFERENCES
Allouche O., Tsoar A., Kadmon R., 2006. Assessing the accuracy of species distribution models: prevalence, Kappa and true skill statistic (TSS). Journal of Applied Ecology, 43, 1223-1232, 2012.
Anandhavalli, M., Ghose, M.K, Gauthaman, M., 2010. Association rule mining in genomics. International Journal of Computer Theory and Engineering vol. 2, no. 2, pp. 269-273, doi: 10.7763/IJCTE.2010.V2.151.
Foody, G.M., 2008. Harshness in image classification accuracy assessment. International Journal of Remote Sensing, 29, 3137–3158.
Gueguen, L., Soille, P., Pesaresi, M., 2012. A new built-up presence index based on density of corners. Geoscience and Remote Sensing Symposium (IGARSS), 2012 IEEE International, 22-27 July 2012, pp.5398-5401, doi: 10.1109/IGARSS.2012.6352386.
Haralick, R., Shanmugam, K., Dinstein, I., 1973. Textural features for image classification, IEEE Trans. Syst., Man, Cybern., vol. 3, no. 6, pp. 610–621.
Kemper, T., Mudau, N., Mangara, P., Pesaresi, M., 2014. Towards a country-wide mapping & monitoring of formal and informal settlements in South Africa. Report EUR 27024 EN, Publications Office of the European Union, Luxembourg, doi: 10.2788/970905.
Lück, W., MacInnes I., and Vetter A., 2007. Automated processing chaines for satellite images. Geoinformatics, April/May, 12-13.
Mura, M.D., Benediktsson, J., Waske, B., Bruzzone, L., 2010. Morphological attribute profiles for the analysis of very high resolution images. Geosci. Remote Sens., IEEE Trans. of, vol. 48, no. 10, pp. 3747–3762.
Pesaresi, M., Gerhardinger, A., Kayitakire, F., 2008. A robust built-up area presence index by anisotropic rotation-invariant textural measure. J. Earth Observ. Applicat., vol. 1, no. 3, pp. 180–192, 2008.
Pesaresi, M., Ehrlich, D., Caravaggi, I., Kauffmann, M., Louvrier C., 2011a. Towards global automatic built-up area recognition using optical VHR imagery. Selected Topics in Applied Earth Observations and Remote Sensing, IEEE Journal of,, vol. 4, no. 4, pp. 923–934, 2011a.
Pesaresi, M., Halkia, M., Ouzounis, G., 2011b. Quantitative estimation of settlement density and limits based on textural measurements. in: Proc. 2011 Joint Urban Remote Sensing Event, JURSE 2011, pp. 89–92, 2011b
Pesaresi, M., Ouzounis, G.K., Gueguen, L., 2012. A new compact representation of morphological profiles: Report on first massive VHR image processing at the JRC. Proc. SPIE 8390, Baltimore, MD, USA, Apr. 2012, vol. 8390, p. 8390025.
Pesaresi, M., Huadong, G., Blaes, X., Ehrlich, D., Ferri, S., Gueguen, L., Halkia, M., Kauffmann, M., Kemper, T., Lu, L., Marin-Herrera, M.A., Ouzounis, G.K., Scavazzon, M.,Soille, P., Syrris, V., Zanchetta, L., 2013. A global human settlement layer from optical HR/VHR RS data: concept and first results. Selected Topics in Applied Earth Observations and Remote Sensing, IEEE Journal of, vol.6, no.5, pp.2102,2131, Oct. 2013 doi: 10.1109/JSTARS.2013.2271445.
Ouzounis, G.K., Pesaresi, M., Soille, P., 2012. Differential area profiles: Decomposition properties and efficient computation,” Pattern Analy. Machine Intell., IEEE Trans. of, vol. 34, no. 8, pp. 1533–1548, 2012
Statistics South Africa (STATSSA), 2013. Census 2011, http://beta2.statssa.gov.za/ (24/03/2015).
United Nations Department of Economic and Social Affairs (UNDESA), 2014. World Urbanisation Prospects: The 2014 revision.http://www.un.org/en/development/desa/publications/2 014-revision-world-urbanization-prospects.html (24/03/2015).
van den Berg, E.C., Plarre, C., van den Berg, H.M., Thompson, M.W., 2008, The South African National Land Cover 2000. Report No. GW/A/2008/86, Agricultural Research Council - Institute for Soil, Climate and Water, Potchefstroom, South Africa.