ScienceDirect
Available online at www.sciencedirect.com
Procedia Computer Science 135 (2018) 377–384
1877-0509 © 2018 The Authors. Published by Elsevier Ltd.
This is an open access article under the CC BY-NC-ND license (https://creativecommons.org/licenses/by-nc-nd/4.0/)
Selection and peer-review under responsibility of the 3rd International Conference on Computer Science and Computational Intelligence 2018.
10.1016/j.procs.2018.08.188
© 2018 The Authors. Published by Elsevier Ltd.
This is an open access article under the CC BY-NC-ND license (https://creativecommons.org/licenses/by-nc-nd/4.0/)
Selection and peer-review under responsibility of the 3rd International Conference on Computer Science and Computational Intelligence 2018.
Intelligence 2018.
Keywords: Ecology; GLLVM; Negative Binomial; Show cave ; Wild Cave
1.Introduction
Ecology is fascinating to learn. Ecology can be related to wide sciences such as physics, biology, chemistry, mathematics, statistics and others. Ecology also includes physical factors such as temperature, light and other
ScienceDirect
3rd International Conference on Computer Science and Computational Intelligence 2018
Ecological Show Cave and Wild Cave: Negative Binomial Gllvm’s
Arthropod Community Modelling
Rezzy Eko Caraka
ab, Shamarina Shohaimi
a, Isma Dwi Kurniawan
c, Riki Herliansyah
d,
Arif Budiarto
be, Shinta Purnama Sari
b, Bens Pardamean
bfaInstitute for Mathematical Research (INSPEM),Universiti Putra Malaysia, Serdang,Selangor,43400 b Bioinformatics and Data Science Research Center, Bina Nusantara University, Jakarta, Indonesia, 11480
cDepartment of Biology, UIN Sunan Gunung Djati, Bandung
dDepartment of Mathematics, Kalimantan Institute of Technology (ITK), Kalimantan
eComputer Science Department, School of Computer Science, Bina Nusantara University,Jakarta, Indonesia, 11480
fComputer Science Department, BINUS Graduate Program – Master of Computer Science Bina Nusantara University, Jakarta, Indonesia, 11480
Abstract
materials that usually been studied in physics. At the same time, Ecology is also linked to the science of chemistry as well as the science of earth space. Concerning chemistry, ecology analyzes the synthesis process as well as the chemical events occurring within the body of the organism. Meanwhile, similar to the study of environmental, ecology also studies the seasons 1 sedimentation and others. Furthermore, if traced to the ecosystem, ecology is also related to
social science because it also discusses the populations and communities of organisms2. In ecological studies, a
thorough approach method is used in the corresponding components in a system. The scope of ecology revolves around the level of population, community, and ecosystem. One of interesting ecosystem is a cave with its variety of biotas. Arthropods are the most abundant biota group in the cave ecosystem. Howarth 3 explains that members of the phylum
Arthropoda namely Insecta, Myriapoda, and Arachnida many inhabit the terrestrial environment of the cave, while crustaceans live in many aquatic ecosystems of the cave. At least 90% of the total species belonged to troglobion (obligate cave) are from the Arthropod group 4.
Insect is a group of fauna with the highest diversity in the world. This group is known to have members of more than 1 million species that have been identified. Insect makes up more than 50% of the species composition on earth. This makes insects the most dominant group in almost all types of ecosystems, including cave ecosystems. Several groups of insects that are commonly found within the cave ecosystem are composed of members of the Collembola order, Diplura, Coleoptera, Microcoryphia, Thysanura, Ephemeroptera, Orthoptera, Dermaptera, Isoptera, Blattodea, Hemiptera, Thysanoptera, Psocoptera, and Phtiraptera5.
Arachnida is a class of arthropod with very diverse members. More than 93,000 species of Arachnida class members have been identified. This group is the Arthropoda with the richest 2nd species in the cave ecosystem after Insecta. The Arachnida class consists of 11 orders, and 9 of them are known to have representatives in the cave ecosystem. Arachnids often found in cave ecosystems are members of the Acari order, Araneae, Scorpionida, Pseudoscorpionida, Opilionida, Palpigradi, Ricinulei, Schizomida, and Amblypygi5. Myriapoda is a member of the
Arthropod whose body is elongated like a worm and has many pairs of legs. This triumph is known to be approximately 13,000 Myriapoda species that are still alive, and 300 of them are often found in cave ecosystems. This makes Myriapoda the Arthropod with the wealthiest third species in the cave ecosystem. Sub filum Myriapoda consists of 4 classes namely Chilopoda, Diplopoda, Pauropoda, and Symphyla. All these classes are known to have representatives in the cave ecosystem. In contrast to Insecta, Arachnida, and Myriapoda are abundant in terrestrial habitats, and more crustaceans live in the waters of the cave habitat. Until now, at least there are only two groups of crustaceans known to live in the terrestrial cave habitat of Isopoda (Oniscidea) and Amphipoda (Talitridae). From these two groups, Isopoda is a more adaptive known crustacean and is found in terrestrial cave habitats, especially in the Mediterranian and tropical regions. Arthropods are one of the groups of fauna that play an essential role in the cave ecosystem. This group plays a role in maintaining the continuity of the food webs and the balance of the cave ecosystem 6. According
to this, it is very interesting to know the distribution of species in the wild cave and tour cave. In this paper we use GLLVM which is a non-parametric method for mapping species in ecology and biodiversity studies
2.Generalized linear latent variable models (GLLVMs)
A recent popular statistical methodology for modelling data in ecology is latent variable models 78. Latent variable
models have an ability to study the interaction among species which is often the concern of a research, and the latent components in the model can be considered as missing predictors or unobserved quantities in environment 9.
Generalized linear latent variable models (GLLVMs) is such a model which has similar structures to Generalized linear model (GLM) besides that of latent variables 1011. Suppose 𝑌𝑌
𝑖𝑖𝑖𝑖 is the multivariate responses across species with
𝑖𝑖 = 1,2, … , 𝑛𝑛 being the observational units and 𝑗𝑗 = 1,2, … , 𝑝𝑝 being the number of species. The expectation of 𝑌𝑌𝑖𝑖𝑖𝑖 is
modeled through the following relationship
E(𝑌𝑌𝑖𝑖𝑖𝑖) = 𝜇𝜇𝑖𝑖𝑖𝑖 = 𝑔𝑔−1(𝜂𝜂𝑖𝑖𝑖𝑖) (1)
with 𝜂𝜂𝑖𝑖𝑖𝑖 being the linear predictor and 𝑔𝑔(. ) is a link function. Linear components of the predictor are similar to that of GLM with the inclusion of random effects as follows:
𝜂𝜂𝑖𝑖𝑖𝑖 = 𝛼𝛼𝑖𝑖+ 𝜷𝜷0𝑖𝑖+ 𝒙𝒙′𝑖𝑖𝜷𝜷𝑖𝑖+ 𝒖𝒖𝑖𝑖′𝝀𝝀𝑖𝑖 (2)
variables, 𝒙𝒙𝑖𝑖′, and 𝝀𝝀𝑖𝑖 is the loading factors or quantities describing the interactions across species and connecting the unobserved variables to responses. In many papers, the distributional choice of latent variables, 𝒖𝒖𝑖𝑖, is a normal distribution with mean zero and constant variance.
Like those procedures in GLM, we need to choose the link function and distributions for responses. The choice of link function was discussed in 12. 1For the distributional choice of the responses, Poisson distribution is an
obvious choice for counts type data. Negative binomial or zero-inflated Poisson13 are used for many zeros in data 7.
When the data are collected in the form of presence-only, binomial distribution is chosen to model the responses. For biomass data or non-negative values, 14 proposed the Tweedie distribution for an appropriate choice. Notably, for
count response type information criteria and mean-variance relationship can be considered for the selection of distributions15. The distribution of data conditional on latent variables is assumed to be from the exponential family
such that the marginal log-likelihood is defined by
ℓ(𝝎𝝎) = ∑𝑛𝑛𝑖𝑖=1log ∫ [∏𝑝𝑝𝑖𝑖=1exp (𝑦𝑦𝑖𝑖𝑖𝑖𝜃𝜃𝑖𝑖𝑖𝑖− 𝑏𝑏(𝜃𝜃𝑖𝑖𝑖𝑖) + 𝑐𝑐(𝑦𝑦𝑖𝑖𝑖𝑖))] ℎ(𝑢𝑢𝑖𝑖)𝑑𝑑𝑢𝑢 (3)
Where 𝝎𝝎contains lists of parameters to be estimated. The challenge in GLLVMs is that the integration part of the quation (2) cannot be solved explicitly. Some methods have been proposed to approximate the marginal likelihood function: 16 proposed Laplace approximation to estimate parameters of GLLVMs and compared the outcomes with
the traditional method, adaptive quadrature 17. In this paper, we use Laplace approximation using gllvm () package
designed especially for fitting GLLVMs. For more detail derivations of Laplace approximation can be seen in 14 and 16. Moreover, gllvm()18 is the only package available to model multivariate abundance data with various choice for
distributional responses.It was designed with the help of fast-automatic package, TMB.
3.Analysis
In this paper, we would like to know difference of species patterns among show and wild caves. The sampling of this research was conducted in Karst Gunungsewu area. Data collection was done in 3 show caves and 3 wild caves. Show caves consist of Gong, Tabuhan, and Semedi located in Pacitan District, East Java. Whilst, wild caves consist of Paesan in Gunungkidul Regency, Kalisat in Wonogiri Regency, and Ponjen in Pacitan Regency. Cave selection deliberately based on the resemblance of characters. All studied caves have horizontal and fossil These six caves are also classified as having relatively short with less than 200 m in lenghts 19. Kalisat is the only considered as a
combination cave because it has horizontal and vertical passages , but the sampling location in this cave is limited only to the horizontal aisle. The six caves are also located at a relatively high altitude, which is between 300-600 meters above sea level.
Gong and Tabuhan are caves that have been opened for long time as tourist attractions. These two show caves are a well-known tourist attractions and become one of the most significant revenue contributors for Pacitan regency
20. Gong and Tabuhan have many artificial changes that are deliberately done by the management to ensure the comfort
and safety of tourists and give value added to its object attraction. The management system of both caves are well organized since the local government fully manages these caves.
On the other hand, Semedi is classified as a relatively new show cave. This cave is developed and managed independently by the surrounding community. Lighting infrastructures have been installed inside this cave, but the duration rule lights up irregularly. Passages in some parts of this cave were initially narrow and difficult for humans to pass it 21. The community, as the local caretaker, was doing the excavation to enlarge these passages so that it can
be accessed by humans easily. One crucial thing encountered in this cave is that there were some camphor chalks in the dark zone. Camphor has a fragrance and contains naphthalene, a toxic compound for insects. The three wild caves included in this study have not been opened into a tourist attraction or other commercial activities. This makes the cave is not much or even not changed artificially. The intensity of human visits to these caves is low. Visits to the three caves are usually done by groups of activists and researchers. The conditions are slightly different in the Ponjen. Although it is classified as the wild cave and the intensity of human visit is low, historical information from cave community 21 states that it had been used as a refuge and hidden location in the era of colonization. This condition has
a significant number of bats initially inhabited the cave, but the number of bats decreased significantly after the colonial era. Additionally, the soil conditions of this cave floor tend to be denser compared to the other two wild caves.
Fig. 1. (a) Characteristics Cave based on Climatic; (b) Characteristics Cave based on edafic
Comparison from several point of view is provided to get better understanding of different characteristics between these two cave categories. Figure 1(a) demonstrates climatic parameter on six different caves. Measured climatic factors consist of air temperature, relative humidity, light intensity, and CO2 level. Based on the eigen plot in figure 1(a) we can see that there are three different types of groups: Group 1 (Gong), Group 2 (Kalisat, Paesan, Ponjen, Semedi) and group 3 (Tabuhan). This plot shows significant differences among all caves based on climatic criteria. Besides, all caves are also categorized based on edaphic factor as can be seen in Figure 1(b). The edaphic factor consists of soil pH, soil organic carbon (SOC), NNH4, P205, soil humidity and soil temperature. Based on the eigen plot in figure 1(b), there are three different types of groups based on edaphic factor: Group 1 (Gong), Group 2 (Kalisat, Paesan) and group 3 (Tabuhan, Ponjen, Semedi). It shows a quite similar result with previous categorization based on climatic factors as shown in figure 2.
Fig. 2. Characteristics Cave based on Climatic and Edaphic
Fig. 3. (a) Characteristics Species Based on Cave (b) Characteristics Species Based on Role
Furthermore, we can compare the distribution of species between wild cave and show cave as ca be seen in Figure 3(b). It shows us that wild caves have many decomposer when compared with show caves.
Specific to arthopods species, its number of species (counts) can be modelled by using a negative binomial distribution. Let 𝑦𝑦𝑖𝑖𝑖𝑖|𝑢𝑢𝑖𝑖 follow the negative binomial distribution with mean μ and variance 𝜇𝜇 + 𝛼𝛼𝜇𝜇2. By using the log link function, we have the same relationship between μ and 𝜈𝜈𝑖𝑖𝑖𝑖 like the Poisson model. The conditional distribution on 𝑢𝑢𝑖𝑖 is given by
Function of log-likelihood for negative binomial response can be written:
ℓ(𝝎𝝎) = ∑ (−12log det{−𝑝𝑝𝑝𝑝(𝝎𝝎, 𝑢𝑢̂𝑖𝑖)} + ∑ [𝑦𝑦𝑖𝑖𝑖𝑖log (1+𝛼𝛼𝛼𝛼𝑗𝑗exp(𝜈𝜈𝑗𝑗exp(𝜈𝜈𝑖𝑖𝑗𝑗𝑖𝑖𝑗𝑗))) −𝛼𝛼1𝑗𝑗log(1 + 𝛼𝛼𝑖𝑖exp(𝜈𝜈𝑖𝑖𝑖𝑖)) + log (
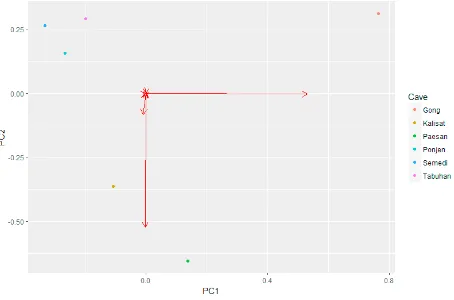
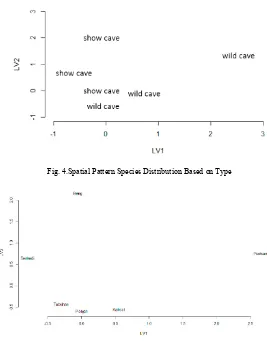
It is pretty similar to the principal component analysis; ordination arthopods species is used to explain the spatial pattern of species distributions. It is created using estimated latent variables by plotting them on two-dimensional axis22. Figure 4 and 5 shows the distribution of cave ecosystems presented for different caves and their
Fig. 4.Spatial Pattern Species Distribution Based on Type
Fig. 5.Spatial Pattern Species Distribution Based on Cave
Fig. 6. Spatial Pattern of Decomposer and Predator
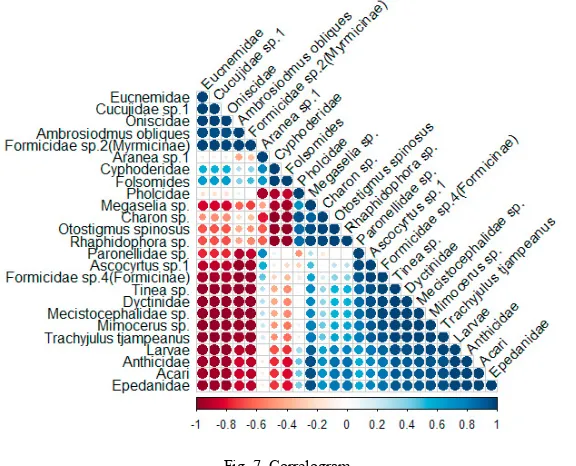
At the same time, we can also explain the interaction between species using loading factors presented in correlogram
23 in Figure 7. The negative correlations implies for a negative relationship between species; species tend to stay apart
from each other. The higher the correlations, the stronger the relationships.
Fig. 7. Correlogram
Conclusion
In this research, we successfully analysed abundant species in six different caves, categorized to 2 groups. We started this research by collecting the data for several factors in every cave. Climatic factors measurement were executed directly when taking data at each cave zonation. The intensity of the light was measured by the lux meter, the air temperature and humidity was measured by the logger, whereas the CO2 content was measured by CO2 meters.
thermometer. The collection of terrestrial arthropods was performed with three sampling techniques: hand collecting, pitfall trap, soil sampling to be extracted with Berlese-Tullgreen Extractor modification. In a nutshell, negative binomial GLVVM is able to explain community arthropods in different caves with AIC amount 774.4921,
Acknowledgements
This research is supported by Bioinformatics and Data Science Research Center, Bina Nusantara University and Institute for Mathematical Research (INSPEM) UPM and Department of Biology UPM. We thank to colleagues in Biospeleology Studdien Gruppen (BSG UNY) and Indonesian Speleological Society (ISS) for their helps in field work, to colleagues in Museum Zoologicum Bogoriense, Indonesia Research Institute (LIPI) for help in identification. In this paper we are using gllvm package in R, which developed by co-author Riki Herliansyah also statistical calculator STATCAL© by Prana Ugiana Gio and Rezzy Eko Caraka.
References
1. Caraka RE, Supari, Tahmid M. Copula-Based Model for Rainfall and El- Niño in Banyuwangi Indonesia. J Phys Conf Ser. 2018;1008(1).
2. Caraka RE, Yasin H. Geographically Weighted Regression (GWR) Sebuah Pendekatan Regresi Geografis [Internet]. 1st ed. MOBIUS
GRAHA ILMU; 2017. Available from: www.rezzyekocaraka.com/book
3. Howarth F. Encyclopedia of Insect Second Edition: Cave Insect. USA: Elsevier Inc.; 2009.
4. Pipan T, Culver DC. Estimating biodiversity in the epicarstic zone of a West Virginia cave. J Cave Karst Stud. 2005;67(2):103–9. 5. Romero A, Fenolio D. Cave biology: Life in darkness. Cave Biology: Life in Darkness. 2009. 1-303 p.
6. Rahmadi C. Troglobit: Penghuni Gua nan Gelap. National Geographic Indonesia. 2013.
7. Warton DI, Blanchet FG, O’Hara RB, Ovaskainen O, Taskinen S, Walker SC, et al. So Many Variables: Joint Modeling in Community Ecology. Vol. 30, Trends in Ecology and Evolution. 2015. p. 766–79.
8. Ovaskainen O, Abrego N, Halme P, Dunson D. Using latent variable models to identify large networks of species-to-species associations at different spatial scales. Methods Ecol Evol. 2015;549–55.
9. Jamilatuzzahro, Caraka RE, Herliansyah R. Aplikasi Generalized Linear Model dengan R [Internet]. 1st ed. Yogyakarta: INNOSAIN Graha Ilmu Yogyakarta; 2018. Available from: http://rezzyekocaraka.com/book/
10. Moustaki I. A latent trait and a latent class model for mixed observed variables. Br J Math Stat Psychol. 1996;49(2):313–34. 11. Jamilatuzzahro, Caraka RE. Modelling Inflation using Generalized Additive Mixed Models ( GAMM ). Int J Chem Math
Physics(IJCMP) [Internet]. 2017;1(1):39–73. Available from: http://aipublications.com/ijcmp/detail/modelling-inflation-using-generalized-additive-mixed-models-gamm/
12. Skrondal A, Rabe-Hesketh S. Generalized latent variable modeling [Internet]. multilevel longitudinal and structural equation models. 2004. 508 p. Available from: http://books.google.com/books?id=YUpDqCzb-WMC
13. Caraka RE, Tahmid M, Pardamean B. Sensitifitas dan Peringatan Dini Demam Berdarah Menggunakan Zero Truncated Model. In:
Prosiding Seminar Hari Meteorologi Dunia ke-67 Tahun 2017 Understanding Weather and Climate for Sustainibility. Tangerang Selatan: Sekolah Tinggi Meteorologi Klimatologi dan Geofisika (STMKG); 2017. p. 344–53.
14. Niku J, Warton DI, Hui FKC, Taskinen S. Generalized Linear Latent Variable Models for Multivariate Count and Biomass Data in Ecology. J Agric Biol Environ Stat. 2017;22(4):498–522.
15. Warton DI. Many zeros does not mean zero inflation: Comparing the goodness-of-fit of parametric models to multivariate abundance data. Environmetrics. 2005;16(3):275–89.
16. Huber P, Ronchetti E, Victoria-Feser M-P. Estimation of generalized linear latent variable models. J R Stat Soc Ser B (Statistical Methodol [Internet]. 2004;66(4):893–908. Available from:
http://dx.doi.org/10.1111/j.1467-9868.2004.05627.x%5Cnpapers2://publication/doi/10.1111/j.1467-9868.2004.05627.x
17. Bianconcini S, Cagnone S. Estimation of generalized linear latent variable models via fully exponential Laplace approximation. J Multivar Anal. 2012;112:183–93.
18. Niku J, Brooks W, Herliansyah R, Hui FKC, Taskinen S, Warton DI, et al. Package ‘gllvm.’ R Project; 2017.
19. Kurniawan ID, Rahmadi C, Caraka RE, Ardi TA. Short Communication: Cave-dwelling Arthropod community of Semedi Show Cave
in Gunungsewu Karst Area, Pacitan, East Java, Indonesia. Biodiversitas. 2018;19(3):857–66.
20. Kurniawan ID, Soesilhadi HRC, Rahmadi C, Caraka RE, Pardamean B. The difference on Arthropod communities’ structure within show caves and wild caves in Gunungsewu karst area, Indonesia. Int journal-Ecology, Environ Conserv. 2018;24(1):81–90. 21. Kurniawan ID, Rahmadi C, Ardi TA, Nasrullah R, Willyanto MI, Rahayu S. The Detection of Human Activities’ Impact on Show
Caves Environment in Pacitan, Indonesia. In: Moore K, White S, editors. 17th INTERNATIONAL CONGRESS OF SPELEOLOGY. Sydney: Australian Speleological Federation Inc. Sydney; 2017. p. 175–8.
22. Caraka RE, Yasin H. Spatial Data Panel [Internet]. 1st ed. Wade Group; 2018. Available from: http://rezzyekocaraka.com/book
23. Caraka RE, Saputra PAM, Wijaya N, Ulkhaq MM, Subair M. Postal and Trade Network Data within ASEAN Countries and Beyond. J