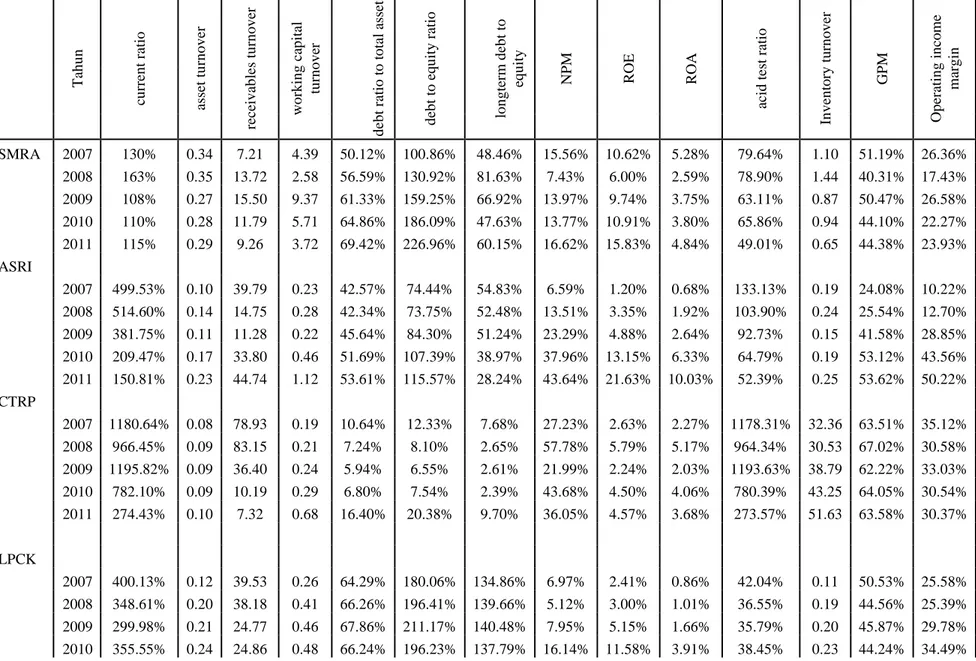
Tabel rata –rata rasio dan rata rata industri T ah u n cu rr en t ra ti o as se t tu rn o v er re ce iv ab le s tu rn o v er w o rk in g c ap it al tu rn o v er d eb t ra ti o t o t o ta l as se t d eb t to e q u it y r at io lo n g te rm d eb t to eq u it y N P M R O E R O A ac id t es t ra ti o In v en to ry t u rn o v er G P M O p er at in g i n co m e m ar g in SMRA 2007 130% 0.34 7.21 4.39 50.12% 100.86% 48.46% 15.56% 10.62% 5.28% 79.64% 1.10 51.19% 26.36% 2008 163% 0.35 13.72 2.58 56.59% 130.92% 81.63% 7.43% 6.00% 2.59% 78.90% 1.44 40.31% 17.43% 2009 108% 0.27 15.50 9.37 61.33% 159.25% 66.92% 13.97% 9.74% 3.75% 63.11% 0.87 50.47% 26.58% 2010 110% 0.28 11.79 5.71 64.86% 186.09% 47.63% 13.77% 10.91% 3.80% 65.86% 0.94 44.10% 22.27% 2011 115% 0.29 9.26 3.72 69.42% 226.96% 60.15% 16.62% 15.83% 4.84% 49.01% 0.65 44.38% 23.93% ASRI 2007 499.53% 0.10 39.79 0.23 42.57% 74.44% 54.83% 6.59% 1.20% 0.68% 133.13% 0.19 24.08% 10.22% 2008 514.60% 0.14 14.75 0.28 42.34% 73.75% 52.48% 13.51% 3.35% 1.92% 103.90% 0.24 25.54% 12.70% 2009 381.75% 0.11 11.28 0.22 45.64% 84.30% 51.24% 23.29% 4.88% 2.64% 92.73% 0.15 41.58% 28.85% 2010 209.47% 0.17 33.80 0.46 51.69% 107.39% 38.97% 37.96% 13.15% 6.33% 64.79% 0.19 53.12% 43.56% 2011 150.81% 0.23 44.74 1.12 53.61% 115.57% 28.24% 43.64% 21.63% 10.03% 52.39% 0.25 53.62% 50.22% CTRP 2007 1180.64% 0.08 78.93 0.19 10.64% 12.33% 7.68% 27.23% 2.63% 2.27% 1178.31% 32.36 63.51% 35.12% 2008 966.45% 0.09 83.15 0.21 7.24% 8.10% 2.65% 57.78% 5.79% 5.17% 964.34% 30.53 67.02% 30.58% 2009 1195.82% 0.09 36.40 0.24 5.94% 6.55% 2.61% 21.99% 2.24% 2.03% 1193.63% 38.79 62.22% 33.03% 2010 782.10% 0.09 10.19 0.29 6.80% 7.54% 2.39% 43.68% 4.50% 4.06% 780.39% 43.25 64.05% 30.54% 2011 274.43% 0.10 7.32 0.68 16.40% 20.38% 9.70% 36.05% 4.57% 3.68% 273.57% 51.63 63.58% 30.37% LPCK 2007 400.13% 0.12 39.53 0.26 64.29% 180.06% 134.86% 6.97% 2.41% 0.86% 42.04% 0.11 50.53% 25.58% 2008 348.61% 0.20 38.18 0.41 66.26% 196.41% 139.66% 5.12% 3.00% 1.01% 36.55% 0.19 44.56% 25.39% 2009 299.98% 0.21 24.77 0.46 67.86% 211.17% 140.48% 7.95% 5.15% 1.66% 35.79% 0.20 45.87% 29.78% 2010 355.55% 0.24 24.86 0.48 66.24% 196.23% 137.79% 16.14% 11.58% 3.91% 38.45% 0.23 44.24% 34.49%
2011 345.90% 0.44 8.23 0.85 59.77% 148.58% 95.73% 28.55% 31.37% 12.62% 32.80% 0.43 43.09% 38.05% MDLN 2007 216.63% 0.15 5.59 0.69 57.55% 135.56% 91.55% 11.60% 4.08% 1.73% 160.38% 0.92 34.27% 13.55% 2008 143.51% 0.11 2.38 1.12 43.60% 77.30% 36.35% 1.15% 0.23% 0.13% 86.19% 0.59 53.28% 16.53% 2009 112.19% 0.15 3.87 5.11 41.06% 69.65% 29.30% 0.90% 0.23% 0.13% 61.04% 0.13 58.11% 32.91% 2010 134.45% 0.11 6.25 1.39 45.24% 82.63% 39.60% 16.85% 3.47% 1.90% 87.84% 0.55 61.56% 35.81% 2011 111.19% 0.19 6.81 5.04 50.77% 103.14% 34.51% 20.05% 7.76% 3.82% 54.33% 0.82 58.09% 32.69% rata2 industri 2007 485% 0.16 34.21 1.15 45% 101% 67% 14% 4% 2.16% 319% 6.94 44.72% 22.17% 2008 427% 0.18 30.44 0.92 43% 97% 63% 17% 4% 2.17% 254% 6.60 46.14% 20.53% 2009 420% 0.17 18.36 3.08 44% 106% 58% 14% 4% 2.04% 289% 8.03 51.65% 30.23% 2010 318% 0.18 17.38 1.67 47% 116% 53% 26% 9% 4.00% 207% 9.03 53.41% 33.33% 2011 200% 0.25 15.27 2.28 50% 123% 46% 29% 16% 7.00% 92% 10.76 52.55% 35.05%
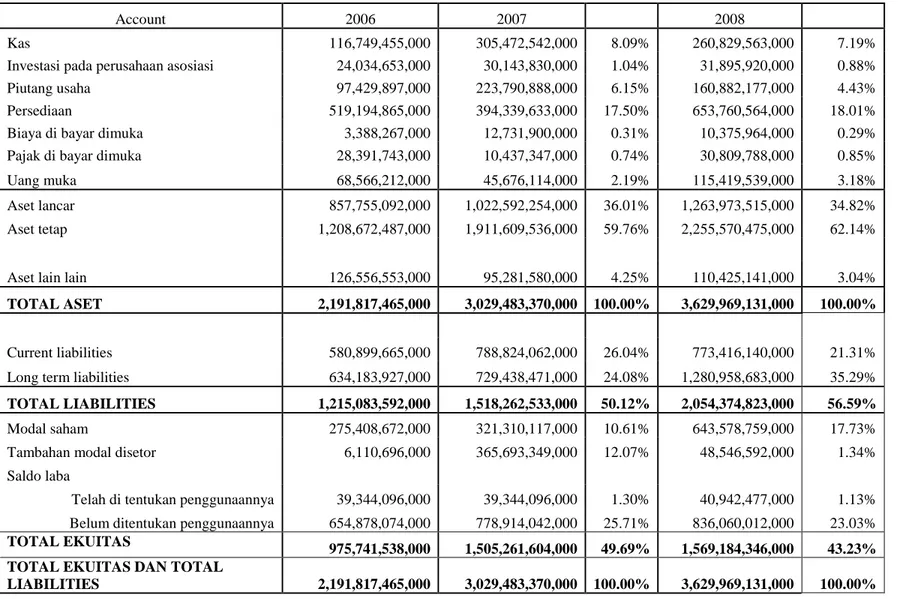
Tabel Analisis Vertikal – Balance sheet tahun 2007-2008
Account 2006 2007 2008
Kas 116,749,455,000 305,472,542,000 8.09% 260,829,563,000 7.19%
Investasi pada perusahaan asosiasi 24,034,653,000 30,143,830,000 1.04% 31,895,920,000 0.88%
Piutang usaha 97,429,897,000 223,790,888,000 6.15% 160,882,177,000 4.43%
Persediaan 519,194,865,000 394,339,633,000 17.50% 653,760,564,000 18.01%
Biaya di bayar dimuka 3,388,267,000 12,731,900,000 0.31% 10,375,964,000 0.29%
Pajak di bayar dimuka 28,391,743,000 10,437,347,000 0.74% 30,809,788,000 0.85%
Uang muka 68,566,212,000 45,676,114,000 2.19% 115,419,539,000 3.18%
Aset lancar 857,755,092,000 1,022,592,254,000 36.01% 1,263,973,515,000 34.82%
Aset tetap 1,208,672,487,000 1,911,609,536,000 59.76% 2,255,570,475,000 62.14%
Aset lain lain 126,556,553,000 95,281,580,000 4.25% 110,425,141,000 3.04%
TOTAL ASET 2,191,817,465,000 3,029,483,370,000 100.00% 3,629,969,131,000 100.00%
Current liabilities 580,899,665,000 788,824,062,000 26.04% 773,416,140,000 21.31%
Long term liabilities 634,183,927,000 729,438,471,000 24.08% 1,280,958,683,000 35.29%
TOTAL LIABILITIES 1,215,083,592,000 1,518,262,533,000 50.12% 2,054,374,823,000 56.59%
Modal saham 275,408,672,000 321,310,117,000 10.61% 643,578,759,000 17.73%
Tambahan modal disetor 6,110,696,000 365,693,349,000 12.07% 48,546,592,000 1.34%
Saldo laba
Telah di tentukan penggunaannya 39,344,096,000 39,344,096,000 1.30% 40,942,477,000 1.13%
Belum ditentukan penggunaannya 654,878,074,000 778,914,042,000 25.71% 836,060,012,000 23.03%
TOTAL EKUITAS 975,741,538,000 1,505,261,604,000 49.69% 1,569,184,346,000 43.23% TOTAL EKUITAS DAN TOTAL
Tabel Analisis Vertikal – Balance Sheet Tahun 2009 – 2011
Account 2009 2010 2011
Kas 633,169,242,000 14.20% 1,120,483,310,000 18.25% 1,495,900,816,000 18.47%
Investasi pada perusahaan asosiasi 10,851,388,000 0.24% 4,029,276,000 0.07% 3,698,761,000 0.05%
Piutang usaha 136,159,404,000 5.17% 216,974,002,000 3.53% 77,041,504,000 0.95%
Persediaan 712,901,120,000 27.06% 1,308,433,357,000 21.31% 2,741,082,409,000 33.84%
Biaya di bayar dimuka 5,549,764,000 3.26% 5,796,136,000 0.09% 12,649,470,000 0.16%
Pajak di bayar dimuka 85,971,792,000 1.93% 135,113,485,000 2.20% 211,933,572,000 2.62%
Uang muka 129,200,350,000 2.90% 468,937,425,000 7.64% 223,937,375,000 2.76%
Aset lancar 1,713,803,060,000 38.42% 3,259,766,991,000 53.09% 4,766,243,907,000 58.85%
Aset tetap 2,634,905,625,000 59.07% 2,761,504,769,000 44.98% 3,078,161,594,000 38.01%
Aset lain lain 111,568,521,000 2.50% 118,368,678,000 1.93% 254,769,180,000 3.15%
TOTAL ASET 4,460,277,206,000 100.00% 6,139,640,438,000 100.00% 8,099,174,681,000 100.00%
Current liabilities 1,585,947,893,000 35.56% 2,962,805,696,000 48.26% 4,132,173,752,000 51.02%
Long term liabilities 1,149,531,285,000 25.77% 1,019,301,314,000 16.60% 1,489,900,979,000 18.40%
TOTAL LIABILITIES 2,735,479,178,000 61.33% 3,982,107,010,000 64.86% 5,622,074,731,000 69.42%
Modal saham 643,680,064,000 14.43% 687,314,084,000 11.19% 687,314,084,000 8.49%
Tambahan modal disetor 49,002,463,000 1.10% 245,355,554,000 4.00% 245,355,554,000 3.03%
Saldo laba
Telah di tentukan penggunaannya 41,883,927,000 0.94% 43,557,354,000 0.71% 45,892,133,000 0.57%
Belum ditentukan penggunaannya 983,153,942,000 22.04% 1,163,603,329,000 18.95% 1,485,577,897,000 18.34%
TOTAL EKUITAS 1,717,776,902,000 38.51% 2,139,886,827,000 34.85% 2,464,196,174,000 30.43% TOTAL EKUITAS DAN TOTAL
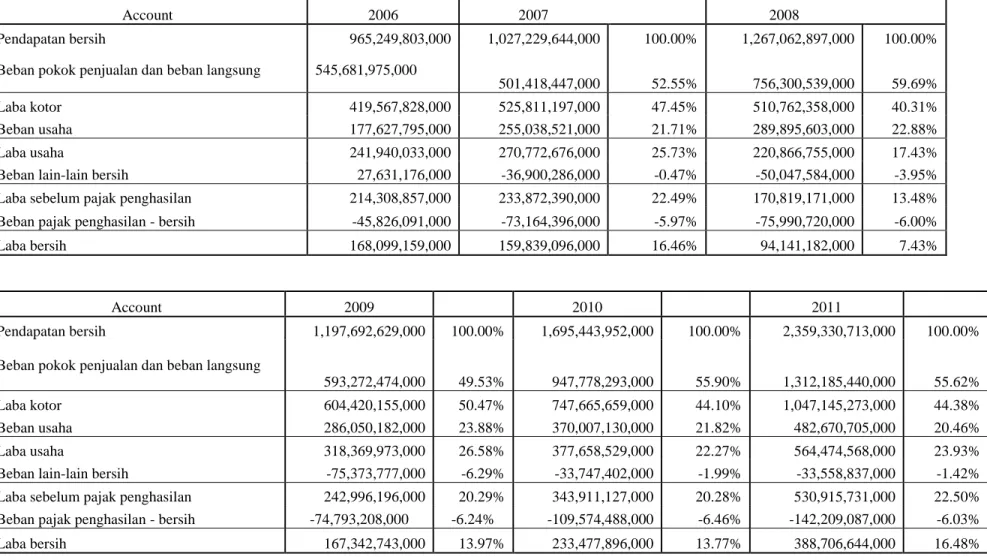
Tabel Analisis Vertikal Income Statement 2007 – 2011
Account 2009 2010 2011
Pendapatan bersih 1,197,692,629,000 100.00% 1,695,443,952,000 100.00% 2,359,330,713,000 100.00%
Beban pokok penjualan dan beban langsung
593,272,474,000 49.53% 947,778,293,000 55.90% 1,312,185,440,000 55.62%
Laba kotor 604,420,155,000 50.47% 747,665,659,000 44.10% 1,047,145,273,000 44.38%
Beban usaha 286,050,182,000 23.88% 370,007,130,000 21.82% 482,670,705,000 20.46%
Laba usaha 318,369,973,000 26.58% 377,658,529,000 22.27% 564,474,568,000 23.93%
Beban lain-lain bersih -75,373,777,000 -6.29% -33,747,402,000 -1.99% -33,558,837,000 -1.42%
Laba sebelum pajak penghasilan 242,996,196,000 20.29% 343,911,127,000 20.28% 530,915,731,000 22.50%
Beban pajak penghasilan - bersih -74,793,208,000 -6.24% -109,574,488,000 -6.46% -142,209,087,000 -6.03%
Laba bersih 167,342,743,000 13.97% 233,477,896,000 13.77% 388,706,644,000 16.48%
Account 2006 2007 2008
Pendapatan bersih 965,249,803,000 1,027,229,644,000 100.00% 1,267,062,897,000 100.00%
Beban pokok penjualan dan beban langsung 545,681,975,000
501,418,447,000 52.55% 756,300,539,000 59.69%
Laba kotor 419,567,828,000 525,811,197,000 47.45% 510,762,358,000 40.31%
Beban usaha 177,627,795,000 255,038,521,000 21.71% 289,895,603,000 22.88%
Laba usaha 241,940,033,000 270,772,676,000 25.73% 220,866,755,000 17.43%
Beban lain-lain bersih 27,631,176,000 -36,900,286,000 -0.47% -50,047,584,000 -3.95%
Laba sebelum pajak penghasilan 214,308,857,000 233,872,390,000 22.49% 170,819,171,000 13.48%
Beban pajak penghasilan - bersih -45,826,091,000 -73,164,396,000 -5.97% -75,990,720,000 -6.00%
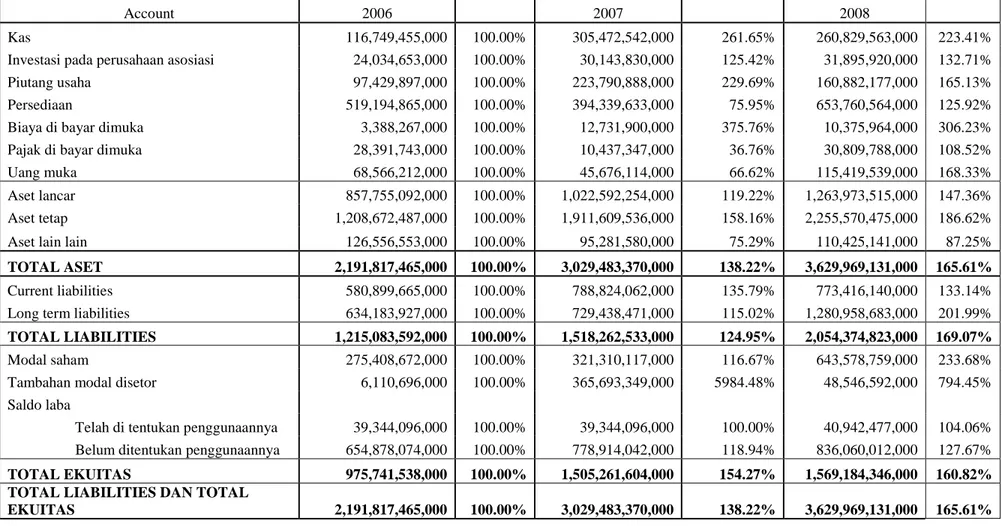
Tabel Analisis Horizontal – Balance Sheet 2007-2008
Account 2006 2007 2008
Kas 116,749,455,000 100.00% 305,472,542,000 261.65% 260,829,563,000 223.41%
Investasi pada perusahaan asosiasi 24,034,653,000 100.00% 30,143,830,000 125.42% 31,895,920,000 132.71%
Piutang usaha 97,429,897,000 100.00% 223,790,888,000 229.69% 160,882,177,000 165.13%
Persediaan 519,194,865,000 100.00% 394,339,633,000 75.95% 653,760,564,000 125.92%
Biaya di bayar dimuka 3,388,267,000 100.00% 12,731,900,000 375.76% 10,375,964,000 306.23%
Pajak di bayar dimuka 28,391,743,000 100.00% 10,437,347,000 36.76% 30,809,788,000 108.52%
Uang muka 68,566,212,000 100.00% 45,676,114,000 66.62% 115,419,539,000 168.33%
Aset lancar 857,755,092,000 100.00% 1,022,592,254,000 119.22% 1,263,973,515,000 147.36%
Aset tetap 1,208,672,487,000 100.00% 1,911,609,536,000 158.16% 2,255,570,475,000 186.62%
Aset lain lain 126,556,553,000 100.00% 95,281,580,000 75.29% 110,425,141,000 87.25%
TOTAL ASET 2,191,817,465,000 100.00% 3,029,483,370,000 138.22% 3,629,969,131,000 165.61%
Current liabilities 580,899,665,000 100.00% 788,824,062,000 135.79% 773,416,140,000 133.14%
Long term liabilities 634,183,927,000 100.00% 729,438,471,000 115.02% 1,280,958,683,000 201.99%
TOTAL LIABILITIES 1,215,083,592,000 100.00% 1,518,262,533,000 124.95% 2,054,374,823,000 169.07%
Modal saham 275,408,672,000 100.00% 321,310,117,000 116.67% 643,578,759,000 233.68%
Tambahan modal disetor 6,110,696,000 100.00% 365,693,349,000 5984.48% 48,546,592,000 794.45%
Saldo laba
Telah di tentukan penggunaannya 39,344,096,000 100.00% 39,344,096,000 100.00% 40,942,477,000 104.06%
Belum ditentukan penggunaannya 654,878,074,000 100.00% 778,914,042,000 118.94% 836,060,012,000 127.67%
TOTAL EKUITAS 975,741,538,000 100.00% 1,505,261,604,000 154.27% 1,569,184,346,000 160.82% TOTAL LIABILITIES DAN TOTAL
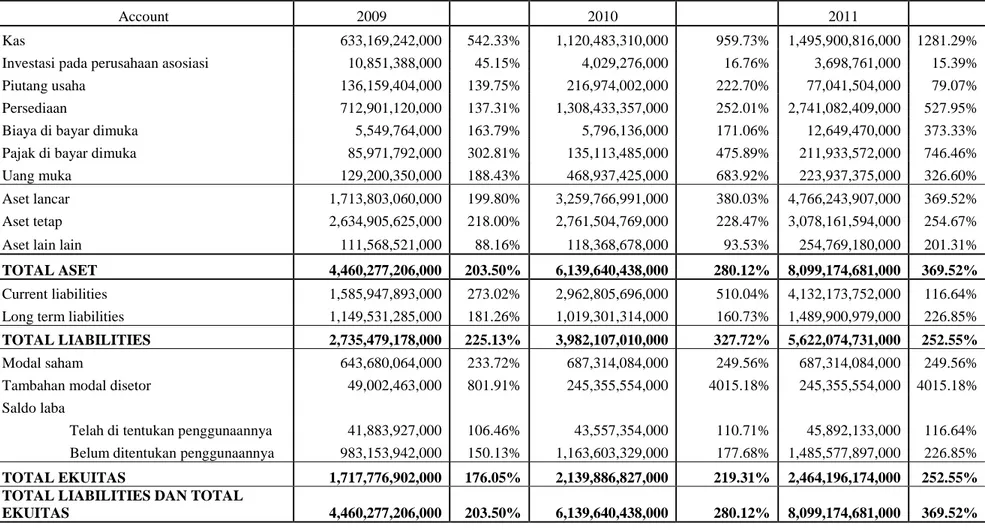
Tabel Analisis Horizontal – Balance Sheet 2009-2011
Account 2009 2010 2011
Kas 633,169,242,000 542.33% 1,120,483,310,000 959.73% 1,495,900,816,000 1281.29%
Investasi pada perusahaan asosiasi 10,851,388,000 45.15% 4,029,276,000 16.76% 3,698,761,000 15.39%
Piutang usaha 136,159,404,000 139.75% 216,974,002,000 222.70% 77,041,504,000 79.07%
Persediaan 712,901,120,000 137.31% 1,308,433,357,000 252.01% 2,741,082,409,000 527.95%
Biaya di bayar dimuka 5,549,764,000 163.79% 5,796,136,000 171.06% 12,649,470,000 373.33%
Pajak di bayar dimuka 85,971,792,000 302.81% 135,113,485,000 475.89% 211,933,572,000 746.46%
Uang muka 129,200,350,000 188.43% 468,937,425,000 683.92% 223,937,375,000 326.60%
Aset lancar 1,713,803,060,000 199.80% 3,259,766,991,000 380.03% 4,766,243,907,000 369.52%
Aset tetap 2,634,905,625,000 218.00% 2,761,504,769,000 228.47% 3,078,161,594,000 254.67%
Aset lain lain 111,568,521,000 88.16% 118,368,678,000 93.53% 254,769,180,000 201.31%
TOTAL ASET 4,460,277,206,000 203.50% 6,139,640,438,000 280.12% 8,099,174,681,000 369.52%
Current liabilities 1,585,947,893,000 273.02% 2,962,805,696,000 510.04% 4,132,173,752,000 116.64%
Long term liabilities 1,149,531,285,000 181.26% 1,019,301,314,000 160.73% 1,489,900,979,000 226.85%
TOTAL LIABILITIES 2,735,479,178,000 225.13% 3,982,107,010,000 327.72% 5,622,074,731,000 252.55%
Modal saham 643,680,064,000 233.72% 687,314,084,000 249.56% 687,314,084,000 249.56%
Tambahan modal disetor 49,002,463,000 801.91% 245,355,554,000 4015.18% 245,355,554,000 4015.18%
Saldo laba
Telah di tentukan penggunaannya 41,883,927,000 106.46% 43,557,354,000 110.71% 45,892,133,000 116.64%
Belum ditentukan penggunaannya 983,153,942,000 150.13% 1,163,603,329,000 177.68% 1,485,577,897,000 226.85%
TOTAL EKUITAS 1,717,776,902,000 176.05% 2,139,886,827,000 219.31% 2,464,196,174,000 252.55% TOTAL LIABILITIES DAN TOTAL
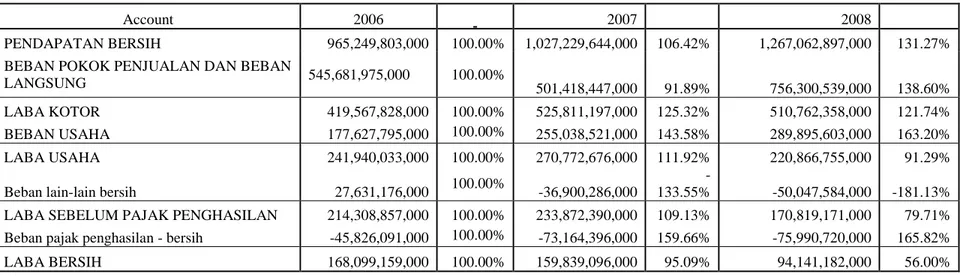
Tabel Analisis Horizontal – Income Statement 2007 - 2011
Account 2006 2007 2008
PENDAPATAN BERSIH 965,249,803,000 100.00% 1,027,229,644,000 106.42% 1,267,062,897,000 131.27%
BEBAN POKOK PENJUALAN DAN BEBAN
LANGSUNG 545,681,975,000 100.00% 501,418,447,000 91.89% 756,300,539,000 138.60%
LABA KOTOR 419,567,828,000 100.00% 525,811,197,000 125.32% 510,762,358,000 121.74%
BEBAN USAHA 177,627,795,000 100.00% 255,038,521,000 143.58% 289,895,603,000 163.20%
LABA USAHA 241,940,033,000 100.00% 270,772,676,000 111.92% 220,866,755,000 91.29%
Beban lain-lain bersih 27,631,176,000 100.00% -36,900,286,000
-133.55% -50,047,584,000 -181.13%
LABA SEBELUM PAJAK PENGHASILAN 214,308,857,000 100.00% 233,872,390,000 109.13% 170,819,171,000 79.71%
Beban pajak penghasilan - bersih -45,826,091,000 100.00% -73,164,396,000 159.66% -75,990,720,000 165.82%
LABA BERSIH 168,099,159,000 100.00% 159,839,096,000 95.09% 94,141,182,000 56.00%
Account 2009 2010 2011
PENDAPATAN BERSIH 1,197,692,629,000 124.08% 1,695,443,952,000 175.65% 2,359,330,713,000 244.43%
BEBAN POKOK PENJUALAN DAN BEBAN
LANGSUNG 593,272,474,000 108.72% 947,778,293,000 173.69% 1,312,185,440,000 240.47%
LABA KOTOR 604,420,155,000 144.06% 747,665,659,000 178.20% 1,047,145,273,000 249.58%
BEBAN USAHA 286,050,182,000 161.04% 370,007,130,000 208.30% 482,670,705,000 271.73%
LABA USAHA 318,369,973,000 131.59% 377,658,529,000 156.10% 564,474,568,000 233.31%
Beban lain-lain bersih -75,373,777,000 -272.79% -33,747,402,000
-122.14% -33,558,837,000
-121.45%
LABA SEBELUM PAJAK PENGHASILAN 242,996,196,000 113.39% 343,911,127,000 160.47% 530,915,731,000 247.73%
Beban pajak penghasilan - bersih -74,793,208,000 163.21% -109,574,488,000 239.11% -142,209,087,000 310.32%
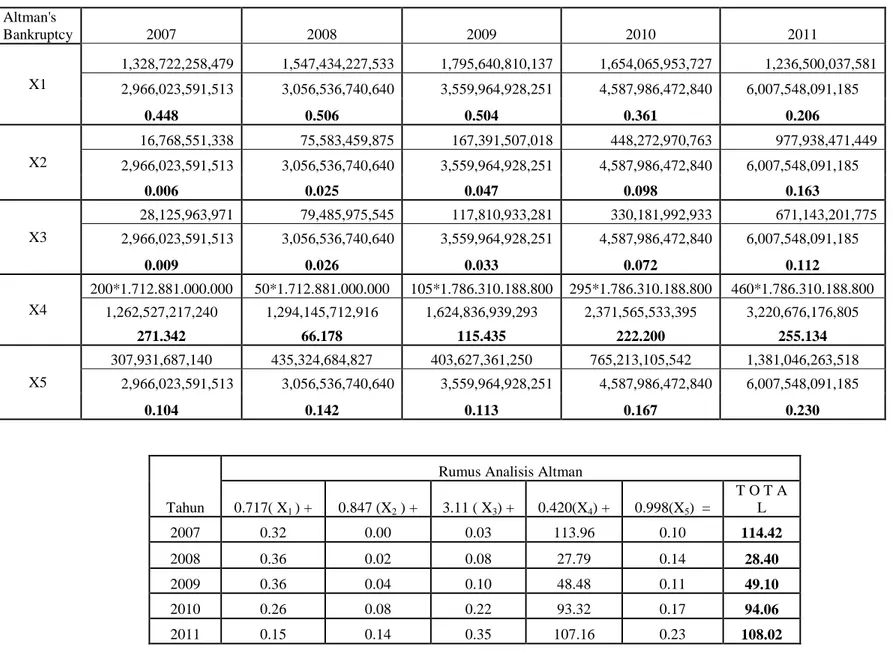
Tabel analisis kebangkrutan PT.Alam Sutera Realty, Tbk pada tahun 2007-2011 Altman's Bankruptcy 2007 2008 2009 2010 2011 X1 1,328,722,258,479 1,547,434,227,533 1,795,640,810,137 1,654,065,953,727 1,236,500,037,581 2,966,023,591,513 3,056,536,740,640 3,559,964,928,251 4,587,986,472,840 6,007,548,091,185 0.448 0.506 0.504 0.361 0.206 X2 16,768,551,338 75,583,459,875 167,391,507,018 448,272,970,763 977,938,471,449 2,966,023,591,513 3,056,536,740,640 3,559,964,928,251 4,587,986,472,840 6,007,548,091,185 0.006 0.025 0.047 0.098 0.163 X3 28,125,963,971 79,485,975,545 117,810,933,281 330,181,992,933 671,143,201,775 2,966,023,591,513 3,056,536,740,640 3,559,964,928,251 4,587,986,472,840 6,007,548,091,185 0.009 0.026 0.033 0.072 0.112 X4 200*1.712.881.000.000 50*1.712.881.000.000 105*1.786.310.188.800 295*1.786.310.188.800 460*1.786.310.188.800 1,262,527,217,240 1,294,145,712,916 1,624,836,939,293 2,371,565,533,395 3,220,676,176,805 271.342 66.178 115.435 222.200 255.134 X5 307,931,687,140 435,324,684,827 403,627,361,250 765,213,105,542 1,381,046,263,518 2,966,023,591,513 3,056,536,740,640 3,559,964,928,251 4,587,986,472,840 6,007,548,091,185 0.104 0.142 0.113 0.167 0.230 Tahun
Rumus Analisis Altman
0.717( X1 ) + 0.847 (X2 ) + 3.11 ( X3) + 0.420(X4) + 0.998(X5) = T O T A L 2007 0.32 0.00 0.03 113.96 0.10 114.42 2008 0.36 0.02 0.08 27.79 0.14 28.40 2009 0.36 0.04 0.10 48.48 0.11 49.10 2010 0.26 0.08 0.22 93.32 0.17 94.06 2011 0.15 0.14 0.35 107.16 0.23 108.02
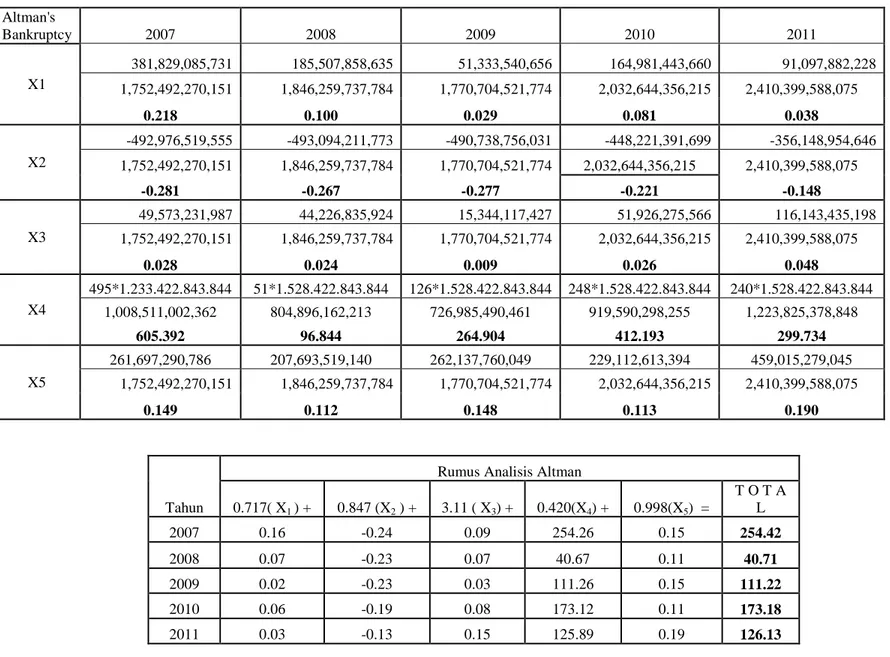
Tabel analisis kebangkrutan PT.Modernland Realty, Tbk pada tahun 2007-2011 Altman's Bankruptcy 2007 2008 2009 2010 2011 X1 381,829,085,731 185,507,858,635 51,333,540,656 164,981,443,660 91,097,882,228 1,752,492,270,151 1,846,259,737,784 1,770,704,521,774 2,032,644,356,215 2,410,399,588,075 0.218 0.100 0.029 0.081 0.038 X2 -492,976,519,555 -493,094,211,773 -490,738,756,031 -448,221,391,699 -356,148,954,646 1,752,492,270,151 1,846,259,737,784 1,770,704,521,774 2,032,644,356,215 2,410,399,588,075 -0.281 -0.267 -0.277 -0.221 -0.148 X3 49,573,231,987 44,226,835,924 15,344,117,427 51,926,275,566 116,143,435,198 1,752,492,270,151 1,846,259,737,784 1,770,704,521,774 2,032,644,356,215 2,410,399,588,075 0.028 0.024 0.009 0.026 0.048 X4 495*1.233.422.843.844 51*1.528.422.843.844 126*1.528.422.843.844 248*1.528.422.843.844 240*1.528.422.843.844 1,008,511,002,362 804,896,162,213 726,985,490,461 919,590,298,255 1,223,825,378,848 605.392 96.844 264.904 412.193 299.734 X5 261,697,290,786 207,693,519,140 262,137,760,049 229,112,613,394 459,015,279,045 1,752,492,270,151 1,846,259,737,784 1,770,704,521,774 2,032,644,356,215 2,410,399,588,075 0.149 0.112 0.148 0.113 0.190 Tahun
Rumus Analisis Altman
0.717( X1 ) + 0.847 (X2 ) + 3.11 ( X3) + 0.420(X4) + 0.998(X5) = T O T A L 2007 0.16 -0.24 0.09 254.26 0.15 254.42 2008 0.07 -0.23 0.07 40.67 0.11 40.71 2009 0.02 -0.23 0.03 111.26 0.15 111.22 2010 0.06 -0.19 0.08 173.12 0.11 173.18 2011 0.03 -0.13 0.15 125.89 0.19 126.13
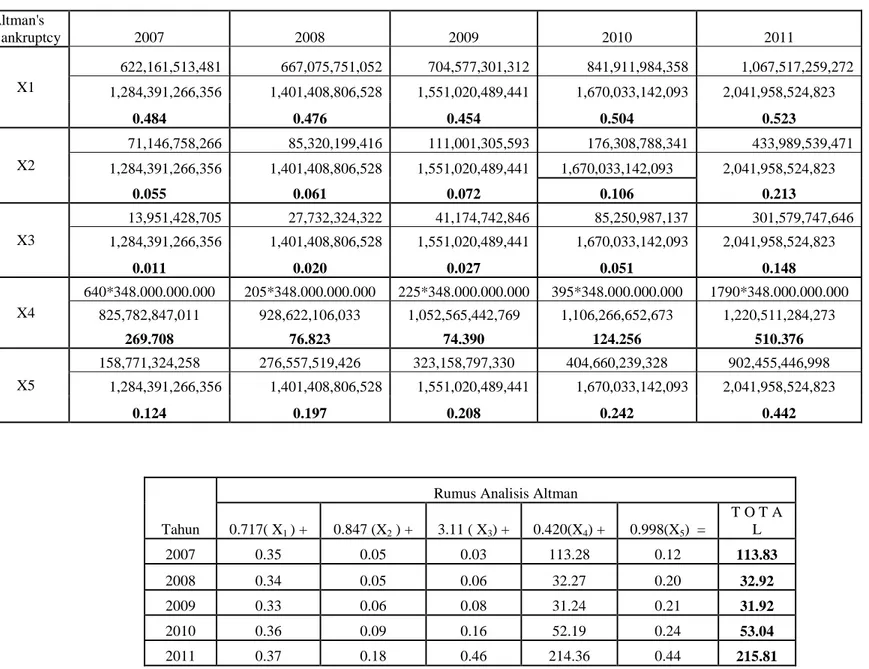
Tabel analisis kebangkrutan PT.Lippo Cikarang, Tbk pada tahun 2007-2011 Altman's Bankruptcy 2007 2008 2009 2010 2011 X1 622,161,513,481 667,075,751,052 704,577,301,312 841,911,984,358 1,067,517,259,272 1,284,391,266,356 1,401,408,806,528 1,551,020,489,441 1,670,033,142,093 2,041,958,524,823 0.484 0.476 0.454 0.504 0.523 X2 71,146,758,266 85,320,199,416 111,001,305,593 176,308,788,341 433,989,539,471 1,284,391,266,356 1,401,408,806,528 1,551,020,489,441 1,670,033,142,093 2,041,958,524,823 0.055 0.061 0.072 0.106 0.213 X3 13,951,428,705 27,732,324,322 41,174,742,846 85,250,987,137 301,579,747,646 1,284,391,266,356 1,401,408,806,528 1,551,020,489,441 1,670,033,142,093 2,041,958,524,823 0.011 0.020 0.027 0.051 0.148 X4 640*348.000.000.000 205*348.000.000.000 225*348.000.000.000 395*348.000.000.000 1790*348.000.000.000 825,782,847,011 928,622,106,033 1,052,565,442,769 1,106,266,652,673 1,220,511,284,273 269.708 76.823 74.390 124.256 510.376 X5 158,771,324,258 276,557,519,426 323,158,797,330 404,660,239,328 902,455,446,998 1,284,391,266,356 1,401,408,806,528 1,551,020,489,441 1,670,033,142,093 2,041,958,524,823 0.124 0.197 0.208 0.242 0.442 Tahun
Rumus Analisis Altman
0.717( X1 ) + 0.847 (X2 ) + 3.11 ( X3) + 0.420(X4) + 0.998(X5) = T O T A L 2007 0.35 0.05 0.03 113.28 0.12 113.83 2008 0.34 0.05 0.06 32.27 0.20 32.92 2009 0.33 0.06 0.08 31.24 0.21 31.92 2010 0.36 0.09 0.16 52.19 0.24 53.04 2011 0.37 0.18 0.46 214.36 0.44 215.81
Tabel analisis kebangkrutan PT.Ciputra Realty, Tbk pada tahun 2007-2011 Altman's Bankruptcy 2007 2008 2009 2010 2011 X1 1,532,033,672,803 1,528,970,428,225 1,430,133,925,998 1,211,575,777,498 646,750,965,215 3,534,026,576,831 3,625,080,672,129 3,651,888,611,993 3,823,458,770,185 4,314,646,971,261 0.434 0.422 0.392 0.317 0.150 X2 78,884,658,844 266,423,493,424 340,623,845,870 477,638,954,198 593,170,033,103 3,534,026,576,831 3,625,080,672,129 3,651,888,611,993 3,823,458,770,185 4,314,646,971,261 0.022 0.073 0.093 0.125 0.137 X3 121,379,278,346 239,843,527,003 114,848,770,976 199,968,181,172 203,925,822,496 3,534,026,576,831 3,625,080,672,129 3,651,888,611,993 3,823,458,770,185 4,314,646,971,261 0.034 0.066 0.031 0.052 0.047 X4 600*1.537.500.000.000 129*1.537.500.000.000 245*1.537.500.000.000 350*1.537.500.000.000 490*1.537.500.000.000 376,127,676,295 262,414,953,732 217,001,853,625 260,103,444,698 707,681,803,226 2,452.625 755.816 1,735.872 2,068.888 1,064.567 X5 294,243,925,961 324,579,967,633 337,414,915,317 355,667,588,781 439,841,775,753 3,534,026,576,831 3,625,080,672,129 3,651,888,611,993 3,823,458,770,185 4,314,646,971,261 0.083 0.090 0.092 0.093 0.102 Tahun
Rumus Analisis Altman
0.717( X1 ) + 0.847 (X2 ) + 3.11 ( X3) + 0.420(X4) + 0.998(X5) = T O T A L 2007 0.31 0.02 0.11 1,030.10 0.08 1,030.62 2008 0.30 0.06 0.21 317.44 0.09 318.10 2009 0.28 0.08 0.10 729.07 0.09 729.62 2010 0.23 0.11 0.16 868.93 0.09 869.52 2011 0.11 0.12 0.15 447.12 0.10 447.59
Tabel analisis kebangkrutan pada PT.Summarecon Agung, Tbk pada tahun 2007-2011
Tahun
Rumus Analisis Altman
0.717( X1 ) + 0.847 (X2 ) + 3.11 ( X3) + 0.420(X4) + 0.998(X5) = T O T A L 2007 0.055 0.229 0.240 51.998 0.338 52.860 2008 0.097 0.205 0.146 21.841 0.348 22.638 2009 0.021 0.195 0.169 59.298 0.268 59.950 2010 0.035 0.167 0.174 79.017 0.276 79.668 2011 0.056 0.160 0.204 63.669 0.291 64.380 Altman's Bankruptcy 2007 2008 2009 2010 2011 X1 233,768,192,000 490,557,375,000 127,855,167,000 296,961,295,000 634,070,155,000 3,029,483,370,000 3,629,969,131,000 4,460,277,206,000 6,139,640,438,000 8,099,174,681,000 0.077 0.135 0.029 0.048 0.078 X2 818,258,138,000 877,002,489,000 1,025,037,869,000 1,207,160,683,000 1,531,470,030,000 3,029,483,370,000 3,629,969,131,000 4,460,277,206,000 6,139,640,438,000 8,099,174,681,000 0.270 0.242 0.230 0.197 0.189 X3 233,872,390,000 170,819,171,000 242,996,196,000 343,911,127,000 530,915,731,000 3,029,483,370,000 3,629,969,131,000 4,460,277,206,000 6,139,640,438,000 8,099,174,681,000 0.077 0.047 0.054 0.056 0.066 X4 321,310,117,000 * 585 643,578,759,000*166 643,680,064,000* 600 687,314,084,000*1090 687,314,084,000*1240 1,518,262,533,000 2,054,374,823,000 2,735,479,178,000 3,982,107,010,000 5,622,074,731,000 123.804 52.003 141.185 188.135 151.593 X5 1,027,229,644,000 1,267,062,897,000 1,197,692,629,000 1,695,443,952,000 2,359,330,713,000 3,029,483,370,000 3,629,969,131,000 4,460,277,206,000 6,139,640,438,000 8,099,174,681,000 0.339 0.349 0.269 0.276 0.291
Tabel Analisis Prospektif PT.Modernland Realty, Tbk (income statement 2012-2016)
Account 2011
Rate
progress 2012 2013 2014 2015 2016
Pendapatan bersih 504,637,348,122 165.17% 833,509,507,893 1,376,707,654,187 2,273,908,032,421 3,755,813,897,149 6,203,477,813,922
Beban pokok penjualan
dan Beban langsung 283,013,505,899 417,996,640,933 690,405,051,830 1,140,342,024,107 1,883,502,921,217 3,110,981,774,974
Laba kotor 266,623,842,223 49.85% 415,512,866,960 686,302,602,358 1,133,566,008,314 1,872,310,975,932 3,092,496,038,947
Beban usaha 116,591,075,203 25.28% 210,719,698,090 348,045,725,335 574,867,124,536 949,508,029,596 1,568,302,412,483
Laba Usaha 150,032,767,020 204,793,168,870 338,256,877,023 558,698,883,778 922,802,946,336 1,524,193,626,464
Beban lain-lain bersih 33,889,331,822 2.57% 21,451,648,738 35,431,688,221 58,522,519,434 96,661,645,349 159,656,039,623
Laba Sebelum pajak 116,143,435,198 183,341,520,132 302,825,188,802 500,176,364,344 826,141,300,987 1,364,537,586,840
Beban pajak penghasilan -
bersih 24,097,695,017 52.89% 96,964,285,921 160,155,911,056 264,529,518,291 436,923,405,361 721,666,388,635
Tabel Analisis Prospektif PT.Modernland Realty, Tbk (Balance sheet 2012-2016) MDLN 2011 progres rate 2012 2,013 2014 2015 2016 kas 94,034,608,289 12 1,035,070,496,777 987,409,450,836 1,088,075,842,438 676,514,403,837 314,082,667,011 piutang usaha 258,167,729,332 1 41,140,646,984 67,952,006,623 112,236,329,340 185,380,745,170 306,193,376,798 persediaan 463,028,849,649 2 87,082,633,528 143,834,385,798 29,965,497,041 392,396,441,920 648,121,203,120
aktiva lancar lainnya 90,246,646,061 11 99,433,754,630 109,556,110,851 120,708,922,936 132,997,091,291 146,536,195,184
aset lancar 905,477,833,331 10 1,262,727,531,919 1,308,751,954,108 1,350,986,591,755 1,387,288,682,219 1,414,933,442,112
aset tetap 1,504,921,754,744 3 1,808,464,472,676 2,173,231,756,815 2,611,572,602,164 3,138,326,796,021 3,771,327,310,778
TOTAL ASET 2,410,399,588,075 9 3,071,192,004,594 3,481,983,710,923 3,962,559,193,919 4,525,615,478,239 5,186,260,752,890
current liabilities 814,379,951,104 4 1,237,857,525,678 1,363,871,421,792 1,502,713,532,531 1,655,689,770,142 1,824,238,988,743
long term liabilities 409,445,427,844 5 409,445,427,844 409,445,427,844 409,445,427,844 409,445,427,844 409,445,427,844
TOTAL LIABILITIES 1,223,825,378,848 6 1,647,302,953,522 1,773,316,849,636 1,912,158,960,375 2,065,135,197,986 2,233,684,416,587
TOTAL EQUITY 1,186,574,209,227 7 1,423,889,051,072 1,708,666,861,287 2,050,400,233,544 2,460,480,280,253 2,952,576,336,304
TOTAL LIABILITIES +TOTAL
EQUITY 2,410,399,588,075 8 3,071,192,004,594 3,481,983,710,923 3,962,559,193,919 4,525,615,478,239 5,186,260,752,890
Capital expenditure 120.17%
Pertumbuhan aktiva lancar lainnya 110.18%
Beban pokok penjualan
Current liabilities 1.52
Receivable turnover 20.26
Inventory tunover 4.80
Tabel Analisis Prospektif pada PT.Alam Sutera Realty, Tbk (Income Statement 2012-2016)
Account 2011
progres
rate 2012 2013 2014 2015 2016
Pendapatan bersih 1,381,046,263,518 126.00% 1,740,118,292,033 2,192,549,047,961 2,762,611,800,431 3,480,890,868,543 4,385,922,494,364
Beban pokok penjualan dan
Beban langsung 566,655,685,963 1,044,122,942,433 1,315,594,907,465 1,657,649,583,406 2,088,638,475,092 2,631,684,478,616
Laba kotor 814,390,577,555 40.00% 695,995,349,600 876,954,140,496 1,104,962,217,025 1,392,252,393,451 1,754,238,015,748
Beban usaha 120,770,120,237 11.39% 198,162,197,326 249,684,368,630 314,602,304,474 396,398,903,637 499,462,618,583
Laba Usaha 693,620,457,318 497,833,152,274 627,269,771,866 790,359,912,551 995,853,489,814 1,254,775,397,165
Beban lain-lain bersih 22,477,255,543 0.04% 727,505,917 916,657,455 1,154,988,393 1,455,285,376 1,833,659,573
Laba Sebelum pajak 671,143,201,775 497,105,646,358 626,353,114,411 789,204,924,157 994,398,204,438 1,252,941,737,592
Beban pajak penghasilan -
bersih 68,406,592,318 19.18% 95,364,720,523 120,159,547,858 151,401,030,302 190,765,298,180 240,364,275,707
Tabel Analisis Prospektif pada PT.Alam Sutera Realty, Tbk (Balance sheet 2012-2016) ASRI 2011 progres rate 2012 2013 2014 2015 2016 kas 844,906,352,691 12 1,198,528,995,847 1,059,369,640,229 849,659,210,078 546,373,868,844 119,897,170,664 piutang usaha 7,990,877,013 1 60,274,274,057 75,945,585,312 95,691,437,493 120,571,211,242 151,919,726,164 persediaan 2,395,213,061,781 2 1,338,619,156,965 1,686,660,137,776 2,125,191,773,598 2,677,741,634,733 3,373,954,459,764
aktiva lancar lainnya 1,274,930,646,289 3 1,532,849,116,033 1,842,944,492,207 2,215,772,162,980 2,664,022,871,551 3,202,954,698,466
aset lancar 3,670,143,708,070 4,130,271,542,903 4,664,919,855,524 5,286,314,584,149 6,008,709,586,371 6,848,726,055,058
aset tetap 2,337,404,383,115 4 2,691,754,887,595 3,099,824,928,555 3,569,758,387,724 4,110,933,759,302 4,734,151,317,213
TOTAL ASET 6,007,548,091,185 10 6,822,026,430,498 7,764,744,784,078 8,856,072,971,873 10,119,643,345,673 11,582,877,372,271
current liabilities 2,433,643,670,489 5 2,774,353,784,357 3,162,763,314,168 3,605,550,178,151 4,110,327,203,092 4,685,773,011,525
long term liabilities 787,032,506,316 6 787,032,506,316 787,032,506,316 787,032,506,316 787,032,506,316 787,032,506,316
TOTAL LIABILITIES 3,220,676,176,805 7 3,561,386,290,673 3,949,795,820,484 4,392,582,684,467 4,897,359,709,408 5,472,805,517,841
TOTAL EQUITY 2,786,871,914,380 8 3,260,640,139,825 3,814,948,963,595 4,463,490,287,406 5,222,283,636,265 6,110,071,854,430
TOTAL LIABILITIES +TOTAL
EQUITY 6,007,548,091,185 9 6,822,026,430,498 7,764,744,784,078 8,856,072,971,873 10,119,643,345,673 11,582,877,372,271
capital expenditure 115.16%
pertumbuhan aktiva lancar lainnya 120.23%
Beban pokok penjualan
Current liabilities 1.14
receivable turnover 28.87
inventory tunover 0.78
Tabel Analisis Prospektif pada PT.Ciputra Realty, Tbk (Income Statement 2012-2016)
CTRP 2011 progres
rate 2012 2013 2014 2015 2016
Pendapatan bersih 439,841,775,753 110.56% 486,267,077,618 537,592,570,352 594,335,469,128 657,067,581,183 726,421,068,014
Beban pokok penjualan
dan Beban langsung 160,175,449,660 174,681,733,059 193,119,390,950 213,503,143,734 236,038,401,737 260,952,256,346
Laba kotor 279,666,326,093 64.08% 311,585,344,559 344,473,179,401 380,832,325,394 421,029,179,447 465,468,811,667
Beban usaha 146,076,105,474 32.15% 156,334,853,154 172,835,997,769 191,078,838,290 211,247,210,729 233,544,354,991
Laba Usaha 133,590,220,619 155,250,491,405 171,637,181,632 189,753,487,103 209,781,968,717 231,924,456,676
Beban lain-lain bersih -70,335,601,877 0.25% 1,215,667,694 1,343,981,426 1,485,838,673 1,642,668,953 1,816,052,670
Laba Sebelum pajak 203,925,822,496 154,034,823,711 170,293,200,206 188,267,648,430 208,139,299,764 230,108,404,006
Beban pajak penghasilan
bersih 35,367,042,642 2.16% 3,327,152,192 3,678,333,124 4,066,581,206 4,495,808,875 4,970,341,527
Tabel Analisis Prospektif pada PT.Ciputra Realty, Tbk (Balance Sheet 2012-2016) CTRP 2011 progres rate 2012 2013 2014 2015 2016 kas 868,097,298,556 12 911,738,914,077 948,673,991,160 979,281,691,082 984,821,795,256 926,314,794,902 piutang usaha 19,143,783,509 1 11,258,788,553 12,447,153,747 13,760,950,894 15,213,419,337 16,819,195,833 persediaan 3,158,313,581 2 4,043,558,636 4,470,356,272 4,942,202,401 5,463,851,892 6,040,561,489
aktiva lancar lainnya 127,138,266,983 3 210,032,417,056 346,973,552,976 573,200,309,517 946,926,911,322 1,564,323,257,504
aset lancar 1,017,537,662,629 11 1,137,073,678,322 1,312,565,054,155 1,571,185,153,894 1,952,425,977,807 2,513,497,809,728
aset tetap 3,297,109,308,632 4 3,697,708,089,631 4,146,979,622,521 4,650,837,646,657 5,215,914,420,726 5,849,648,022,844
TOTAL ASET 4,314,646,971,261 10 4,834,781,767,953 5,459,544,676,676 6,222,022,800,551 7,168,340,398,533 8,363,145,832,572
current liabilities 370,786,697,414 5 530,224,977,302 758,221,717,542 1,084,257,056,085 1,550,487,590,201 2,217,197,253,988
long term liabilities 336,895,105,812 6 336,895,105,812 336,895,105,812 336,895,105,812 336,895,105,812 336,895,105,812
TOTAL LIABILITIES 707,681,803,226 7 867,120,083,114 1,095,116,823,354 1,421,152,161,897 1,887,382,696,013 2,554,092,359,800
TOTAL EQUITY 3,606,965,168,035 8 3,967,661,684,839 4,364,427,853,322 4,800,870,638,655 5,280,957,702,520 5,809,053,472,772
TOTAL LIABILITIES +TOTAL
EQUITY 4,314,646,971,261 9 4,834,781,767,953 5,459,544,676,676 6,222,022,800,551 7,168,340,398,533 8,363,145,832,572
capital expenditure 112.15%
pertumbuhan aktiva lancar lainnya 165.20%
beban pokok penjualan
penjualan 1.43
receivable turnover 43.19
inventory tunover 43.20
Tabel Analisis Prospektif pada PT.Lippo Cikarang Realty, Tbk ( Income statement 2012-2016 )
Account 2011
progres
rate 2012 2013 2014 2015 2016
Pendapatan bersih 902,455,446,998 154.15% 1,391,126,840,083 2,144,409,335,259 3,305,587,430,744 5,095,532,873,611 7,854,717,447,363
Beban pokok penjualan dan
Beban langsung 513,603,262,818 755,965,158,626 1,165,313,396,723 1,796,319,972,007 2,769,010,852,278 4,268,404,972,121
Laba kotor 388,852,184,180 45.66% 635,161,681,456 979,095,938,537 1,509,267,458,737 2,326,522,021,333 3,586,312,475,242
Beban usaha 45,466,022,918 15.00% 208,679,565,226 321,677,646,391 495,863,157,830 764,368,534,934 1,178,267,124,653
Laba Usaha 343,386,161,262 426,482,116,230 657,418,292,146 1,013,404,300,907 1,562,153,486,399 2,408,045,350,590
Beban lain-lain bersih 41,806,413,616 9.41% 130,953,195,956 201,863,157,117 311,170,215,465 479,666,048,897 739,400,839,251
Laba Sebelum pajak 301,579,747,646 295,528,920,274 455,555,135,028 702,234,085,443 1,082,487,437,502 1,668,644,511,339
Beban pajak penghasilan
bersih 43,898,996,516 29.04% 85,813,317,713 132,280,446,536 203,909,101,780 314,324,020,501 484,527,610,594
Tabel Analisis Prospektif pada PT.Lippo Cikarang Realty, Tbk ( Balance sheet 2012-2016 ) Account 2011 Langkah proyeksi 2012 2013 2014 2015 2016 kas 37,357,605,877 12 -26,220,756,889 143,442,075,738 559,758,881,890 1,414,991,663,675 3,034,871,021,527 piutang usaha 73,997,754,295 1 105,305,711,317 127,422,038,430 154,183,241,106 186,564,837,062 225,747,222,450 persediaan 1,359,250,346,889 2 1,748,944,438,381 2,116,258,108,449 2,560,715,070,927 3,098,516,975,927 3,749,268,147,445
aktiva lancar lainnya 31,046,741,560 3 31,763,921,290 32,497,667,872 33,248,364,000 34,016,401,208 34,802,180,076
aset lancar 1,501,652,448,621 11 1,859,793,314,099 2,419,619,890,489 3,307,905,557,922 4,734,089,877,872 7,044,688,571,497
aset tetap 540,306,076,202 4 583,368,470,475 629,862,937,572 680,063,013,697 734,264,035,888 792,784,879,549
TOTAL ASSET 2,041,958,524,823 10 2,443,161,784,574 3,049,482,828,061 3,987,968,571,619 5,468,353,913,760 7,837,473,451,046
current liabilities 434,135,189,349 5 720,664,414,319 1,196,302,927,770 1,985,862,860,098 3,296,532,347,763 5,472,243,697,287
long term liabilities 786,376,094,924 6 786,376,094,924 786,376,094,924 786,376,094,924 786,376,094,924 786,376,094,924
TOTAL LIABILITIES 1,220,511,284,273 7 1,507,040,509,243 1,982,679,022,694 2,772,238,955,022 4,082,908,442,687 6,258,619,792,211
TOTAL EQUITY 821,447,240,550 8 936,121,275,331 1,066,803,805,367 1,215,729,616,596 1,385,445,471,073 1,578,853,658,835
TOTAL LIABILITIES +TOTAL
EQUITY 2,041,958,524,823 9 2,443,161,784,574 3,049,482,828,061 3,987,968,571,619 5,468,353,913,760 7,837,473,451,046
capital expenditure 107.97%
pertumbuhan aktiva lancar
lainnya 102.31%
beban pokok penjualan
Current liabilities 1.66
receivable turnover 27.11
inventory tunover 0.88
Tabel Analisis Prospektif pada PT.Summarecon Agung, Tbk ( Income statement 2012-2016 )
Account 2,011
proggres
rate 2,012 2,013 2,014 2,015 2,016
Pendapatan bersih 2,359,330,713,000 121.00% 2,854,837,833,797 3,454,411,461,849 4,179,907,666,377 5,057,772,732,751 6,120,007,200,620
Beban pokok penjualan
dan Beban langsung 1,312,185,440,000 1,539,071,105,775 1,862,307,135,435 2,253,429,262,416 2,726,694,938,816 3,299,355,969,751
Laba kotor 1,047,145,273,000 46.09% 1,315,766,728,022 1,592,104,326,414 1,926,478,403,962 2,331,077,793,935 2,820,651,230,869
Beban usaha 482,670,705,000 22.77% 650,172,986,542 786,722,450,679 951,950,061,312 1,151,878,808,658 1,393,796,632,573
Laba Usaha 564,474,568,000 665,593,741,480 805,381,875,735 974,528,342,650 1,179,198,985,277 1,426,854,598,296
Beban lain-lain bersih 33,558,837,000 2.17% 61,876,508,786 74,871,825,867 90,596,422,109 109,623,501,283 132,646,651,532
Laba Sebelum pajak 530,915,731,000 603,717,232,693 730,510,049,868 883,931,920,540 1,069,575,483,994 1,294,207,946,764
Beban pajak penghasilan -
bersih 142,209,087,000 33.16% 200,192,821,612 242,237,359,114 293,112,099,015 354,671,562,236 429,159,756,563
Tabel Analisis Prospektif pada PT.Summarecon Agung, Tbk ( Balance Sheet 2012-2016 ) Account 2011 langkah proyeksi 2012 2013 2014 2015 2016 kas 1,495,900,816,000 12 2,730,535,451,687 2,658,478,690,094 2,523,913,560,132 2,307,106,035,439 1,983,284,788,630 piutang usaha 77,041,504,000 1 248,246,768,156 300,383,605,378 363,470,231,859 439,806,324,587 532,174,539,184 persediaan 2,741,082,409,000 2 1,637,309,686,995 1,981,177,803,654 2,397,265,172,783 2,900,739,296,613 3,509,953,159,310
aktiva lancar lainnya 452,219,178,000 3 544,110,114,970 654,673,290,331 787,702,902,927 947,764,132,801 1,140,349,804,587
aset lancar 4,766,243,907,000 11 5,160,202,021,807 5,594,713,389,458 6,072,351,867,700 6,595,415,789,440 7,165,762,291,711 aset tetap 3,332,930,774,000 4 3,949,189,674,113 4,679,394,844,856 5,544,614,951,670 6,569,814,256,234 7,784,572,912,211 TOTAL ASET 8,099,174,681,000 10 9,109,391,695,920 10,274,108,234,314 11,616,966,819,370 13,165,230,045,674 14,950,335,203,923 current liabilities 4,132,173,752,000 5 4,751,999,814,800 5,464,799,787,020 6,284,519,755,073 7,227,197,718,334 8,311,277,376,084
long term liabilities 1,489,900,979,000 6 1,489,900,979,000 1,489,900,979,000 1,489,900,979,000 1,489,900,979,000 1,489,900,979,000
TOTAL LIABILITIES 5,622,074,731,000 7 6,241,900,793,800 6,954,700,766,020 7,774,420,734,073 8,717,098,697,334 9,801,178,355,084
TOTAL EQUITY 2,477,099,950,000 8 2,867,490,902,120 3,319,407,468,294 3,842,546,085,297 4,448,131,348,340 5,149,156,848,839
TOTAL LIABILITIES
+TOTAL EQUITY 8,099,174,681,000 9 9,109,391,695,920 10,274,108,234,314 11,616,966,819,370 13,165,230,045,674 14,950,335,203,923
capital expenditure 118.49%
pertumbuhan aktiva lancar
lainnya 120.32%
Beban pokok penjualan current
liabilities 1.15
receivable turnover 11.50
inventory tunover 0.94
pertumbuhan equity 1.16