RED LIGHT VIOLATION BY MOTORCYCLISTS
AT A SIGNALIZED INTERSECTION IN JAKARTA
Leksmono Suryo PUTRANTO Robby SUCIPTO
Senior Lecturer Student
Department of Civil Engineering Department of Civil Engineering
Tarumanagara University Tarumanagara University
Jl. Let. Jen. S. Parman No. 1, Jl. Let. Jen. S. Parman No. 1,
Jakarta 11440, Indonesia Jakarta 11440, Indonesia
Fax: +62-21-566-3277 Fax: +62-21-566-3277
E-mail: [email protected] E-mail: [email protected]
Abstract: Red light violation by motorcyclists is common in Indonesia. Therefore a study on this behaviour is essential. Observations were made on an intersection approach in Jakarta on 4 hourly observations at 5.00, 8.00, 12.00 and 15.00. Two types of violation were found, (1)
at the beginning of red and (2) at the end of red. The type 1 was dominant during the early
morning observation, whilst type 2 was dominant during the other three observations. The analysis shows that the higher the degree of saturations (Q/C) the higher the rate of type 1 violation and the lower the Q/C the higher the rate of the type 2 violation. Higher Q/C encourages motorcyclists to wait their turn in front of stop line and using gaps during the inter-greens. Lower Q/C allows a higher speed thus enables the use of the amber time or even all red time to cross the intersection.
Key Words: Red light violation, Motorcyclists, Degree of saturation
1. INTRODUCTION
As any other developing countries in Asia, the motorcycle ownership rate in Indonesia is relatively high, i.e. about 68 motorcycles per 1000 population in 2000 (Putranto, 2004). In city level, in 2000 in Denpasar there were 653 motorcycles per 1000 population and in Yogyakarta there were 320 motorcycles per 1000 population. For Jakarta case in 1999 there were about 228 motorcycles per 1000 population.
The existence of large number of motorcycles mixed with other type of vehicles causes complicated and dangerous traffic operation. One way to understand this potential danger is by studying the red light violation by motorcyclists at a signalized intersection in Jakarta, Indonesia.
2. OBJECTIVE
The objective of this research was to evaluate whether degree of saturation of an intersection approach affecting red light violation by the motorcyclist. Two types of red light violation were observed, firstly, at the beginning of red (the use of inter-green period as a green
extension) and secondly, at the end of red (movement made earlier than the beginning of
3. SCOPE AND LIMITATIONS
The observation was only conducted in an approach of a signalized intersection in Central Jakarta (which might reflect motorcyclists’ behaviour in city centre) on 4 hourly observations at 5.00, 8.00, 12.00 and 15.00 at one single day in October 2006 with fine weather. Only two types of red light violation as stated in the objectives were observed.
4. LITERATURE REVIEW
Previous studies specifically on red light violation by motorcyclist were hard to find. Research on red light violation generally concerns on passenger car. This is quite understandable since most studies were conducted in developed countries in which motorcycling is usually only for leisure and therefore consisting of insignificant number of trips. In this paper only some closely related references can be reviewed.
Based on their phone survey on 880 licensed passenger cars drivers, Porter and Berry (2001) found that about 20% of the respondents were running one or more red lights when entering the last ten signalized intersections. They also found that younger respondents were more likely to be violators. Drivers were more likely to run red lights when alone and when in a hurry. For predicting red light running, frustration was not as important as other driving behaviours such as, speeding, weaving and gesturing angrily at others. Drivers perceived and received few consequences for running red lights. More than 10% had been involved in a red light running crash.
Retting et al (1998) found that in the USA, 3% of all fatal crashes between 1992 and 1996 involved red light running. Urban areas are at greater risk for red light running crashes. Retting et al (1995) found that red light running was involved in 22% of urban crashes. Red light runners do more than run red lights. They are more likely to be unbelted (Porter and England, 2000) and to have more driving violation on their records (Retting and Williams, 1996).
In several European countries, the sequence of the traffic signal is flashing green-amber-red-red/amber. From about 5000 cycles observed in Switzerland, Austria and Germany, it was found that the flashing green increases the numbers of early stops, as drivers tend to underestimate the duration of the time to end of amber (Köll et al, 2004).
Mannering et al (1995) found that motorcyclist have a reasonable grasp of the factors that increase the likelihood of accident involvement. These factors include exposure (miles ridden), regularly riding above the speed limit, and passing vehicles on the shoulder or passing between lanes of traffic. The findings suggest that motorcycle accidents are, for the most part, not the result of misjudgement of the overall risk of motorcycling. They also found that risk-seekers tend to be attracted to motorcycling.
5. METHODOLOGY OF DATA COLLECTION AND ANALYSIS
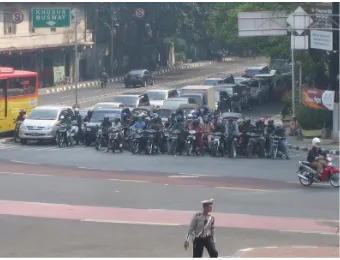
2006. The observations were carried out using two video cameras. The first video camera was intended to capture the queue and the flow of the observed approach (Figure 1) so that a traffic count and red light violation count can be conducted by playing back the video afterward. The second video was assigned to capture the traffic light in order to identify the beginning of red and green.
Figure 1 The observed intersection approach
During the traffic count, vehicles were classified into light vehicles, heavy vehicles, motorcycles and non-motorized vehicles. This was to comply with Indonesian Highway Capacity Manual (1997) in analyzing flow (Q) and capacity (C). The signal timings was fixed throughout the 4 periods of observations, i.e. cycle time of the intersection was 5 minutes and 36 seconds and the green time for the observed approach was 52 seconds. The cycle time was quite long (Indonesian Highway Capacity Manual (1997) suggests 2 minutes as a maximum cycle time for a four leg intersection). This might be due to a very complex signal phasing in that intersection, including exclusive green time for the bus rapid transit (BRT) system (three corridors of BRT cross this intersection). Therefore for each hour there were less than 11 cycles, but the observation was extended until 11 cycles were completed in each period of observations. The traffic count was aggregated per cycle.
In order to establish the number of motorcycles keep moving at the beginning of red period (type 1) and the number of motorcycles that made movement earlier than the beginning of green period (type 2), separate counts were conducted. All motorcycles that queue beyond the stop line were categorized as type 2 violation. For each type of violation the count was aggregated per cycle.
6. DATA ANALYSIS RESULTS
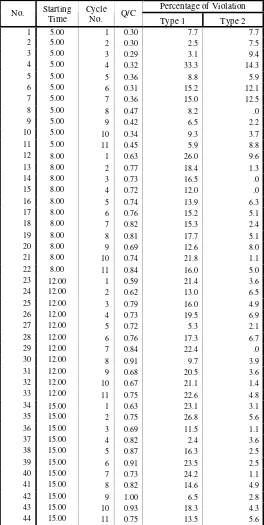
Table 1 summarizes Q/C, percentage of type 1 violations and percentage of type 2 violations for each period and cycle number. Information from this table was then used to calculate the Pearson correlation coefficients as stated in the previous chapter. The summary of the correlation coefficients were tabulated in Table 2.
Table 1 Summary of Q/C and percentages of type 1 and type 2 violation
Table 2 Summary of correlation coefficients
Correlation Coefficients
Between Q/C and Percentage of Violation Observation Period No. of
Sampel
Type 1 Type 2
All 44 -0.539 (0.001) 0.252 (0.098)
Start at 5.00 11 -0.561 (0.072) -0.159 (0.640)
Start at 8.00 11 -0.361 (0.275) -0.337 (0.310)
Start at 12.00 11 -0.158 (0.643) -0.215 (0.525)
Start at 15.00 11 0.060 (0.860) -0.325 (0.329)
*The numbers between the brackets show significant levels
From Table 2, it can be seen that only if overall sample was included in the analysis, the correlation coefficients were significant at least at significant level of 0.1 (except in starting period of 5.00/ type 1 violation in which the correlation coefficient was significant at least at significant level of 0.1 although only one fourth of the overall sample was used). This was because the Q/Cs of the early morning observation period were relatively low whilst in the other observation periods they were relatively high. So the relationship could only be sufficiently clear if Q/Cs were varied, i.e. by combining data from all observation periods, resulting in number of sample of 44. By increasing number of sample the degree of freedom of analysis was also increased and therefore allowing lower correlation coefficients to be statistically significant. In general the lower the Q/C, the higher the higher the percentage of motorcyclists that keep on moving at the beginning of red (type 1 violation). Lower Q/C facilitates higher speeds thus enables the use of the amber time or even all red time to cross the intersection. On the other hand the higher the Q/C, the higher the percentage of motorcyclists those move earlier than the beginning of green period (type 2 violation). Higher Q/C encourages motorcyclists to wait their turn in front of stop line and using available gaps during the inter-greens.
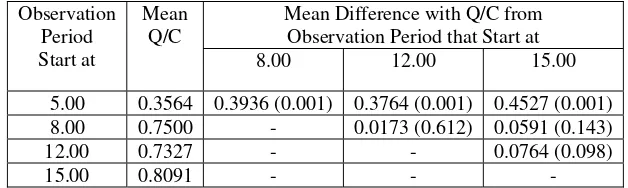
The fact that different Q/C results in different percentage of violation types 1 and 2 could also be proved by t-test grouped by pairs of observation periods as summarized in Tables 3 to 5.
Table 3 T-test for mean difference of Q/C
Mean Difference with Q/C from Observation Period that Start at Observation
Period Start at
Mean Q/C
8.00 12.00 15.00 5.00 0.3564 0.3936 (0.001) 0.3764 (0.001) 0.4527 (0.001) 8.00 0.7500 - 0.0173 (0.612) 0.0591 (0.143)
12.00 0.7327 - - 0.0764 (0.098)
15.00 0.8091 - - -
Table 4 T-test for mean difference of percentage of type 1 violation
Mean Difference with Percentage of Violation from Observation Period that Start at Observation
Period Start at
Mean Percentage of
Violation 8.00 12.00 15.00
5.00 7.642 3.650 (0.041) 3.604 (0.027) 4.278 (0.011) 8.00 3.992 - 0.046 (0.969) 0.628 (0.575)
12.00 4.038 - - 0.674 (0.097)
15.00 3.364 - - -
*The numbers between the brackets show significant levels
Table 5 T-test for mean difference of percentage of type 2 violation
Mean Difference with Percentage of Violation from Observation Period that Start at Observation
Period Start at
Mean Percentage of
Violation 8.00 12.00 15.00
5.00 10.496 6.375 (0.038) 6.676 (0.044) 5.908 (0.105) 8.00 16.871 - 0.301 (0.888) 0.468 (0.861)
12.00 17.172 - - 0.768 (0.793)
15.00 16.403 - - -
*The numbers between the brackets show significant levels
It can be seen from Table 3 through 5 that the Q/C, percentage of type 1 violation and percentage of type 2 violation at observation period that start at 8.00, 12.00 and 15.00 were not statistically different, whilst the Q/C, percentage of type 1 violation and percentage of type 2 violation at observation period that start at 5.00 in most cases were statistically different with values for other observation periods.
7. CONCLUSIONS
Two types of red light violation were found, (1) at the beginning of red and (2) at the end of red. The type 1 was dominant during the early morning observation, whilst type 2 was dominant during the other three observations. The analysis shows that the higher the degree of saturations (Q/C) the higher the rate of type 1 violation and the lower the Q/C the higher the rate of the type 2 violation.
REFERENCES
Köll, H., Bader, M., Axhausen, K.W. (2004). Driver Behaviour During Flashing Green
Before Amber: A Comparative Study. Accident Analysis and Prevention Vol. 36,
273-280.
Mannering, F.L., Grodsky, L.L. (1995). Statistical Analysis of Motorcyclists’ Perceived
Accident Risk. Accident Analysis and Prevention Vol.27 No.1, 21-31.
Porter, B.E., Berry, T.D. (2001). A Nationwide Survey of Self-Reported Red Light Running:
Measuring Prevalence, Predictors, and Perceived Consequences. Accident Analysis and
Prevention Vol. 33, 735-741.
Putranto, L.S. (2004). Vehicle Ownership Characteristics in Indonesia. Thesis (Ph.D.) Institute for Transport Studies, University of Leeds.
Retting, R.A., Ulmer, R.G., Williams A.F. (1998). Prevalence and Characteristics of Red
Light Running Crashes in the United States. Arlington: Insurance Institute for Highway Safety.
Retting, R.A., Williams A.F. (1996). Characteristics of Red Light Violators: Results of A Field Investigation. Journal of Safety Research Vol.27, 9-15’
Retting, R.A., Williams A.F., Preusser, D.F., Weinstein, H.B. (1995). Classifying Urban
Crashes for Countermeasure Development. Accident Analysis and Prevention Vol.27,