Lampiran 1. Hasil Penelitian Pendahuluan
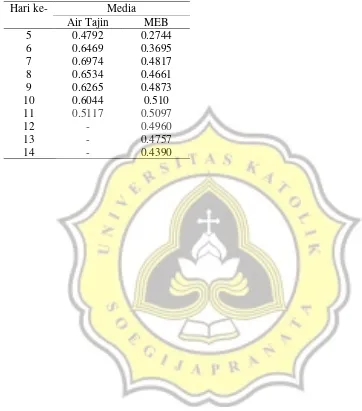
Tabel Hasil Pengukuran Absorbansi Ekstrak
Monascus purpureus
Media
Hari ke-
Air Tajin
MEB
5
0.4792
0.2744
6
0.6469
0.3695
7
0.6974
0.4817
8
0.6534
0.4661
9
0.6265
0.4873
10
0.6044
0.510
11
0.5117
0.5097
12
-
0.4960
13
-
0.4757
Lampiran 2. Hasil Uji Anova Untuk Absorbansi
Uji Normalitas
Tests of Normality
.277 6 .169 .853 6 .168
.377 6 .008 .723 6 .011
.174 6 .200* .943 6 .683
.177 6 .200* .926 6 .550
.180 6 .200* .950 6 .741
.213 6 .200* .905 6 .404
.162 6 .200* .968 6 .882
.236 6 .200* .886 6 .298
.221 6 .200* .943 6 .683
Gabungan tajin 5 hari tajin 6 hari tajin 7 hari meb 9 hari meb 10 hari meb 11 hari beras 5% beras 10% beras 15% Absrbnsi
Statistic df Sig. Statistic df Sig. Kolmogorov-Smirnova Shapiro-Wilk
This is a lower bound of the true significance. *.
Lilliefors Significance Correction a.
Uji Homogenitas
Test of Homogeneity of Variance
7.035 8 45 .000
1.825 8 45 .097
1.825 8 9.614 .188
6.611 8 45 .000
Based on Mean Based on Median Based on Median and with adjusted df
Based on trimmed mean Absrbnsi
Levene
Uji Post Hoc
Absrbnsi Duncana
6 .0533333
6 .0630833
6 .0631000
6 .0659333
6 .0785833
6 .1015000
6 .3849667
6 .5375167
6 .7294833
1.000 .484 1.000 1.000 1.000 1.000 1.000 Gabungan
meb 9 hari meb 10 hari tajin 5 hari meb 11 hari tajin 6 hari tajin 7 hari beras 5% beras 10% beras 15% Sig.
N 1 2 3 4 5 6 7
Subset for alpha = .05
Means for groups in homogeneous subsets are displayed. Uses Harmonic Mean Sample Size = 6.000.
a.
Deskriptiv
Descriptives Absrbnsi
6 .0631000 .00286845 .00117104 .0600897 .0661103 .06020 .06690 6 .0785833 .01297157 .00529562 .0649705 .0921962 .06790 .09570 6 .1015000 .00220817 .00090148 .0991827 .1038173 .09870 .10420 6 .0533333 .00210871 .00086088 .0511204 .0555463 .05080 .05590 6 .0630833 .00321709 .00131337 .0597072 .0664595 .05900 .06750 6 .0659333 .00278903 .00113862 .0630064 .0688602 .06250 .06910 6 .3849667 .00846018 .00345385 .3760883 .3938451 .37430 .39690 6 .5375167 .00541199 .00220944 .5318371 .5431962 .53150 .54410 6 .7294833 .00912917 .00372697 .7199029 .7390638 .71840 .74430 54 .2308333 .24301572 .03307025 .1645028 .2971639 .05080 .74430 tajin 5 hari
tajin 6 hari tajin 7 hari meb 9 hari meb 10 hari meb 11 hari beras 5% beras 10% beras 15% Total
N Mean Std. Deviation Std. Error Lower Bound Upper Bound 95% Confidence Interval for
Mean
Lampiran 3. Hasil Uji Anova Untuk pH Awal
Uji Normalitas
Tests of Normality
.202 6 .200* .853 6 .167
Statistic df Sig. Statistic df Sig. Kolmogorov-Smirnova Shapiro-Wilk
This is a lower bound of the true significance. *.
Lilliefors Significance Correction a.
Uji Homogenitas
Test of Homogeneity of Variance
.000 8 45 1.000
.000 8 45 1.000
.000 8 45.000 1.000
.000 8 45 1.000
Based on Mean Based on Median Based on Median and with adjusted df
Based on trimmed mean Gabungan
Levene
Statistic df1 df2 Sig.
Uji Post Hoc
pH_awal Duncana
6 4.7967 6 4.7967 6 4.7967
6 6.8567
6 6.8567
6 6.8567
6 7.2733
6 7.2733
6 7.2733
1.000 1.000 1.000 Gabungan
meb 9 hari meb 10 hari meb 11 hari beras 5% beras 10% beras 15% tajin 5 hari tajin 6 hari tajin 7 hari Sig.
N 1 2 3
Subset for alpha = .05
Deskriptif
Descriptives pH_awal
6 7.2733 .07607 .03106 7.1935 7.3532 7.21 7.37 6 7.2733 .07607 .03106 7.1935 7.3532 7.21 7.37 6 7.2733 .07607 .03106 7.1935 7.3532 7.21 7.37 6 4.7967 .01862 .00760 4.7771 4.8162 4.78 4.82 6 4.7967 .01862 .00760 4.7771 4.8162 4.78 4.82 6 4.7967 .01862 .00760 4.7771 4.8162 4.78 4.82 6 6.8567 .05391 .02201 6.8001 6.9132 6.80 6.92 6 6.8567 .05391 .02201 6.8001 6.9132 6.80 6.92 6 6.8567 .05391 .02201 6.8001 6.9132 6.80 6.92 54 6.3089 1.09408 .14889 6.0103 6.6075 4.78 7.37 tajin 5 hari
tajin 6 hari tajin 7 hari meb 9 hari meb 10 hari meb 11 hari beras 5% beras 10% beras 15% Total
N Mean Std. Deviation Std. Error Lower Bound Upper Bound 95% Confidence Interval for
Mean
Lampiran 3. Hasil Uji Anova Untuk pH Akhir
Uji Normalitas
Tests of Normality
.143 6 .200* .989 6 .987 tajin 5 hari tajin 6 hari tajin 7 hari meb 9 hari meb 10 hari meb 11 hari beras 5% beras 10% beras 15% pH
Statistic df Sig. Statistic df Sig. Kolmogorov-Smirnova Shapiro-Wilk
This is a lower bound of the true significance. *.
Lilliefors Significance Correction a.
Uji Homogenitas
Test of Homogeneity of Variance
.840 8 45 .573
.633 8 45 .746
.633 8 39.476 .745
.826 8 45 .584
Based on Mean Based on Median Based on Median and with adjusted df
Based on trimmed mean pH
Levene
Statistic df1 df2 Sig.
Deskriptif
Descriptives pH
6 5.8083 .02858 .01167 5.7783 5.8383 5.77 5.85 6 5.6583 .04622 .01887 5.6098 5.7068 5.59 5.71 6 5.5450 .05167 .02110 5.4908 5.5992 5.47 5.60 6 5.1933 .03502 .01430 5.1566 5.2301 5.15 5.25 6 5.0717 .03764 .01537 5.0322 5.1112 5.02 5.11 6 4.9683 .03189 .01302 4.9349 5.0018 4.92 5.01 6 4.6450 .03782 .01544 4.6053 4.6847 4.60 4.70 6 4.4350 .03271 .01335 4.4007 4.4693 4.40 4.48 6 4.3467 .03011 .01229 4.3151 4.3783 4.31 4.39 54 5.0746 .50580 .06883 4.9366 5.2127 4.31 5.85 tajin 5 hari
tajin 6 hari tajin 7 hari meb 9 hari meb 10 hari meb 11 hari beras 5% beras 10% beras 15% Total
N Mean Std. Deviation Std. Error Lower Bound Upper Bound 95% Confidence Interval for
Mean
Uji Post Hoc
pH Duncana
6 4.3467
6 4.4350
6 4.6450
6 4.9683
6 5.0717
6 5.1933
6 5.5450
6 5.6583
6 5.8083
1.000 1.000 1.000 1.000 1.000 1.000 1.000 1.000 1.000 Gabungan
beras 15% beras 10% beras 5% meb 11 hari meb 10 hari meb 9 hari tajin 7 hari tajin 6 hari tajin 5 hari Sig.
N 1 2 3 4 5 6 7 8 9
Subset for alpha = .05
Lampiran 5. Hasil Uji Anova Untuk Diameter Zona Jernih
Uji Normalitas
Tests of Normalityb,c
.431 6 .001 .589 6 .000
staphylo-tajin 5 hari staphylo-tajin 6 hari staphylo-tajin 7 hari staphylo-meb 9 hari staphylo-meb 10 hari satphylo-meb 11 hari satphylo-beras 5% staphylo-beras 10% staphylo-beras 15% salmonella-tajin 5 hari salmonella-tajin 6 hari salmonella-meb 9 hari salmonella-meb 10 hari salmonella-beras 5% salmonella-beras 10% salmonella-beras 15% Zn_jrnih
Statistic df Sig. Statistic df Sig. Kolmogorov-Smirnova Shapiro-Wilk
This is a lower bound of the true significance. *.
Lilliefors Significance Correction a.
Zn_jrnih is constant when Gabungan = salmonella-tajin 7 hari. It has been omitted. b.
Zn_jrnih is constant when Gabungan = salmonella-meb 11 hari. It has been omitted. c.
Uji Homogenitas
Test of Homogeneity of Variancea,b
6.218 15 80 .000
1.759 15 80 .056
1.759 15 22.350 .110
5.023 15 80 .000
Based on Mean Based on Median Based on Median and with adjusted df
Based on trimmed mean Zn_jrnih
Levene
Statistic df1 df2 Sig.
Zn_jrnih is constant when Gabungan = salmonella-tajin 7 hari. It has been omitted.
a.
Zn_jrnih is constant when Gabungan = salmonella-meb 11 hari. It has been omitted.
Deskriptif
Descriptives
Zn_jrnih
6 .09717 .047826 .019525 .04698 .14736 .000 .123 6 .14400 .008173 .003337 .13542 .15258 .134 .157 6 .18567 .006282 .002565 .17907 .19226 .178 .194 6 .12133 .059852 .024434 .05852 .18414 .000 .155 6 .19117 .007679 .003135 .18311 .19923 .179 .199 6 .19883 .005672 .002315 .19288 .20479 .191 .205 6 .16050 .009955 .004064 .15005 .17095 .146 .172 6 .27233 .010250 .004185 .26158 .28309 .257 .287 6 .36567 .010463 .004271 .35469 .37665 .357 .383 6 .02917 .071443 .029167 -.04581 .10414 .000 .175 6 .09867 .152918 .062428 -.06181 .25914 .000 .303 6 .00000 .000000 .000000 .00000 .00000 .000 .000 6 .06600 .161666 .066000 -.10366 .23566 .000 .396 6 .03350 .082058 .033500 -.05261 .11961 .000 .201 6 .00000 .000000 .000000 .00000 .00000 .000 .000 6 .77067 .021897 .008939 .74769 .79365 .748 .803 6 1.23000 .135415 .055283 1.08789 1.37211 1.085 1.394 6 1.32633 .141935 .057945 1.17738 1.47528 1.152 1.566 108 .29394 .396583 .038161 .21829 .36959 .000 1.566 staphylo-tajin 5 hari
staphylo-tajin 6 hari staphylo-tajin 7 hari staphylo-meb 9 hari staphylo-meb 10 hari satphylo-meb 11 hari satphylo-beras 5% staphylo-beras 10% staphylo-beras 15% salmonella-tajin 5 hari salmonella-tajin 6 hari salmonella-tajin 7 hari salmonella-meb 9 hari salmonella-meb 10 hari salmonella-meb 11 hari salmonella-beras 5% salmonella-beras 10% salmonella-beras 15% Total
N Mean Std. Deviation Std. Error Lower Bound Upper Bound 95% Confidence Interval for
Mean
Uji Post Hoc
Zn_jrnih
Duncana
6 .00000 6 .00000
6 .02917 .02917 6 .03350 .03350
6 .06600 .06600 .06600
6 .09717 .09717 .09717 .09717 6 .09867 .09867 .09867 .09867 6 .12133 .12133 .12133 6 .14400 .14400 6 .16050 .16050
6 .18567 .18567 6 .19117 .19117 6 .19883 .19883 6 .27233
6 .36567
6 .77067
6 1.23000
6 1.32633
.057 .072 .065 .052 .078 1.000 1.000 1.000 1.000 Gabungan
salmonella-tajin 7 hari salmonella-meb 11 hari salmonella-tajin 5 hari salmonella-meb 10 hari salmonella-meb 9 hari staphylo-tajin 5 hari salmonella-tajin 6 hari staphylo-meb 9 hari staphylo-tajin 6 hari satphylo-beras 5% staphylo-tajin 7 hari staphylo-meb 10 hari satphylo-meb 11 hari staphylo-beras 10% staphylo-beras 15% salmonella-beras 5% salmonella-beras 10% salmonella-beras 15% Sig.
N 1 2 3 4 5 6 7 8 9 Subset for alpha = .05
Means for groups in homogeneous subsets are displayed. Uses Harmonic Mean Sample Size = 6.000.
Lampiran 6. Hasil Uji Korelasi
Staphylococcus aureus
Correlations
Zn_jrnih absorbansi pH
Pearson
Correlation 1 .804(**) -.747(**) Sig. (2-tailed) . .000 .000 Zn_jrnih
N 54 54 54
Pearson
Correlation .804(**) 1 -.833(**) Sig. (2-tailed) .000 . .000 absorbansi
N 54 54 54
Pearson
Correlation -.747(**) -.833(**) 1 Sig. (2-tailed) .000 .000 . pH
N 54 54 54
** Correlation is significant at the 0.01 level (2-tailed).
Salmonella typhi
Correlations
Zn_jrnih absorbansi pH
Pearson
Correlation 1 .970(**) -.829(**) Sig. (2-tailed) . .000 .000 Zn_jrnih
N 54 54 54
Pearson
Correlation .970(**) 1 -.833(**) Sig. (2-tailed) .000 . .000 absorbansi
N 54 54 54
Pearson
Correlation -.829(**) -.833(**) 1 Sig. (2-tailed) .000 .000 . pH
N 54 54 54