ANALYSIS AND DESIGN
4.1 Analysis
This program will analyze student’s grade in Informatics Engineering
department at Soegijapranata Catholic University using PAP and PAN assessment
method. Those method use statistical formula to get the grade that used as
reference of student' s achievement. Below are the formulas that used to
completed the PAP and PAN assessmet method.
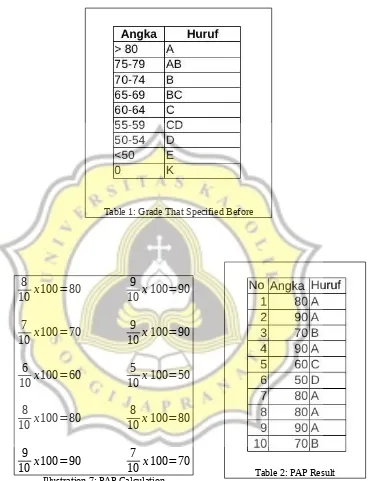
1. PAP 8
the student's grade will divided with maximal grade that specified before,
those result will multiplied with 100.
2. Mean9
∑
Xi : total of frequencies n : frequenciesIllustration 4: Mean Formula
Mean is the statistic formula to calculate the average of student's grade.
The value of 76 is the result from the sum all of the student's grade. And the value
8 Pohan Rahmadanni, “Interpretasi Nilai Evaluasi Menilai (PAN & PAP)”, 2012
9 Bambang Kustituanto and Rudy Badrudin, “Statistika 1 (Deskriptif)”, Gunadarma, Jakarta, 1994
of 10 is the total of student’s grade, then the sum all of student's grade will divided
by the total of student's grade to get the mean result. And the result is 7,6.
3. Standard Deviation 10
student's grade. The value of 16,4 is the result from the every single data reduced
by mean and the result will be squared and summed. And the value of 9 is the total
of student’s grade reduced by 1, then the 16,4 will divided by 9 and those result
are square root to get the standard deviation result. And the result is 1,35. The
standard deviation and mean formula is used to calculate the PAN assessment
method.
4. Scale 9 PAN11
Scale formula 9 is used to calculate the final student grade’s in PAN.
Example to resolve the count using PAP and PAN assessment method :
Here the data of 10 student’s grade
8, 9, 7, 9, 6, 5, 8, 8, 9, 7
1. PAP Method
The maximal grade that specified is 10. In illustration below will show the
Illustration 7: PAP Calculation Table 2: PAP Result
2. Mean
Mean is the statistic formula to calculate the average of student's grade.
The value of 76 is the result from the sum all of the student's grade. And
the value of 10 is the total of student’s grade, then the sum all of student's
grade will divided by the total of student's grade to get the mean result.
And the result is 7,6.
3. Standard Deviation
The standard deviation formula is formula to calculate the diversity of
student's grade. The value of 16,4 is the result from the every single data
reduced by mean and the result will be squared and summed. And the
value of 9 is the total of student’s grade reduced by 1, then the 16,4 will
divided by 9 and those result are square root to get the standard deviation
result. And the result is 1,35. The standard deviation and mean formula is
used to calculate the PAN assessment method.
S =
√
16,49 =1,35 ¯x = 76
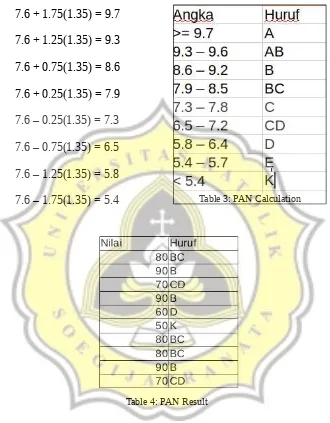
4. Scale 9 PAN
7.6 + 1.75(1.35) = 9.7
7.6 + 1.25(1.35) = 9.3
7.6 + 0.75(1.35) = 8.6
7.6 + 0.25(1.35) = 7.9
7.6 – 0.25(1.35) = 7.3
7.6 – 0.75(1.35) = 6.5
7.6 – 1.25(1.35) = 5.8
7.6 – 1.75(1.35) = 5.4 Table 3: PAN Calculation
4.2 Design
In use case above show that, the “Input File CSV” is a process to read and
convert the data into doubly linked list. The CSV file is stored all the student’s
grade of system administration subject. Those data consist number, year, subject
code and student's grade. Those file is stored student's grade in various years. In
illustration below will show the CSV file.
All the data will be stored in doubly linked list. In one node of linked list
will stored number, year, subject code, and student's grade. In illustration below is
node visualization in linked list.
As shown in the illustration above, the doubly linked list have 2 pointer,
there are next and prev pointer. The next pointer is used to connect the next node
and the prev pointer is to connect the pevious node.
In use case diagram “Choose Assessment Method” in illustration 12 show
that user can choose the assessment method in this program. The assessment
method that offered in this program in PAP and PAN assessment method. In
illustration below is the step to complete the PAP and PAN assessment method.
1. PAP method
Illustration 11: PAP Flowchart
PAP is a assessment method that offered in this program. In
illustration above show the step to completed the PAP assessment
method. First, user choose PAP assessment method, then this program
will get the data in linked list. After the data is successfully taken then
the student's grade will divided with maximal grade that specified
before, those result will multiplied with 100. After get the PAP
• Mean
Illustration 12: Mean Flowchart
Mean is the statistic formula to calculate the average of student's
grade, first step to calculate the mean formula in this program is the
program will get the data in linked list. After that this program will
summed all of the student's grade. Those result will divided by the total of
student's grade to get the mean value and then this program will show the
• Standard Deviation
Illustration 13: Standard Deviation Flowchart
The standard deviation formula is formula to calculate the diversity
of student's grade. In illustration above is show the step in this program to
completed standard deviation calculation. The first step is this program
will get the data in linked list and call the mean function. After that every
single data reduced by mean and the result will be squared and summed.
Then it divided by the sum of student's grade reduced by 1, and those
• Scale 9 PAN
Illustration 14: Scale 9 PAN Flowchart
This program uses scale 9 to completed PAN assessment method.
Those scale is used for reference of student's grade. To completed the scale
9 calculation the first step is call the mean and standard deviation function.
Then the result of standard deviation will multiplied by 1.75 and add with
mean to get the minimum value of A. To get the A value the student must
have value more then or equal to minimum value of A.
The result of standard deviation will multiplied by 1.25 and add
with mean to get the minimum value of AB. To get the AB value the
student must have value more then or equal to minimum value of AB and
under the minimum value of A.
The result of standard deviation will multiplied by 0.75 and add
must have value more then or equal to minimum value of B and under the
minimum value of AB.
The result of standard deviation will multiplied by 0.25 and add
with mean to get the minimum value of BC. To get the BC value the
student must have value more then or equal to minimum value of BC and
under the minimum value of B.
The result of standard deviation will multiplied by 0.25 and
reduced by mean to get the minimum value of C. To get the C value the
student must have value more then or equal to minimum value of C and
under the minimum value of BC.
The result of standard deviation will multiplied by 0.75 and
reduced by mean to get the minimum value of CD. To get the CD value the
student must have value more then or equal to minimum value of CD and
under the minimum value of C.
The result of standard deviation will multiplied by 1.25 and
reduced by mean to get the minimum value of D. To get the D value the
student must have value more then or equal to minimum value of D and
under the minimum value of CD.
The result of standard deviation will multiplied by 1.75 and
reduced by mean to get the minimum value of E. To get the E value the
student must have value more then or equal to minimum value of E and
under the minimum value of CD. And if the student get the value under the
minimum value of E then the student will get K value. The illustration
below will show the processed in this program to completed the PAN
2. PAN
PAN is a assessment method that offered in this program. The first step to
completed this assessment is user choose PAN assessment method, then this
program will call scale 9 PAN function. After this program get the specified grade
from scale 9 PAN function then this program will check the student's grade using
those specified and this program will show the result.
In use case diagram “Show Graph Visualization” in illustration 12 show
that user can choose graph menu. If user choose thoose menu then this program
will draw a 2D graph using JavaScript that used CGI to connect the C
programming language with JavaScript programming language. This graph will
show the student's data.