Volume 9, Issue 12, December 2018, pp. 453–460, Article ID: IJCIET_09_12_051
Available online at http://www.iaeme.com/ijciet/issues.asp?JType=IJCIET&VType=9&IType=12 ISSN Print: 0976-6308 and ISSN Online: 0976-6316
©IAEME Publication Scopus Indexed
THE SYNOPTIC DATA FOR ADAPTATION
CLIMATE CHANGE IN SIDOARJO REGENCY
EAST JAVA
Surya Hermawan
Civil Engineering Department, Petra Christian University, Surabaya 60236, Indonesia
Joko Purnomo
Civil Engineering Department, Petra Christian University, Surabaya 60236, Indonesia
Daniel Tjandra
Civil Engineering Department, Petra Christian University, Surabaya 60236, Indonesia
ABSTRACT
As the biggest archipelago country in the world, many places in Indonesia are potential for maritime economy industries but also suffered from negative impact of the global sea level rise. It was identified as one most contributing factors which is threatening Indonesia coastal water by coastal flood, including the research area where is in Sidoarjo Regency. To adopt the climate change, it is compulsory to have knowledge and technology along with data, unfortunately insufficient raw data in research area have identified as a major problem during years. The purpose of this research is to utilize synoptic data for coastal adaptation of climate changing design and construction. The data were collected from the National Oceanic and Atmospheric Administration (NOAA) for 16 years that will be processed into wind rose and fetch length. The outcomes are going to be obtained from the analysis of graphical and analytical calculations. The results prove that the using of synoptic data analysis give an accurate forecasting of maximum sea wave height at the research area in the range of 0.30 – 0.88 m, then it can be used to determine appropriate adaptation to the sea level rise due to global climate changing.
Key words: Climate changing, maritime economy, sea level rise, synoptic data
Cite this Article: Surya Hermawan, Joko Purnomo, Daniel Tjandra, The Synoptic Data for Adaptation Climate Change in Sidoarjo Regency East Java, International Journal of Civil Engineering and Technology (IJCIET) 9(12), 2018, pp. 453–460. http://www.iaeme.com/IJCIET/issues.asp?JType=IJCIET&VType=9&IType=12
1. INTRODUCTION
The area excludes continental area. The area can be used to improve local citizen’s prosperity, particularly for low-economic fishermen residing along the coastline.
(BNPB) Indonesia releases statistics that several residences suffer from coastal flood. This phenomenon corresponds to prediction claimed by Meteorology Climatology and Geophysics Agency—Badan Meteorologi Klimatologi dan Geofisika (BMKG) Indonesia that there were high sea waves. The impacted residences include Kulon Progo, Gunung Kidul, Bantul, Tasikmalaya, Pangandaran, Cilacap, Pekalongan, Purworejo, Wonogiri, Semarang, Pacitan, Banyuwangi, Jember, Trenggalek, Malang, Tulungagung, Lumajang, Gresik, Tuban, Surabaya, Pemekasan, Probolinggo, dan Jakarta [2–7]. Furthermore, in 2006, 13 residences along the north and south coastline of Java, i.e. Tuban, Probolinggo, Gresik, Jember, Tulungagung, Banyuwangi, Jember, Pacitan, Trenggalek, Malang, Lumajang, Pamekasan, and Blitar suffered from coastal flood. BPBD of East Java records as much as 10 hectares of plantation failed to crop. Also, access to Jokerto Beach submerged at 60 cm height, thus made the connection broken [8].
At the end of 2017, dozens of houses in Kupang Village, Jabon District, Sidoarjo, were submerged by coastal flood at 60-70 cm height. Local residence testified that the flood started submerging the area since Tuesday night, December 5. The water quickly filled the area and made the farmers could not save the fishponds as well as their belongings. Although the houses already submerged, the local citizens rejected to be evacuated [9].
Loss caused by the coastal flood was estimated around 5 billion rupiah because farmers could not harvest their fishes. Moreover, seaweed was also failed to crop and further caused delays in logistic delivery. The delays caused other problem in local household production due to the absence of raw materials.
Coastal flood is caused by several major factors, such as sea level rise, extreme tidal
waves, sea waves’ height, topographical and bathymetrical conditions [10–15]. Amongst the
factors, sea waves’ height will be covered thoroughly. This research employs synoptic data to
predict maximum sea waves’ height. The outcomes are expected become enrichment to better
understand the sea level rise phenomenon as well as to figure out the optimal solution for the adaption against sea level rise as an impact of global climate change [16–18].
2. MATERIAL AND METHOD
2.1. Location of Research Study
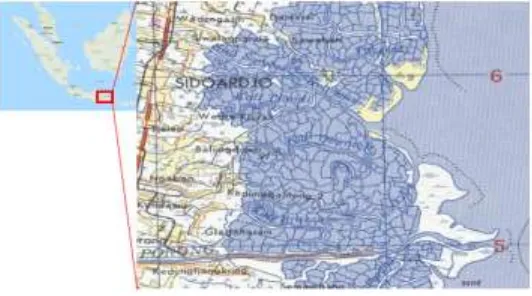
The selected research site covers three sub-villages, i.e. Tanjung Sari, Kalialo, and Tegalsari in Kupang Village, Jabon District, Sidoarjo Residence, East Java—Indonesia. There are the key locations at which the coastal flood occurred as depicted in Figure 1. The site is located at the estuary of Brantas River.
2.2. Synoptic Data
Synoptic data is known as a branch data simultaneously collected over a wide region for
weather forecasting. The data is used in this research to estimate maximum sea waves’ height
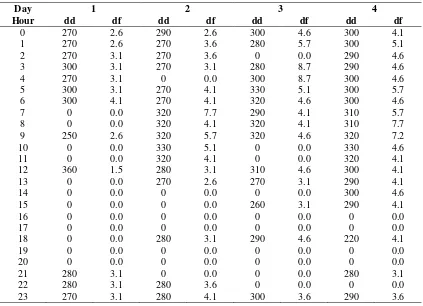
for further deciding appropriate adaption strategy against global climate change. Table 1 shows an example of synoptic data containing wind data in one week recorded in February 2002. The data was obtained from nearest station to the research site, which is Juanda Station with World Meterological Organization (WMO) number 969350 and located at latitude S 07°22'38", longitude T 112°47'38". To predict the maximum sea waves’ height, a 16 years wind data was taken.
To estimate the sea waves’ height, comprehensive wind data provided by National
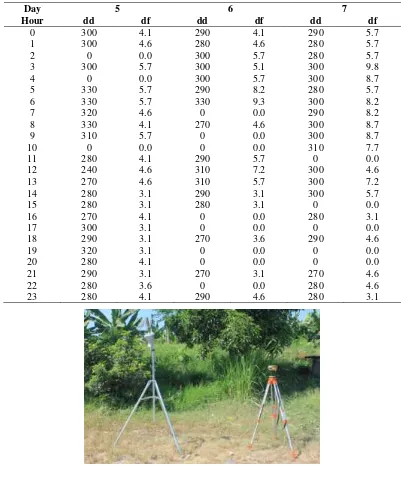
Oceanic & Atmospheric Administration U.S. Department of Commerce (NOAA) from 2000-2016 is needed [19–24]. Beside the secondary data provided by NOAA, direct measure as primary data was also taken using Weather Station, which was installed facing north at
7°31’54” S, 112°49’19” E.
2.3. Sea Waves’ Height
In predicting the sea waves’ height two methods are used, i.e. analytical method via Sverdrup,
Munk and Bretchneider (SMB method) equation as well as graphical method using waves’ height predicting chart in Shore Protection Manual (SPM method) or Darby Shire Method (DSM method) [14]. SMB method is used to predict sea waves’ height by transforming wind data into wave data. Graphical method can be used based on wind direction, duration as well as fetch length [14].
Table 1. Sample of one-week wind data
Day 1 2 3 4
Hour dd df dd df dd df dd df
0 270 2.6 290 2.6 300 4.6 300 4.1 1 270 2.6 270 3.6 280 5.7 300 5.1
2 270 3.1 270 3.6 0 0.0 290 4.6
3 300 3.1 270 3.1 280 8.7 290 4.6
4 270 3.1 0 0.0 300 8.7 300 4.6
5 300 3.1 270 4.1 330 5.1 300 5.7 6 300 4.1 270 4.1 320 4.6 300 4.6
7 0 0.0 320 7.7 290 4.1 310 5.7
8 0 0.0 320 4.1 320 4.1 310 7.7
9 250 2.6 320 5.7 320 4.6 320 7.2
10 0 0.0 330 5.1 0 0.0 330 4.6
11 0 0.0 320 4.1 0 0.0 320 4.1
12 360 1.5 280 3.1 310 4.6 300 4.1 13 0 0.0 270 2.6 270 3.1 290 4.1
14 0 0.0 0 0.0 0 0.0 300 4.6
15 0 0.0 0 0.0 260 3.1 290 4.1
16 0 0.0 0 0.0 0 0.0 0 0.0
17 0 0.0 0 0.0 0 0.0 0 0.0
18 0 0.0 280 3.1 290 4.6 220 4.1
19 0 0.0 0 0.0 0 0.0 0 0.0
20 0 0.0 0 0.0 0 0.0 0 0.0
21 280 3.1 0 0.0 0 0.0 280 3.1
22 280 3.1 280 3.6 0 0.0 0 0.0
Table 1 Sample of one-week wind data (continue)
Figure 2. Installation of Geodetic Receiver and Weather Station in Tanjung Sari
Furthermore, wind speed data is transformed into wind rose to determine the dominant wind direction. After the direction is confirmed, wind at the nearest land can be obtained by transforming the existed wind data using shallow water equation.
Ts = Period (second) H = Depth (m)
UA = Duration of windspeed (m/second)
3. RESULTS
As can be seen in Table 2, the wind speed and direction data for 16 years’ synoptic data at the research site with respect to Beaufort scale are provided. It also can be seen that as much as 68.2% of wind is categorized calm. Meanwhile, the result shows that 11.4% wind direction is east and 6.3% is west. Furthermore, maximum wind of 29-38 km/h, which is categorized as fresh, blows from north, east, south, and west.
Table 2 Wind speed and direction with respect to Beaufort scale Wind Velocity
(km/h)
Wind Direction (%) North North
East
East South East
<1 68.227
≥1 <6 1.036 1.774 8.988 4.132
≥6 <12 0.089 0.134 2.383 0.408
≥12 <20 0.005 0.001 0.009 0.001
≥20 <29 0.003 - 0.001 0.001
≥29 <39 0.001 - 0.001 -
Total 1.134 1.909 11.382 4.541
Table 2 Wind speed and direction with respect to Beaufort scale (continue) Wind Velocity
(km/h)
Wind Direction (%) South South
West
West North
West
<1 68.227
<1 <6 1.873 1.985 5.795 2.031
<6 <12 0.048 0.033 0.508 0.506
<12 <20 - - 0.011 0.013
<20 <29 - 0.001 0.002 -
<29 <39 0.001 - 0.002 -
Total 1.922 2.018 6.317 2.551
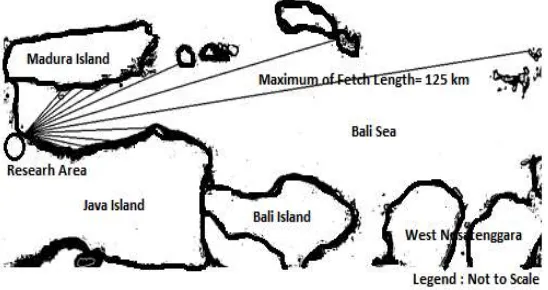
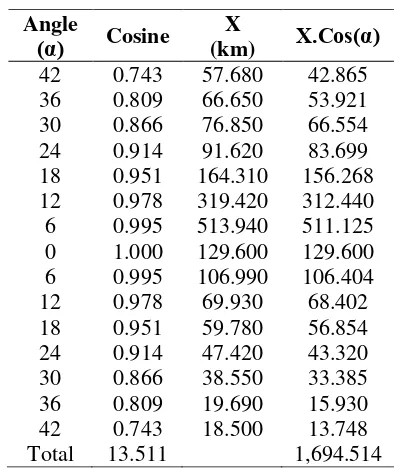
The determination of the Fetch length in the research area can be seen in Table 3, which
shows that the total fetch length (x cos α) is 1694.5 km and total cosine is 13.5. Thus, the result of fetch length (x cos α) divide total cosine is 125.4 km.
Table 3. Fetch length calculation Angle
(α) Cosine (km) X X.Cos(α) 42 0.743 57.680 42.865 36 0.809 66.650 53.921 30 0.866 76.850 66.554 24 0.914 91.620 83.699 18 0.951 164.310 156.268 12 0.978 319.420 312.440 6 0.995 513.940 511.125 0 1.000 129.600 129.600 6 0.995 106.990 106.404 12 0.978 69.930 68.402 18 0.951 59.780 56.854 24 0.914 47.420 43.320 30 0.866 38.550 33.385 36 0.809 19.690 15.930 42 0.743 18.500 13.748 Total 13.511 1,694.514
After the wind rose is obtained, the effective fetch length with respect to the dominant wind direction is evaluated. Based on Figure 3, the maximum effective fetch length is 125.4
km. The outcome is further presented in Table 3, which shows 16 years’ data collection based on wind rose generated from 2000 until 2016. The analysis is further done via SMB and DSM method. It is also worth noting that the maximum wind speed is 34.96 knot in 2009. Finally,
the sea waves’ height evaluation is presented in Table 4.
Figure 4 Windrose of the research area (2000-2016)
Table 4. Fetch length calculation Years Waves’ height
(m)
Years Waves’ height (m)
DSM SMB DSM SMB
Regarding 16 years data recorded, the analysis results of analytic and graphical method show that the maximum sea wave height forecasting in the range of 0.280 to 0.880 m. Meanwhile, Table 5 shows the sea level rise is 15 mm/year. Thus, from the results, three scenarios can be considered, i.e. at high, best estimate, and low condition. The first scenario, i.e. high, has the highest impact to the research site. The results indicate that Kali Alo, Tegal Sari, and Tanjung Sari will be submerged in 50 years if first scenario occurs. In second scenario, most of fishponds in Kali Alo, Tegal Sari, and Tanjung Sari will be submerged in 50 to 80 years. If the second scenario occurs, i.e. best estimate, 2 m height embankment can be constructed to protect the site. Meanwhile, in third scenario, i.e. low, only a few areas of the site will be submerged in 50-80 years.
Table 5. Scenario of sea level rise
Scenario TW
(cm)
SLR (cm)
WH (cm)
Total 50 years
(cm)
80 years
(cm)
High 130 1,5 88 293 338
Best Estimate 40 1,2 60 160 196
Low 30 1,0 28 108 138
4. CONCLUSIONS
The results show that by using new method in this research, synoptic data can be used as adaptation planning and design against climate change. Furthermore, to provide three
scenarios in predicting the sea level rise, data of tidal waves, sea waves’ height, and sea level rise per year is needed.
ACKNOWLEDGEMENT
The authors would like to express appreciation for the support of the sponsors of Petra Christian University project number: 07/HB-Penel/LPPM-UKP/I/2018 and Directorate General of Higher Education Indonesia and Kopertis VIII, project number: 002/SP2H/LT/K7/KM2017.
REFERENCES
[1] D. Hollis and T. Rosen, United nations convention on law of the sea (UNCLOS), 1982, The Encyclopedia of Earth, 22, 2010.
[2] A.R. Nugroho, R. Akhwady, D. Metakaryanto, and F. Yahya, Studi Model Distribusi Pencemaran di Pantai Utara Jawa Tengah Menggunakan Model MIKE 21 ECOLab, Jurnal Sains & Teknologi Lingkungan, 8(2), 2016, 89–100.
[3] Miski, Banjir Rob Akibatkan 7 Hektare Lahan Warga Gagal Panen, accessed on June 9, 2016, https://metronews.com, 2016.
[4] M. Hayidan, Petani Tambak Gagal Panen, accessed on May 20, 2016, Radar Pekalongan, 2016.
[5] Primadoni, Sawah Masyarakat Gagal Panen Terdampak Banjir Rob, accessed on May 13, 2016, https://covesia.com, 2016.
[6] U. Indra, Dihajar Rob, Siap-siap Petani Tambak Sidoarjo Gagal Panen, accessed on June 20, 2016, https://pojokpintu.com, 2016.
[8] B. Fajerial, 13 Kabupaten di Jawa Timur Terkena Rob dan Gelombang Tinggi, accessed on June 10, 2016, https://nasional.tempo.co/read/778710/13-kabupaten-di-jawa-timur-terkena-rob-dan-gelombang-tinggi, 2016.
[9] S. Hadi, Kecamatan Jabon Sidoarjo Diserbu Banjir Rob, accessed on December 6, 2017, http://news.metrotvnews.com/read/2017/12/06/798223/kecamatan-jabon-sidoarjo-diserbu-banjir-rob, 2017.
[10] R.C. Asuncion and M. Lee, Impacts of Sea Level Rise on Economic Growth in Developing Asia, ADB Economics Working Paper Series, 507, 2017.
[11] J.A. Church and N.J. White, Sea-level rise from the late 19th to the early 21st century, Surveys in geophysics, 32(4–5), 2011, 585–602.
[12] J.-C. Ciscar, L. Szabó, D. Van Regemorter, and A. Soria, The integration of PESETA sectoral economic impacts into the GEM-E3 Europe model: methodology and results, Climatic Change, 112(1), 2012, 127–142.
[13] J. Dronkers, J.T.E. Gilbert, L.W. Butler, J.J. Carey, J. Campbell, E. James, C. McKenzie, R. Misdorp, N. Quin, and K.L. Ries, Strategies for adaptation to sea level rise, Report of the IPCC Coastal Zone Management Subgroup: Intergovernmental Panel on Climate Change, Geneva, 1990.
[14] S. Hallegatte, A framework to investigate the economic growth impact of sea level rise, Environmental Research Letters, 7(1), 2012, 015604.
[15] Warlan, Ribuan Hektar Tambak Terancam Gagal Panen, accessed on June 21, 2016, https://ekspress.com, 2016.
[16] R.J. Nicholls, Planning for the impacts of sea level rise, Oceanography, 24(2), 2011, 144– 157.
[17] M. Schaeffer, W. Hare, S. Rahmstorf, and M. Vermeer, Long-term sea-level rise implied by 1.5 C and 2 C warming levels, Nature Climate Change, 2(12), 2012, 867.
[18] M.W. Strassburg, B.D. Hamlington, R.R. Manrung, J. Lumban-Gaol, B. Nababan, and K.-Y. Kim, Sea level trends in Southeast Asian seas, Climate of the Past, 11(5), 2015.
[19] S. Hermawan, An Integrated Decision Support System (Dss) For the Management of Sustainable Mariculture in Indonesia, Advances in Environmental Biology, 9(7 S2), 2015, 21–28.
[20] S. Hermawan and H. Gunawan, High Spatial Grid Resolution of Hydrodynamic Numerical Modeling for Sea Current Energy Site Selection in Indonesia, Journal of Telecommunication, Electronic and Computer Engineering (JTEC) Special edition, 10(2– 3), 2018, 163–167.
[21] S. Hermawan, Implementation of Decision Support System for Integrated Coastal Zone Management of Sustainable Mariculture Development Industry in Indonesia, Civil Engineering Dimension, 18(2), 2016, 117–126.
[22] H. Edy, I.H.N. Yuwono, and D. HE, Model Distribusi Kecepatan Angin Dan Pemanfaatannya Dalam Peramalan Gelombang Di Wilayah Timur Indonesia (Pulau Sulawesi, Nusa Tenggara, Maluku Dan Papua), Universitas Gadjah Mada, Yogyakarta, 2004.
[23] CERC, Shore Protection Manual, US Army Engineer Waterways Experiment Station, US Government Printing Office, Washington, DC, 2, 1984.