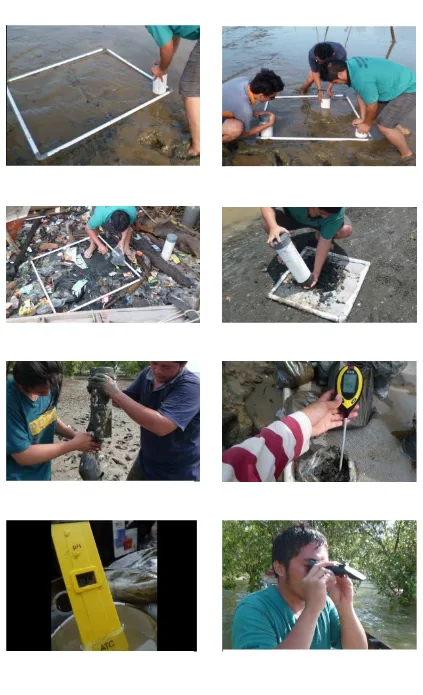
Lampiran 1. Proses Pengambilan Sampel
Gambar 1. Pemasangan Plot 1 × 1 meter
Gambar 2. Pemasangan
Corer
Gambar 3. Pengumpulan Makroplastik
Gambar 4. Pengumpulan Makrozoobentos
Lanjutan Lampiran 1. Proses Pengambilan Sampel
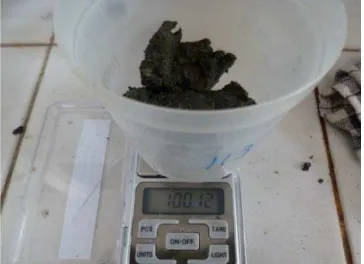
Lampiran 2. Proses Analisis Fraksi Substrat
Gambar 1. Penimbangan Substrat
Gambar 2. Penambahan Larutan
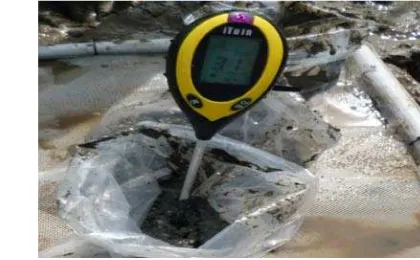
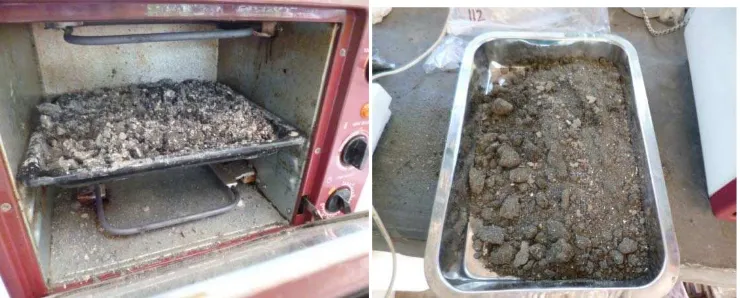
Lampiran 3. Proses Analisis Mikroplastik
Gambar 1. Pengeringan
Gambar 2. Penghalusan
Gambar 3. Penambahan NaCl Jenuh
Gambar 4. Pemisahan Densitas
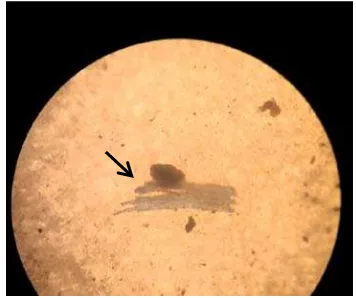
Lanjutan Lampiran 3. Proses Analisis Mikroplastik
Gambar 6.
Fiber
Gambar 7. Fragmen
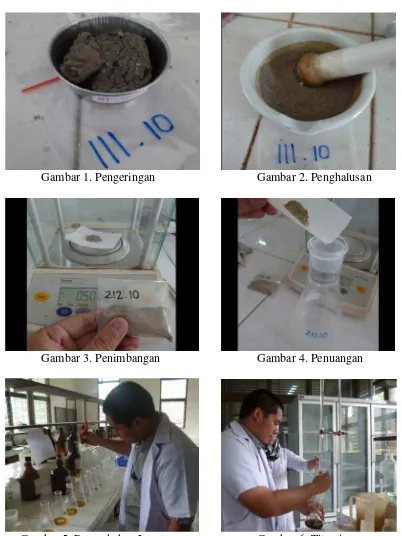
Lampiran 4. Proses Analisis C-Organik
Gambar 1. Pengeringan
Gambar 2. Penghalusan
Gambar 3. Penimbangan
Gambar 4. Penuangan
Lampiran 5.
Analisis Uji Beda Nyata Makroplastik Antarstasiun
Chi-Square 10,782
df 2
Asymp. Sig. ,005
a. Kruskal Wallis Test
b. Grouping Variable: STASIUN
H0: Kepadatan makroplastik antarstasiun tidak berbeda nyata
Lanjutan Lampiran 5.
Analisis Uji Beda Nyata Makroplastik Antarstasiun
Mann-Whitney Test Uji Beda Nyata Stasiun 1 dan 3
Ranks
Mann-Whitney U 21,500
Wilcoxon W 66,500
Z -1,687
Asymp. Sig. (2-tailed) ,092
Exact Sig. [2*(1-tailed Sig.)] ,094b
a. Grouping Variable: STASIUN
b. Not corrected for ties.
Lanjutan Lampiran 5.
Analisis Uji Beda Nyata Makroplastik Antarstasiun
Mann-Whitney Test Uji Beda Nyata Stasiun 1 dan 2
Ranks
Mann-Whitney U 16,500
Wilcoxon W 61,500
Z -2,123
Asymp. Sig. (2-tailed) ,034
Exact Sig. [2*(1-tailed Sig.)] ,031b
a. Grouping Variable: STASIUN
b. Not corrected for ties.
Lanjutan Lampiran 5.
Analisis Uji Beda Nyata Makroplastik Antarstasiun
Mann-Whitney Test Uji Beda Nyata Stasiun 2 dan 3
Ranks
Mann-Whitney U 7,000
Wilcoxon W 52,000
Z -2,964
Asymp. Sig. (2-tailed) ,003
Exact Sig. [2*(1-tailed Sig.)] ,002b
a. Grouping Variable: STASIUN
b. Not corrected for ties.
Lampiran 6.
Analisis Uji Beda Nyata Makroplastik Antarplot
Chi-Square 10,954
df 2
Asymp. Sig. ,004
a. Kruskal Wallis Test
b. Grouping Variable: Plot
H0: Kepadatan makroplastik antarplot tidak berbeda nyata
Lanjutan Lampiran 6.
Analisis Uji Beda Nyata Makroplastik Antarplot
Mann-Whitney Test Uji Beda Nyata Makroplastik Plot 1 dan 2
Ranks
Mann-Whitney U 15,000
Wilcoxon W 60,000
Z -2,256
Asymp. Sig. (2-tailed) ,024
Exact Sig. [2*(1-tailed Sig.)] ,024b
a. Grouping Variable: Plot
b. Not corrected for ties.
Lanjutan Lampiran 6.
Analisis Uji Beda Nyata Makroplastik Antarplot
Mann-Whitney Test Uji Beda Nyata Makroplastik Plot 1 dan 3
Ranks
Mann-Whitney U 8,500
Wilcoxon W 53,500
Z -2,836
Asymp. Sig. (2-tailed) ,005
Exact Sig. [2*(1-tailed Sig.)] ,003b
a. Grouping Variable: Plot
b. Not corrected for ties.
Lanjutan Lampiran 6.
Analisis Uji Beda Nyata Makroplastik Antarplot
Mann-Whitney Test Uji Beda Nyata Makroplastik Plot 2 dan 3
Ranks
Mann-Whitney U 19,000
Wilcoxon W 64,000
Z -1,909
Asymp. Sig. (2-tailed) ,056
Exact Sig. [2*(1-tailed Sig.)] ,063b
a. Grouping Variable: Plot
b. Not corrected for ties.
Lampiran 7.
Analisis Uji Beda Nyata Mikroplastik Antarstasiun
Chi-Square 18,480
df 2
Asymp. Sig. ,000
a. Kruskal Wallis Test
b. Grouping Variable: STASIUN
H0: Kepadatan mikroplastik antarsubstasiun tidak berbeda nyata
Lanjutan Lampiran 7.
Analisis Uji Beda Nyata Mikroplastik Antarstasiun
Mann-Whitney Test Uji Beda Nyata Stasiun 1 dan 2
Ranks
Mann-Whitney U 16,500
Wilcoxon W 61,500
Z -2,123
Asymp. Sig. (2-tailed) ,034
Exact Sig. [2*(1-tailed Sig.)] ,031b
a. Grouping Variable: STASIUN
b. Not corrected for ties.
Lanjutan Lampiran 7.
Analisis Uji Beda Nyata Mikroplastik Antarstasiun
Mann-Whitney Test Uji Beda Nyata Stasiun 1 dan 3
Ranks
Mann-Whitney U 21,500
Wilcoxon W 66,500
Z -1,687
Asymp. Sig. (2-tailed) ,092
Exact Sig. [2*(1-tailed Sig.)] ,094b
a. Grouping Variable: STASIUN
b. Not corrected for ties.
Lanjutan Lampiran 7.
Analisis Uji Beda Nyata Mikroplastik Antarstasiun
Mann-Whitney Test Uji Beda Nyata Stasiun 2 dan 3
Ranks
Mann-Whitney U 7,000
Wilcoxon W 52,000
Z -2,964
Asymp. Sig. (2-tailed) ,003
Exact Sig. [2*(1-tailed Sig.)] ,002b
a. Grouping Variable: STASIUN
b. Not corrected for ties.
Lampiran 8.
Analisis Uji Beda Nyata Mikroplastik Antarplot
Chi-Square ,032
df 2
Asymp. Sig. ,984
a. Kruskal Wallis Test
b. Grouping Variable: STASIUN
H0: Kepadatan mikroplastik antarstasiun tidak berbeda nyata
Lampiran 9. Analisis Korelasi Fraksi dengan Mikroplastik
Correlations Fraksi Mikroplastik Stasiun 1
Correlations
LIAT PASIR DEBU MIKROPLSTKST1
LIAT Pearson Correlation 1 -,935** ,837** ,509**
MIKROPLSTKST1 Pearson Correlation ,509** -,709** ,787** 1
Sig. (2-tailed) ,007 ,000 ,000
N 27 27 27 27
Lanjutan Lampiran 9. Analisis Korelasi Fraksi dengan Mikroplastik
Correlations Fraksi Mikroplastik Stasiun 2
Correlations
LIAT PASIR DEBU MIKROPLSTKST2
LIAT Pearson Correlation 1 -,800** ,713** -,575**
MIKROPLSTKST2 Pearson Correlation -,575** ,645** -,626** 1
Sig. (2-tailed) ,002 ,000 ,000
N 27 27 27 27
Lanjutan Lampiran 9. Analisis Korelasi Fraksi dengan Mikroplastik
Correlations Fraksi Mikroplastik Stasiun 3
Correlations
LIAT PASIR DEBU MIKROPLSTKST3
LIAT Pearson Correlation 1 -,591** ,058 ,435*
MIKROPLSTKST3 Pearson Correlation ,435* -,599** ,466* 1
Sig. (2-tailed) ,024 ,001 ,014
N 27 27 27 27
**. Correlation is significant at the 0.01 level (2-tailed).
Lampiran 10. Analisis Korelasi Makrozoobenthos, Makro- dan Mikroplastik
Correlations
Makrozoobenthos, Makro- dan Mikroplastik
Correlations
Abundace K.Makroplastik K.Mikroplastik
Abundace Pearson Correlation 1 -,633** -,386*
Sig. (2-tailed) ,000 ,047
N 27 27 27
K.Makroplastik Pearson Correlation -,633** 1 ,756**
Sig. (2-tailed) ,000 ,000
N 27 27 27
K.Mikroplastik Pearson Correlation -,386* ,756** 1
Sig. (2-tailed) ,047 ,000
N 27 27 27
**. Correlation is significant at the 0.01 level (2-tailed).
Lampiran 10. Analisis Korelasi Makrozoobenthos, Fraksi Sedimen dan
C-Organik
Correlations
Makrozoobenthos, Fraksi Sedimen dan C-Organik
Correlations
Liat Pasir Debu COrgnk KMakrozoobenths
Liat Pearson Correlation 1 -,697** ,478** ,530** ,367**
KMakrozoobenths Pearson Correlation ,367** -,285** ,206 ,141 1
Sig. (2-tailed) ,001 ,010 ,066 ,209
N 81 81 81 81 81
Lampiran 11.
Analisis Uji Beda Nyata Fraksi Sedimen Berdasarkan Bagian
Atas, Tengah dan Bawah
Kruskal-Wallis Test
Chi-Square 10,983 22,298 39,631
df 2 2 2
Asymp. Sig. ,004 ,000 ,000
a. Kruskal Wallis Test
b. Grouping Variable: PLOT
H0:
Fraksi Sedimen Berdasarkan Bagian Atas, Tengah dan Bawah
tidak berbeda
nyata
H1:
Fraksi Sedimen Berdasarkan Bagian Atas, Tengah dan Bawah
berbeda
nyata
Lampiran 12.
Analisis Uji Beda Nyata Fraksi Sedimen Berdasarkan
Stratifikasi Kedalaman
Kruskal-Wallis Test
a. Kruskal Wallis Test
b. Grouping Variable: Depth