177
E-Learning Systems
Josua Tarigan
Faculty of Economics, Petra Christian University Jl. Siwalankerto 121-131 Surabaya 60263
E-mail: josuat@ petra.ac.id
ABSTRAK
Kepuasan pengguna memegang peranan sentral dalam organisasi sebagai salah satu metode dalam mengukur tingkat kesuksesan atas implementasi e-learning system. Tujuan dari penelitian ini adalah untuk mengevaluasi kepuasan pengguna dan melihat pengaruh antara kepuasan pengguna dan faktor kualitas dari e-learning system. Kerangka berpikir dari penelitian ini menggunakan teori e-learning satisfaction (ELS) dan teori global satisfaction. Penelitian ini menggunakan analisa data dari 190 end-user e-learning system sebagai responden. Hasil penelitian menunjukkan adanya hubungan positif diantara kepuasan pengguna dan kualitas e-learning system.
Kata Kunci: kepuasan pengguna, e-learning system, teori e-learning satisfaction, teori global satisfaction
ABSTRACT
User satisfaction has held a central role in an organization as one of the measurements for the success of service delivery. The objectives of this study are to evaluate user satisfaction and examine the association between user satisfaction and the qualities in the e-learning systems of Multionational Company. A theoretical framework is developed, through the integration of e-learning satisfaction (ELS) theory and global satisfaction theory. The analysis was organized from a set of data which involve 190 responses from end-users. The main finding confirms some degree of a positive association between user satisfaction and the qualities in the e-learning system.
Keywords: user satisfaction, e-learning systems, ELS theory, global satisfaction theory
INTRODUCTION
The case for multionational company in this research is a leading single-source provider of IT solutions and services covering the entire IT value chain from consulting and design to system integration, implementation and management of IT infrastructures. This organization offers the services for organizations with core expertise in SAP implementation and integration for several industries. Since its established in 1995, the organization has expanded from an enterprise with only a single customer and a single line of business to a global end-to-end provider of solutions and services in information and communications technology. The company has 2,900 SAP consultants and 2,500 systems integration consultants worldwide exchang-ing real project experience and support. Its covers the whole value chain started from consultation, design, implementation, operation and maintenance. They operate the SAP Certified Customer Competence
Center to support their customers in locations spanning nine time zones, from East Asia to the Middle East. This company is the biggest Support Center of SAP Application in Thailand to ensure smooth and productive on-going operation and
maintenance of their customers‟ SAP‟s systems. In day-to-day operation, this company tries to ensure that its entire employee have knowledge and
skills according to their job‟s roles. One of the
processes regarding this concern is a continuous learning process for the entire employees whether as junior or senior employees. Continuous learning process in this company is conducted by classroom training and e-learning. E-learning at the organization includes two objectives as follows:
1. To increase the level of employees knowledge by delivering an online, scalable and flexible framework for knowledge build-up.
The e-learning system at this company uses a fully web-based application with the “anywhere and
anytime” concept. It goes through a security layer
ensuring that the users are authenticated before any further process. At the beginning, the e-learning content was focused on SAP-related trainings. The duration of e-learning starts from 15 minutes to 1 hour, not including the exam. The exam must be completed by the employees at the end of e-learning course. In case an employee can not pass the examination, then he/she must retake the examina-tion. The e-learning at this organization comprises of the following features:
1. Access. When entering the e-Learning, the user is presented with his or her own personal home page that contains information directly useful for the learner by using provided links. This area will be used as news and link broadcasting to active courses.
Explore. Every employee can search for the course from the assorted catalogs and, then, enroll for course.
2. Learn. Each employee has a learning profile that covers all of the learning programs and modules in which he or she currently enrolls. Also, there is a training history that captures the details of all previously enrolled courses and programs. Each employee can view their current learning records, tests, grades, personal calendar and overall status. 3. Exam. After completing each chapter, employees
take exams. The result is published, real-time, and made available to the employees as users and their managers as well.
As one of the service that management delivers to their employee, they must know the degree of user satisfaction towards the e-learning systems. Also, they must realize the qualities that affect user satisfaction in the e-learning system. Such qualities are learner interface quality, learning community quality, content quality, and personalization quality. Chen & Lin (2007) and Yeo et al. (2002) said that one of the measurements for the success of service delivery is satisfaction. In the context of e-learning, the measurement is user satisfaction or satisfaction from the employee who are using the e-learning system.
LITERATURE REVIEW
E-Learning Satisfaction
Satisfaction is widely accepted as a desirable outcome of any product or service experience. It is measured by the perception of the pleasurable fulfillment of needs and wants. In other words, it is a
post-consumption judgment which is assessed based
on the customer‟s perception regarding the product or service (Siritongthaworn & Krairit, 2006). E-learning is one of the most significant recent developments today. In simple words, satisfaction in the context of e-learning means the perception of learners towards the online or e-learning system (Chen et al., 2004).
Methods of user‟ satisfaction measurement is a
critical issue both in university and in company. The measurement of satisfaction should use more than one
quality (Wang, 2003). Based on Giese and Gote‟s
findings (cited in Wang, 2003), e-learner satisfaction can be defined as a summary of responses towards e-learning activities, and is stimulated by several focal aspects, such as content quality, user interface, learn-ing community, customization, and learnlearn-ing perfor-mance. The logic is the same as the traditional class-room-based instruction, which has multiple aspects that influence learner satisfaction.
In context of company, e-learning satisfaction measurement is useful for the e-learning manager/ coordinator to identify factors that affect the satisfac-tion. The result can assist the manager/coordinator is improving the e-learning system (Chen, 2004). This will solve negative critical problems from the learners and would significantly increase the user satisfaction. In another point of view, Wisher & Curnow (1998) suggested that the evaluation or satisfaction measure-ment includes three primary objectives (cited in Zhang & Nunamaker, 2003):
1. Positive results will help to gain or maintain the organizational e-learning system for training. 2. Satisfaction measurement can serve as unique
insight for an e-learning coordinator, instructors and management as well.
3. Insight can be gained from subgroup/modules/ department of employees, allowing for analysis of the training to impact across subgroups.
E-Learning Satisfaction (ELS) Model
The e-learning satisfaction (ELS) model was developed by Wang in 2003. The model includes four qualities which are learner interface quality, learning community quality, content quality, and
personalize-tion quality. According to Wang‟s study, the ELS
116 respondents (Wang, 2003). Wang‟s model found
by the researcher are more specific for the e-learning system rather than another model such as Kano or CIT. Kano or CIT is not the specific instrument/ model used to measure e-learning satisfaction. Kano‟s model was developed for product development or
marketing area while CIT‟s model was for multi -discipline area.
In the theory of e-learning systems, there are two modes, namely asynchronous and synchronous mode. Wang developed the asynchronous mode rather than synchronous mode (Wang, 2003). Essentially the asynchronous mode is where the communication, collaboration and learning can occur in “different
time” and also in “different place” (Hisham, 2004).
This mode will be very useful when lecturers need to manage large numbers of students. In the case of university students, they face a number of issues, such as balancing the competing demands of work, family and study. The ability to access and communicate in asynchronous mode can meet many of their needs of
a “just for me” learning environment (Hisham, 2004). The companies that use the concept “different time”
and “different place” will also fit this mode. Asyn -chronous mode usually takes the following forms (Wulf, 1996; Hiltz & Wellman, 1997; cited in Zhang & Nunamaker, 2003):
1. Company intranets that distribute training mate-rials or curriculum to its employees
2. Interactive tutorials on the web 3. Collaborative systems for discussion
4. Electronic mail (delivering learning materials, sending/receiving assignments, and getting/giving feedback)
5. Public electronic bulletin boards/newsgroups 6. Downloading learning materials from knowledge
repositories via the internet
7. The use of online databases and websites to acquire information and pursue research
The second mode, which is the synchronous mode, allows the learners to interact with each other
in the “same time” but “differentplace”. Synchronous
e-learning enables interface qualities to make the learners feel more like that they are members of a learning society than asynchronous mode. The inte-raction among learners and instructors is also done in real-time. However, it loses the flexibility. Currently, the majority of e-learning system uses asynchronous communication technologies because they are simpler to develop and not too expensive compared to the synchronous ones Zhang and Nunamaker, 2003).
The ELS model developed by Wang considers the multi-qualities instead of single quality
measure-ment. Operationally, the ELS model can be con-sidered as a summation of satisfactions with various attributes or items in each quality. Wang (2003) said that e-learner satisfaction is believed as the factor that affects post-learning behaviors, such as complaining or reuse intention. Based on this theoretical frame-work, satisfaction appraisal is generally measured based on learner perception after they use the e-learning system. Wang (2003) said that most behavior researchers would agree that satisfaction influences future usage intention or complaining behavior. Students with high levels of satisfaction are expected to have higher levels of reuse intention and make less complaint.
Wang collected the sample from five inter-national organizations in Taiwan, which are Taiwan Semiconductor Manufacturing Corporation (TSMC), United Microelectronics Corporation (UMC), Compal Electronics, Inc., MiTAC International Corporation, and Dell Taiwan. To be consistent with the exchange-specific nature of ELS conceptualization, respondents were restricted to those who had used at least one e-learning program/course prior to the survey. One hundred and sixteen screened and qualified respon-dents self-administered the 26-item questionnaire, which asked the respondents to name one e-learning system that they had used in the previous 3 weeks. For each question, the respondents were asked to circle the response which best described their level of agreement.
Many previous researchers confirm the reliabi-lity and validity of the ELS model. One of them is Siritongthaworn and Krairit, which are the researchers from Thailand. They perform the sample from 11 universities in Thailand in 2004. They used ELS model to measure user satisfaction. The significant result from this research showed that communication with support staff is a vital characteristic of e-learning system. The communication refers to the response from the support staff. Another researcher regarding the ELS model is Hisham et al. (2004) which measured whether learner interface quality, learning community quality, content quality, and
personalize-tion quality affect students‟ satisfacpersonalize-tion. They use two
implementation. She also found the same things with Siritongthaworn and Krairit (2006) which was the importance of communication in e-learning system.
The following items are some of advantages that the ELS model, which are the reasons for the researcher to adopt the ELS model in this study: 1. The ELS model offers the instruments, which are
specific within e-learning or online learning con-text. This makes the instruments provide a more accurate diagnostic tools to assess e-learning activities within organizations.
2. The ELS model captures multiple aspects of e-learner satisfaction by providing insight into the nature of interrelationships among ELS qualities. Operationally, the ELS model can be considered as a summation of satisfactions with various attributes or items in each quality.
3. The ELS model is a more comprehensive model since developed from user information satisfac-tion, end-user computing satisfacsatisfac-tion, customer satisfaction and student satisfaction. It means the model was developed from both the organiza-tional information systems and teaching/training context.
4. The model developed by Wang was asynchro-nous instead of synchroasynchro-nous mode, which is more useful and fit for many organization whether it is a university or a company that uses
concept of “anywhere” and “anytime”.
Global end User Satisfaction Theory
Two global satisfaction criteria were developed by Doll et al. (1988) cited in Xiao (2002). The criteria were used as overall satisfaction measurement in the context of end-user satisfaction. Xiao & Dasgupta (2002) said the operationalize definition by Doll et al. (1988) cited in Xiao (2002) had been tested by many researchers. Wang (2003) also used these criteria to measure the satisfaction of learner for the develop-ment of ELS model. The two global satisfaction
criteria include “Isthe system successful?” and “Are you satisfied with the system?”
Two global satisfaction criteria was developed using a seven-point Likert-type scale, with anchors
ranging from „„strongly disagree‟‟ to „„strongly agree.‟‟
Doll et al. (1988) cited in Xiao (2002) used the 618 end-users from IS (information systems) end-users from five different firms: a manufacturing firm, two hospitals, a city government and a university. Furthermore, to validate the reliability of two global satisfaction criteria, they conducted a retest study in 1991. Based on the results of all of those studies, Doll et al. (1988) cited in Xiao (2002) claimed the criterion
is valid to be used as the measurement of the quality in end-user satisfaction.
The Modification Process of ELS Model in this Study
The ELS modification process will be conducted by eliminating learning community quality from
Wang‟s model and add “learner support quality” in
this study. The reason for eliminating learning community quality is the e-learning system in this company does not cover this quality. Wang (2003) mentioned that learning community will be measured by the following items:
1. The degree of ease to make discussion with other students/ users
2. The degree of ease to share the content that the users learn
3. The degree of ease to make discussion with the tutor
In this company, all of these items are not covered in the e-learning system. Wang said that
“learning community” measurement will be used if
all of the above items are directly covered in the e-learning system. It means when the learners want to discuss with other users or tutors then they will use the tools as a part of e-learning system. The additional learner support quality is needed because Wang model does not cover this quality, while, in this company, the quality appears as a part of e-learning system. The details about this quality will be discussed further in this chapter as a part of learner support quality explanation.
THE HYPOTHESIS
Learner Interface Quality
learning and information retention. Moreover, techno-logy should not become a barrier (Ardito et al. 2006). The need for learner interface quality has been long recognized in e-learning system design literature as a critical quality criterion in determining user satisfaction (Wang, 2003). In this particular context, issues of learner interface quality have significant factors that directly influence the end-user satisfaction (Ardito et al., 2006; Allen, 2003; Wischmeyer, 2004). Learner interface quality is related with ease to use, system stability, ease to find the content and attractiveness, including the use of colors, text layout and fonts. Hall said user interface refers to the overall look and feel of the e-learning system that allows learners to access information (cited in Wentling et al. 2000).
Interface elements should support people to learn in various contexts according to the selected peda-gogical objectives, both in a university and in a company. The designer of e-learning should place the learners at the center of the interface design. It could be started by understanding learner profiles. Further-more, the researchers from Knowledge and Learning Systems Group, University Of Illinois at Urbana-Champaign, identified the principles to design the user interface in e-learning system (Wentling et al., 2000) as provided below:
1. Learners do not want to go more than three clicks to find what they need.
2. Learners are appreciated at a navigation frame that is always available.
3. Learners are sensitive to the readability of the screen text, its layout, and consistent screen design. The formatting and spacing of the text as well as color are also important.
4. Learners prefer to scroll through a page, as opposed to using internal links to navigate. However, a link between the top of the page and the bottom of the page is appreciated.
5. Learners want a direct indication of what is new on a page or site as soon as possible.
With the same conclusion, Wang (2003) said that the learner interface quality of e-learning system has an impact on user satisfaction by:
1. The degree of ease to access 2. The degree of ease to use;
3. The degree of stability of the e-learning system; 4. The degree of ease to find the content that users
need; and
5. The degree of attractiveness (layout, colors, gra-phics).
However, these measurements from Wang will be used in operationalization of the variable.Wang
also said that good performance from this quality would result in user satisfaction because learner interface quality is the quality directly related with user experience. This conclusion is also supported by another researcher that conducted the ELS model, as mentioned before in the previous topic. This conclusion leads to the following hypothesis:
H1: Learner Interface quality (EL-LI) is positively influenced user satisfaction.
ContentQuality
Content quality is described as the courses, modules or learning objects. In terms of the shift of the user learning habits to the technology-based courses, the content quality should be carefully designed to enhance its user satisfaction. The reason is the content quality is considered as a principal element in user satisfaction of the e-learning system. This quality could be presented as a real value added for users (Azzam, 2006). Similarly, Schramm also suggested that e-learning satisfaction is influenced more by the content quality in the learning materials than by the type of technology used to deliver the instructions (cited in George, 2004).
Barron said (2003) the content quality will have a big impact if combined with personalization quality. It means that the users can choose the content quality based on their needs (Barron, 2003). Since each learner has different expectations related to the content quality, it is desirable for the e-learning system to provide user-oriented personalization of content quality. Adaptive e-learning systems seek to make the e-learning content quality more attractive by
tailoring it to individual user‟s goals and interests.
International Data Corporation (IDC) has indicated that the level of customization of content quality is the most important factor that determines the satisfaction for end-user and there is a strong trend towards customized content quality (cited in Muntean, 2007). Muntean (2007) said all the benefits of e-learning will be lost when the content quality cannot support the delivery of personalized e-learning materials. However, the degree of personalization quality from content quality depends on the objective of e-learning process in each organization. It will affect the cost and the complexity of the e-learning system.
Wang (2003) said the content quality of the e-learning system has an impact on user satisfaction by: 1. The degree of ease to understand regarding the
explanation in the content quality;
2. The degree of providing up-to-date content quality; and
According to Bellinger (2007), dissatisfaction in content quality can result from a disconnection between the subject matter experts (SMEs) who create the courses and the system designers who produce the programs. Furthermore, Bellinger (2007) said most organizations can not handle this problem which makes the SMEs rely on self-authoring content management systems. Dissatisfaction also results from the systems that can not provide sufficient materials for understanding a subject matter. Some of the e-learning systems, for example, only provide PowerPoint slides of lectures and an online discussion forum, which are not enough for users to obtain good understanding of content quality. Therefore, e-learn-ing systems need to provide an online environment similar to a traditional classroom by presenting synchronized instructional videos, PowerPoint slides, and lecture notes (Zhang & Nunamaker, 2003).The results of many empirical studies have also indicated
that content quality is important in determining users‟
level of satisfaction from end-user (Lee, 2006). This leads to the following hypothesis:
H2: Content quality (EL-CT) is positively influenced user satisfaction
Personalization Quality
The personalization quality refers to how to provide the most appropriate content for users according to their interests and needs. However, even though the personalization qualities are related with content quality, it can not be combined into one quality since the measurement for both of them is different from such measurement that Wang used in the ELS model. Personalization quality is used as one of the strategies in ideal e-learning implementation. There are many ways to personalize e-learning, starting from the simplest to the most complex, which is from naming recognition until the whole content personalization. Each degree of complexity has a specific impact on user satisfaction (Martinez, 2002). Wang and another researcher that used the ELS model found that personalization quality has a positive association with user satisfaction. In another point of view, Teo & Gay (2006), the researchers from Nanyang Technological University said that personalization with a bad quality could be an impediment factor to the successful adoption of e-learning. Teo & Gay define personalization quality as the learner-centric aspect of e-learning.
According to Wang (2003), personalization quality from the e-learning system has an impact on user satisfaction by:
1. The degree of enabling users to choose the content they need;
2. The degree of system that encourage users‟ ability to learn the sub-content that they want to learn; and
3. The degree of system that provides sufficient data about user performance.
All the above items from Wang fit the e-learning policy in this company. There is another item, which
has not been covered yet by Wang. The item is “the
degree that users can continue the incomplete course from the last cut-off”. According to the company policy, the e-learning system allows the users to stop the learning process temporarily and to continue it whenever they want. This aligns with one of the e-learning objectives in this study, which is to increase the flexibility of learning process. All the above explanations show that personalization quality is a significant factor that drives user satisfaction. This leads to the following hypothesis:
H3: Personalization quality (EL-PS) is positively associated to user satisfaction
Learner Support Quality
This is an additional quality or variable in this research. There are two reasons why this quality are added in this study. First, this quality was added according to the significant contribution from the previous researcher. The significant contribution was mentioned in the previous topic by Siritongthaworn & Krairit (2006) and Lee (2006). They mentioned that communication with support staff is the critical factor that affects user satisfaction. Communication in this context is the response or feedback from the e-learning support whether by phone or email. Hisham et al. (2004) found that the users need a supportive learning in order to be satisfied with their e-learning environment system. Furthermore, Warner (based on his research in 2004) discussed that providing information to the users by automatic email is one of learner support quality; it has a significant correlation with user satisfaction (cited in Hisham et al. 2004). The same conclusion was also found by another researcher such as Webster & Hackley (1997), Keeney (1999) and Pitt et al. (1995) (cited in Levy, 2006).
The second reason is this company provides learner support quality in the e-learning system. The types of e-learning support in the company are presented below:
2. Functional support from e-learning coordinator/ team. Functionality means the entire non-infrastructure support, such as support towards the complains from the learners about the content. The complaint possibly because one or two points in the content could not be related with the course topic. The same thing can also happen regarding the examination; that is the existing question is not related with the course topic.
3. Infrastructure support from IT-Service Desk. This supports the IT infrastructure in the e-learning system, such as networking, failure to access the portal, failure of user name or password, etc.
Since learning support quality is exist at this company and the previous research mentioned that this quality is important for user satisfaction, then the researcher adds this quality in this study. This leads to the following hypothesis:
H4: Learner Support quality (EL-LS) is positively influenced user satisfaction
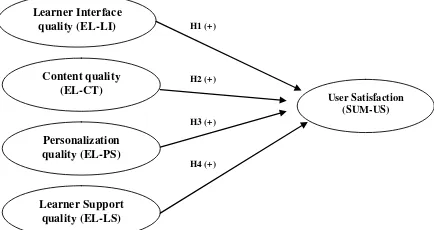
The followingfigure presents the concept illustrating the relations between the quality of ELS after modification and user satisfaction. The qualities of e-learning system that will be examined here are learner interface quality, content quality, personali-zation quality and learner support quality. Literature review discussed that the quality from e-learning system can drive the level of user satisfaction. Therefore, this research will examine the correlation of each quality towards user satisfaction. The conceptual model in this research is developed from the ELS theory by Wang (2003) and from the end-user satisfaction theory by Doll et al. (1988) cited in Xiao (2002).
Figure 1. Conceptual Model for User Satisfaction in this Study
RESEARCH METHODOLOGY
Neuman (2000) said that the sampling is the units in population that the researcher wishes to study. There are varieties of means to choosing population
or cases as a sample. In general there are two types of sampling methods, which are non-probability sampling and probability sampling. This research uses non-probability sampling or convenience sampling method. This method attempts to obtain a sample of convenient elements. The selection of sampling units is left primarily to the interviewer (Malhotra, 2006).
The population of this research was all of the employees in this company. In order to determine a sample size, the researcher used Krejcie and
Morgan‟s table of sample size of known population
with confidence interval 95%. According to the Human Resource information, there were around 350 employees at this company, meaning 186 sample size should be minimum to use in this reserach (Krejcie & Morgan, 1970). However, this reserach conducted with 190 sample size.
Research Questionnaires
This research used a questionnaire to gather the information from the respondents. The questionnaire developed by the researcher was based on the theoretical framework and previous studies. Accord-ing to the conceptual model, which has been elaborated in the previous chapter, this research examined the correlation between e-learning quality and user satisfaction. These qualities were the representatives of four independent variables in this study; they were learner interface quality, personali-zation quality, content quality and learner support quality. The measurement scale used in this research was seven-point Likert scale. The respondent were asked to rate the site for each quality using a scale ranging from 1 (strongly disagree) to 7 (strongly agree). However, to justify the variable and to operationalize definition from ELS model (Wang, 2003) whether it was appropriate for this study or not, the researcher conducted several activities.
1. Make consultation with the e-learning coordinator at this company.
2. Analyze the content and the types of e-learning at the company.
3. Consider the inputs from the previous research or contributions that related to the ELS model.
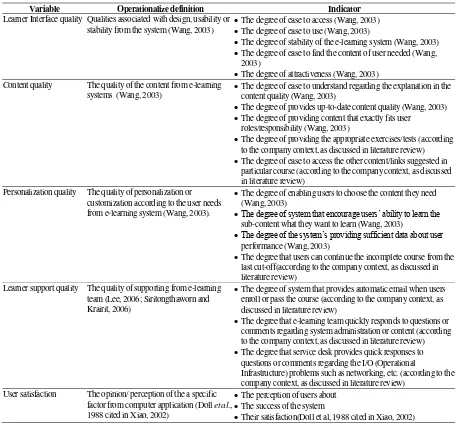
In this case, it can be said that this study used the operationalized from Wang model. Some of the new operationalized not covered by Wang model were added to make it fit with this study.Table 1 describes the modification variable measurement and operatio-nalize definition. In the table, there are modification of operationalize definition as well.
H1 (+)
H4 (+) H3 (+) H2 (+)
Learner Interface quality (EL-LI)
User Satisfaction (SUM-US)
Content quality (EL-CT)
1. Add the item “the degree that provides the
appropriate exercises/tests” in content quality.
This item synchronizes with one of the features that e-learning offers at this study. The feature in
this context is an “exam” that has been discussed
in “introduction”. This item was not included in
Wang‟s model.
2. Add the item “the degree of easy to access the other contents/links that suggested in particular
course” in content quality. This item is added because the e-learning system at this study offers quite many links inside of content quality.
3. As discussed before, the item “the degree of user can continue the incomplete course from the last cut-off” will be added in personalization quality. According to the company policy, the e-learning
system allows users to stop the learning process temporarily and to continue it whenever the users want. This aligns with one of the e-learning objectives in this company, which is to increase the flexibility of learning process.
4. Add the item “the degree of automatic email when
the users enroll or pass the course”, “the degree of
responses from the e-learning coordinator/team”
and “the degree of responses from IT-Service
Desk”. These three items are added because they
exist in the e-learning system of this company as learner support quality. Furthermore, those items are also suggested from the previous research regarding user satisfaction in the e-learning system.
Table 1. Variable, Conceptual Definition and Operationalize Definition
Variable Operationalize definition Indicator
Learner Interface quality Qualities associated with design, usability or stability from the system (Wang, 2003)
The degree of ease to access (Wang, 2003)
The degree of ease to use (Wang, 2003)
The degree of stability of the e-learning system (Wang, 2003)
The degree of ease to find the content of user needed (Wang, 2003)
The degree of attractiveness (Wang, 2003) Content quality The quality of the content from e-learning
systems (Wang, 2003)
The degree of ease to understand regarding the explanation in the content quality (Wang, 2003)
The degree of provides up-to-date content quality (Wang, 2003)
The degree of providing content that exactly fits user roles/responsibility (Wang, 2003)
The degree of providing the appropriate exercises/tests (according to the company context, as discussed in literature review)
The degree of ease to access the other content/links suggested in particular course (according to the company context, as discussed in literature review)
Personalization quality The quality of personalization or customization according to the user needs from e-learning system (Wang, 2003).
The degree of enabling users to choose the content they need (Wang, 2003)
The degree of system that encourage users‟ ability to learn the
sub-content what they want to learn (Wang, 2003)
The degree of the system‟s providing sufficient data about user
performance (Wang, 2003)
The degree that users can continue the incomplete course from the last cut-off(according to the company context, as discussed in literature review)
Learner support quality The quality of supporting from e-learning team (Lee, 2006; Siritongthaworn and Krairit, 2006)
The degree of system that provides automatic email when users enroll or pass the course (according to the company context, as discussed in literature review)
The degree that e-learning team quickly responds to questions or comments regarding system administration or content (according to the company context, as discussed in literature review)
The degree that service desk provides quick responses to questions or comments regarding the I/O (Operational
Infrastructure) problems such as networking, etc. (according to the company context, as discussed in literature review)
User satisfaction The opinion/ perception of the a specific factor from computer application (Doll et al., 1988 cited in Xiao, 2002)
The perception of users about
The success of the system
Data Analysis
Multiple regression analysis in this research was used to investigate whether each quality in the e-learning system was associated with user satisfaction. The estimation of model is shown below.
SUM-US = a + b.EL-LI + e.EL-CT + d.EL-PS + c.EL-LS
where,
a = constant for regression
b, c, d, e = coefficient from independent variables EL-LI = learner interface quality
EL-CT = content quality EL-PS = personalization quality EL-LS = learner support quality
RESEARCH RESULTS
The researcher collected 190 the questionnaires that are filled out completely by the respondents. This research used the SPSS software (v. 11.5) to analyze the data. In this study the researcher followed the methodology used by Doll et al. (1988) cited in Xiao (2002) and Wang (2003) to analyze the data. The researcher analyzed the construct validity by factor analysis and item-total correlation. After the researcher had conducted with, preliminary analysis, researcher used multiple regressions to analyze the data.
Factor Analysis
To conduct the factor analysis, the researcher expected the factors (question in questionnaire) to load on the constructs originally identified by the earlier study. A principle component matrix analysis with a VARIMAX rotation was employed in this research. There are 17-item questions in this study, excluding the two-item score of global satisfaction. Based on Doll et al. (1988) cited in Xiao (2002) and Wang (2003), this study assumed that the two global measures of end-user satisfaction should be valid. This study took the threshold value of 0.5 for factor loading criterion.
Table 2 shows that all of the questions are above 0.5. Therefore, no item needs to be dropped. The next step for preliminary analysis is the item-total correlation.
Item-Total Correlation
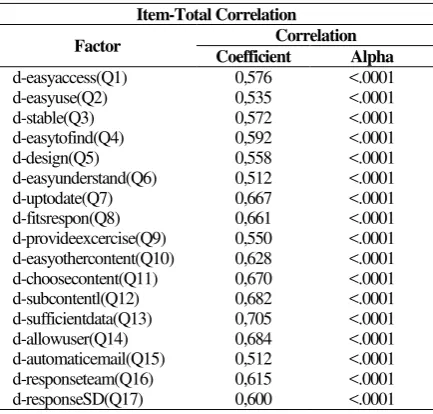
By following the procedures suggested by Doll et al. (1988) cited in Xiao (2002) and Wang (2003), researcher examined the correlation between score of each item and the total scores of all the questions. Table 3 lists the result of correlation assessment.
According to Doll et al. (1988) cited in Xiao (2002) and Wang (2003), there is no accepted standard of cutoff threshold, therefore this study took the same cutoff value of 0.5 as they did in their study.
Table 2. Rotated Component Matrix
Rotated Component Matrix Component
1 2 3 4
d-easyaccess(Q1) 869 d-easyuse(Q2) 867
d-stable(Q3) 851
d-easytofind(Q4) 886
d-design(Q5) 889
d-easyunderstand(Q6) 816
d-uptodate(Q7) 882
d-fitsrespon(Q8) 845
d-provideexcercise(Q9) 837 d-easyothercontent(Q10) 874
d-choosecontent(Q11) 761
d-subcontentl(Q12) 847
d-sufficientdata(Q13) 789
d-allowuser(Q14) 838
d-automaticemail(Q15) 507
d-responseteam(Q16) 941
d-responseSD(Q17) 934
Extraction Method: Principal Component Analysis. Rotation Method: Varimax with Kaiser Normalization. a rotation converged in 6 iterations.
Table 3. Item-Total Correlation
Item-Total Correlation
Factor Correlation
Coefficient Alpha
d-easyaccess(Q1) 0,576 <.0001 d-easyuse(Q2) 0,535 <.0001
d-stable(Q3) 0,572 <.0001
d-easytofind(Q4) 0,592 <.0001
d-design(Q5) 0,558 <.0001
d-easyunderstand(Q6) 0,512 <.0001 d-uptodate(Q7) 0,667 <.0001 d-fitsrespon(Q8) 0,661 <.0001 d-provideexcercise(Q9) 0,550 <.0001 d-easyothercontent(Q10) 0,628 <.0001 d-choosecontent(Q11) 0,670 <.0001 d-subcontentl(Q12) 0,682 <.0001 d-sufficientdata(Q13) 0,705 <.0001 d-allowuser(Q14) 0,684 <.0001 d-automaticemail(Q15) 0,512 <.0001 d-responseteam(Q16) 0,615 <.0001 d-responseSD(Q17) 0,600 <.0001
As shown in table 3, all item coefficients are above the threshold of 0.5. The researcher went to the multiple regression analysis without dropping any item in the research.
Hypotheses Testing
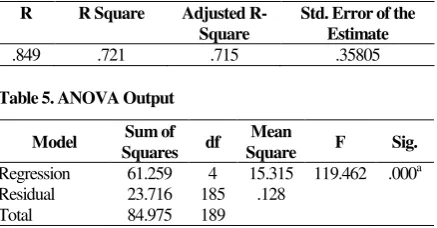
the variance in SUM_US is explained by the four independent variables. This means 28% of the variance in end-user satisfaction cannot be explained by four qualities in the e-learning system. Therefore there must be other variables that have an influence on the e-learning system as well. The “adjusted R
-square” gives some ideas of how well the model can be generalized. In this research the difference for the final model is small, in fact the difference between the values is 0.721 - 0.715 = 0.006 (around 0.6%). This shrinkage means that if the model were derived from the population rather than a sample, it would account for approximately 0.6% less variance in the outcome.
Table 4. Model Summary
Predictors: (Constant), EL_LS, EL_LI, EL_CT, EL_PS
Output ANOVA tests whether the model results are in a significantly good degree of prediction of the outcome variables. This research show that the significance level is at p < 0.001. Therefore can be concluded that the regression model from this research in a significantly better predictor of end-user satisfaction than the mean value of end-user satisfaction. In short, the regression model overall significantly well predicts end-user satisfaction. Therefore, ANOVA is used to test whether the model from regression is significantly better at predicting the outcome than using the mean as a „best guess‟ (Andy, 2000). can be formulated into the equations shown below. SUM-US = a + b.EL-LI +e.EL-CT + d.EL-PS +
c.EL-LS= 1.12 + 0.11 EL-LI + 0.21EL-CT + 0.22 EL-PS + 0.28 EL-LS
The β value indicates a relative influence of the entered variable; that is EL_LS (learner support quality) has the greatest influence on end-user satisfaction (Beta = 0.281), followed by EL_PS (personalization quality) and then EL_CT (Content quality). Based on the above data analysis, H1, H2, H3 and H4 are proven since there are positive associations among learner interface quality (EL_LI); content quality (EL_CT); personalization quality (EL_PS); learner support quality (EL_LS) and user satisfaction. The association between dependent and independent variable is significant, at p < 0.001. Therefore, the researcher can conclude that the regression model from this research in a significantly better predictor of end-user. Coefficient correlation indicates that around 72% of the variance in SUM_US is explained by the function:
SUM_US= 1.12 + 0.11 EL-LI + 0.21EL-CT + 0.22 EL-PS + 0.28 EL-LS
DISCUSSION, RECOMMENDATION AND IMPLICATIONS
can the numbers of avenues of future research. Future research can attempt to identify additional items and variables of satisfaction toward the e-learning system.
REFERENCES
Allen, M.2003. Classic Learner Interface Errors. The E-Learning Developers‟ Journal.
Andy, F. 2000. Discovering Statistics Using SPSS for Windows: Advanced Technique for the Beginner. Thousand Oaks:Sage Publications.
Ardito C., Costabile M. F., De Angeli A. & Lanzilotti, R. Systematic Evaluation of E-Learning Systems: An Experimental Validation. Paper was presented at the 4th Nordic Conference on Human-Computer Interaction, Norway, 14-18 October.
Azzam, M. 2006. Quality E-Learning Content: A Principal Component of The Universal Digital Library (UDL) and Highlights on Egypt’s Regional Role in The Arabic E-Content Development. Paper was presented at the 2nd Universal Digital Library Conference, Egypt, 17-19 November.
Barron, T. 2003. Learning on Demand Survey: Quality and Effectiveness of E-Learning. Retrieved from http://www.sric-bi.com/lod.
Bellinger, A. 2007. E-Learning Today and Tomorrow. Retrieved from http://dev.trainingjournal.com/ tj/639.html.
Chen, L.S. & Lin, H.C. 2007. Integrating Kano’s Model into E-Learning Satisfaction. Paper was presented at the 2007 IEEE, Singapore, 25-28 September.
Chen, N.S., Lin, K.M. & Kinshuk. 2004. Assessment of E-Learning Satisfaction from Critical Incidents Perspective. Paper was presented at the 6th International Conference on Enterprise Information Systems, Portugal, 14-17 April.
George, J. 2004. Usability and Efficiency of E-Learning-Quality the Buzz Word. Internatio-nal JourInternatio-nal of the Computer, the Internet and Management, 12(2): 126 -131.
Hisham, N., Campton, P. & FitzGerald, D. 2004. A Tale of Two Cities: A Study on the Satisfaction of Asynchronous E-learning Systems in Two Australian Universities. Paper was presented at the 21st ASCILITE Conference, Australia, 5-8 December.
Krejcie, R.V. & Morgan, D.W. 1970. Determining Sample Size for Research Activities. Journal
of Educational and Psychological Measure-ment, 30(3): 607-610.
Levy, Y. 2006. Assessing the Value of E-Learning Systems. New York: Information Science Publishing (INFOSCI).
Lee, Y.C. 2006. An Empirical Investigation into Factors Influencing the Adoption of an E-Learning System. Online Information Review, 30(5): 517-541.
Malhontra, N. K. 2006. Marketing Research: An Applied Approach. Third Edition. New Jersey: Prentice-Hall.
Martinez, M. 2002. Adaptive Personalized Learning: Supporting Individual Learning Difference. Society for Technical Communication.
Muntean, C. H. & Muntean, G.M. 2007. Open Corpus Architecture for Personalised Ubiquitous E-learning.
Neuman, W. 2000. Social Research Methods: Quali-tative and QuantiQuali-tative Approaches. Needham Heights: Allyn and Bacon.
Siritongthaworn, S. & Krairit, D. 2006. Satisfaction in E-learning: the Context of Supplementary Instruction. Campus-Wide Information Systems, 23( 2): 76-91.
Teo, C. B. & Gay, R.K.L. 2006. A Knowledge-Driven Model to Personalize E-Learning. ACM Journal of Educational Resources in Computing, 6(1): 1-14.
Wang, Y.S. 2003. Assessment of Learner Satisfac-tion with Asynchronous Electronic Systems. Information and Management, 41(1): 75-86.
Wentling, T.L., Waight, C., Gallaher, J., Fleur, J. L., Wang, C. & Kanfer, A. 2000. E-Learning: A Review of Literature, Knowledge and Learning Systems Group.
Wischmeyer, K. 2004. Designing the E-Learning User Interface. White Paper Assignment ITEC.
Xiao, L. & Dasgupta, S. 2002. Measurement of User Satisfaction with Web-Based Information Systems: An Empirical Study. Paper was presented at the Eight Americas Conference on Information Systems.
Yeo, J., Aurum, A., Handzic, M. & Parkin, P. 2002. When Technology is Mandatory-Factors Influencing Users Satisfaction. Paper was presented at the International Conference on Computers in Education.
Quantitative Relations between Usability Attributes and Motivation to Learn. Paper was presented at the World Conference on Educational Multimedia, Hypermedia & Telecommunications, Switzerland, June 21-26.