RESEARCH ARTICLE
XXXXXXXXXXXXXXXXX
Copyright © XXXX American Scientific Publishers Advanced Science Letters
All rights reserved Vol. XXXXXXXXX Printed in the United States of America
Interactive Visualization Approach to Support
Exploratory Data Analysis: Illustration in Research
Topic Distribution
Mir’atul Khusna Mufida1, Ari Wibowo2 , Evaliata Br Sembiring3
1
Politeknik Negeri Batam, Jl. Ahmad Yani, Batam Centre Batam 29461, Kepulauan Riau, Indonesia
Nowadays, data has an important role to support decision making in different domains. Especially in research area and digital literacy. Research topic analysis and exploration can help to establish research comprehensive roadmap. Data driven engineering is one of the trend of information technology that can not be ignored. Abundant data as valuable resources to get data obscure interesting pattern. Normally, we use big data to get important information of it. The problem of raw data is this kind of data need to be preprocessed, explored and analyzed. Big data is a popular approach to characterize the data. Interactive visualization is one of the solution to examine big number of data (big data). Interactive visualization as an explication to make Big data easier to be explored and analyzed.
Keywords: Interactive Visualization, Big Data, Research.
1 INTRODUCTION
The final project is the course that every student should take at the end of his or her study. This course is an independent project taken by the students and monitored by the supervisor. The process of analyzing topic ever made before is an important step in determining the final project that will be done. The selection of final project topics sometimes creates problems for students. Even if they choose a topic that is not in accordance with the ability that will have an impact that is the result of the end of the student's task is done but the result is not the best even worse he can not graduate on time. In addition, lecturers are also interested in offering the latest topics for students in the field of lecturer research.
In the mean time, lecturers and students get difficulties to analyze the final project and research done previously which are collected manually in softcopy and hardcopy in the library. Therefore, it needs a solution that is able to facilitate how to
explore the final project topic information to be easier and more efficient.
Based on the above explanation, one of the solutions in this research is developing a system that capable to examine the final project and research topic using visualization technique.. Visualization is one of the popular approaches used because it can decompose the complexity of the data view to be simpler and easier to learn. Reference engine is an application that visualizes the data in the interactive ways to amplify user’s cognition. Reference engines apply interactive visualization methods that implement visual variables such as color, texture, size, position and interaction with data directly to learn more the data. The main feature of this application is to support the analysis process of the final project and research topic distribution based on some parameters namely study program, year, category, title, topic and supervisor or main researcher.
Adv. Sci. Lett. X, XXX–XXX, 201X
RESEARCH ARTICLE
instead of going to the library to open the research or final project documents manually they can benefit this application to explore the final project or research topic through images, graphics, color, shape, size and interaction. Reference Engine is expected to help students study the topic of the final project that existed and supervisors can use this application to offer topics according to their own research roadmap. Supervisors also have a history list of the final project that has ever been mentored previously with the parameters of the year, student name and category.
2 STATE OF THE ART
Interactive visualization is not the new solution to deal with big number and complex data. Visualization as a solution to overcome model complexity problem is a good instance 4. 6 Digital library that is made in 2007 by Sari Yullya using procedural way. The system is made to manage and recapitulate final project document. The same as application that is used for the same function but have 1 function in advance compare to digital library which is support consultancy procedure for the students 3. Interactive visualization as a novelty of this research than 2 other topics. Furthermore, research that has been done previously only manage research management of information system to recapitulate research document without analyze research topic distribution.
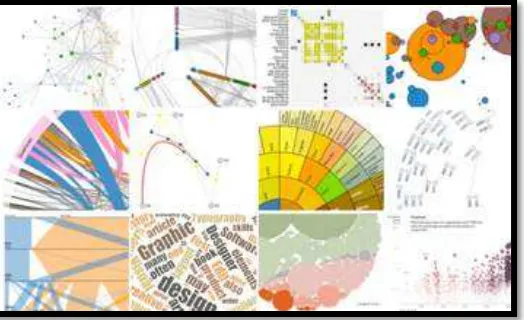
Fig. 1 Information Visualization
Figure 1 explain about visualization appearance. Visualization is used in many domains especially to overcome analyzing big number and multidimensional data. Interactive visualization approach related to information visualization which a method to translate textual data or information to visual form to augment user cognition 2. Information visualization supports data exploratory analysis including process to format many and complex data. This method tries to convert raw data to the graph as a solution to ad interactivity. For instances interactive visualization usage in small word graph 8. Information visualization includes interactivity 7 aspects as important component. Moreover, interactive approach guide to select particular interaction features that can be used to support examining data exploratory analysis.
3 ANALYSIS AND DESIGN
A. SYSTEM DESIGN
This research aims to develop interactive visualization and determine the strong point and pattern as an exploratory data analysis result. In order to accomplish target that we want we choose interactive visualization approach. Interactive visualization as a solution to reduce complexity of big data analysis Big data exploration problem causes by some factors such as data representation and dimension.
Interactive visualization method is popular as a result of ability to convert from textual information to visual representation. In addition, it helps to amplify user cognition about the data.
Figure 2 explain data preprocessing that involves excel, CSV and JSON file format.
Fig. 2 preprocessing raw data to JSON
Fig. 3 System Design
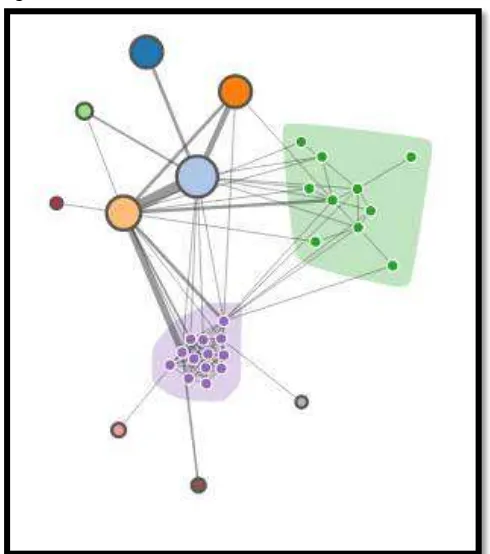
Reference Engine has two different users namely lecturer and student. Each user is able to access application with their particular role to the system. The visualization layout preferred is force layout such as Figure 4 with graph represented by nodes and link. Each node symbolizes topic and supervisor or lecturer.
RESEARCH ARTICLE
XXXXXXXXXXXXXXXXX
Fig. 4 Force Layout
B. INTERACTIVE VISUALIZATION
After layout next step is plan what kind of interaction that we can use to communicate amongst component and object. The direct interaction with the data is used to explore interesting parameter and show data tendencies. We assume that instead of only using visual variable to convert the data we can also improve visual data with interaction as exploration media.
We develop the application using JavaScript, JQuery and PHP including D3JS library. DBMS that is used is MySQL. The Seeking Mantra defined by Ben Snheiderman 7 explain about 6 Main factors of interactive visualization characteristic :
• Overview : Firsts time you see the data you already know
how the data behavior and what the data tendencies. In overview first we can see holistic features of the data as Figure 5.
• Detail on demand : This feature is used to allow user
examine about data in details. The information of the data is selected and consider as metadata and additional attribute to learn data behavior. This feature normally can be triggered by doing interaction such click or hover to the spot where we interested on.
• Extract : Advanced selection to explore particular dataset
• Zoom and filter : Expansion of detail on demand function
by performing ability to zoom the visual data representation and get closer to the data. Filter is one of the main feature of visualization because it provides ability to select only important features of the data attribute to be examined.
• Relate : Provide different perspective of the data
association and link within the data. This component is applied by finding as much as in common attribute between the data.
• History : User have full control to the action that they have
done before. They also be able to monitor the log of any interaction that they previously have done.
4 EXPERIMENTAL RESULT
In section 4, we will discuss about visualization investigation. Result of this analysis will be used to support new student to explore and find appropriate final project topics. On one hand, the visualization be able to demonstrate topic distribution based on some parameter such as year, category and supervisor. For instance in 2016 more than a half research topic taken by student is creating web based application. On the other hand, this application also be able to support the creation of the lecturer research roadmap. Finally the evaluation result can help to design final project curriculum and syllabus enhancement.
Categorization is based on 10 categories mention: 1. Information system
2. Application
3. Game
4. Website
5. Decision Support System
6. Interactive multimedia
7. Film
8. Geomatics
9. Networking
10. Data mining
This category group based on three research clusters that is Software development (SWD), Game and Multimedia Technology (GMT) and Network and Hardware Technology (NHT).
Adv. Sci. Lett. X, XXX–XXX, 201X
RESEARCH ARTICLE
Fig. 6 Home Page
Visual variable that is used in this visaulization is
color, size and position. Figure 7 clarify visual variable
usage to distinguish different group of data. The bigger the
node it contain more data than smaller node. Color represent
different research topic categories. It shows overview first
to know which group has member the most.
Fig. 7 Home Page
Figure 8 and 9 exhibit number of research topic for
each category and show detail on demand and zoom
features of interactive visualization.
Fig. 8 Game topic and detail on demand feature
Fig. 9 Software development topic and zoom
This application has dashboard to point up global
information of the data based on the category. Figure 10
represents total numbers of topics per groups.
Fig. 10 Application dashboard
Figure 11, 12 and 13 expose filter feature based on
year, extract and it also shows search output based on
RESEARCH ARTICLE
XXXXXXXXXXXXXXXXX
Fig. 11 Filter Result
Fig. 12 Extract result
Fig. 13 Search result
5 CONCLUSION
As a matter of fact, after we design, implement and test the Reference Engine, we summarize this research by emphasizing some items together with analysis of the data exploration support as mentioned:
1. Reference Engine proof that interactive visualization approach capable to represent research topic data using visual variable and interaction.
2. Reference engine as a research topic exploration media that can be used by lecturer, student and
topic as a state of the art.
3. Reference engine overview features illustrate research topic distribution in informatics school. Other components can be used to generate basic research roadmap strategy.
4. Interactive visualization component that is mostly used by the user namely Overview, Detail on demand, Extract, Zoom and filter and relate.
5. Interaction type that is mostly used as a experimental result are drag, drop, mouse hover, mouse out, click and double click to perform different feedback of the system.
6. Filter parameter that are used to group data in this research containing year, supervisor, topic category, although information about research methodology seems does not work properly because of methodology information extraction is limited.
7. The last three years, popular research topic is about software development (SWD).
8. Variety and more dimension of visual variable and visualization layout could be future reaserch development.
9. Data preprocessing need to be automated for any file format as an application input
ACKNOWLEDGMENTS
This work was supported by Politeknik Negeri Batam.
REFERENCES
[1] Carlis, John V., and Joseph A. Konstan. "Interactive visualization of serial periodic data." Proceedings of the 11th annual ACM symposium on User interface software and technology. ACM, 1998.
[2] Card, Stuart K., Jock D. Mackinlay, and Ben Shneiderman. Readings in information visualization: using vision to think. Morgan Kaufmann, 1999.
[3] Lukman, Chairudin, “Sistem Informasi Proyek Akhir dan Tugas Akhir Jurusan Teknik Informatika Politeknik Batam Berbasis Web.” Tugas akhir diploma tiga. Politeknik Negeri Batam, 2008.
[4] Mufida, Mir'atul-Khusna, et al. "MoVi: models visualization for mastering complexity in model driven engineering." Proceedings of the 2015 British HCI Conference. ACM, 2015.
[5] Politeknik Negeri Batam, Digital Library Politeknik Negeri Batam (DigiLib), 2007,tersedia pada link berikut : http://digilib.polibatam.ac.id.
[6] Sari, Yullya-Pramita, “Digital Library.” Tugas akhir diploma tiga. Politeknik Negeri Batam, 2007.
[7] Shneiderman, Ben. "The eyes have it: A task by data type taxonomy for information visualizations." Visual Languages, 1996. Proceedings., IEEE Symposium on. IEEE, 1996.