Volume 27, Number 1, 2012, 29 – 43
THE IMPACT OF MANUFACTURING CONCENTRATION
ON REGIONAL INEQUALITY:
A CASE OF REGENCY IN JAVA REGION, INDONESIA
Setyo Tri Wahyudi
Department of Economics Brawijaya University-Malang Indonesia
Mohd Dan Jantan
Department of Economics Universiti Utara Malaysia ([email protected])
ABSTRACT
Concentration of manufacturing is an interesting topic in location of economic activity since manufacturing was the leading sector in the Indonesian economy. The previous studies demonstrated that firms were localized in major metropolitan areas as well as a set of emerging regions. The paper aim to complement the findings of the previous studies related to geographical concentration of manufacturing industry by exploring the impact of manufacturing concentration on regional inequality in the regency in Java during the 1998-2007. The Theil index and the location quotient index are employed in order to analysis the inequality and the location of manufacturing industry in Java region.
The study found that t
he
Theil index shows an increasing trend implying that the inequality of the manufacturing industry within regencies has increase. While, the inequality between regency shows a decreasing trend over the period of observation implying that the manufacturing industry in Java spreads only in several regencies. The location quotient index shows an increasing trend that reveals the economy of some regencies are more dependent in manufacturing industry and at the same time it shows that several new manufacturing areas has emerged in Java.Keywords: concentration, inequality, manufacturing, Java region
INTRODUCTION
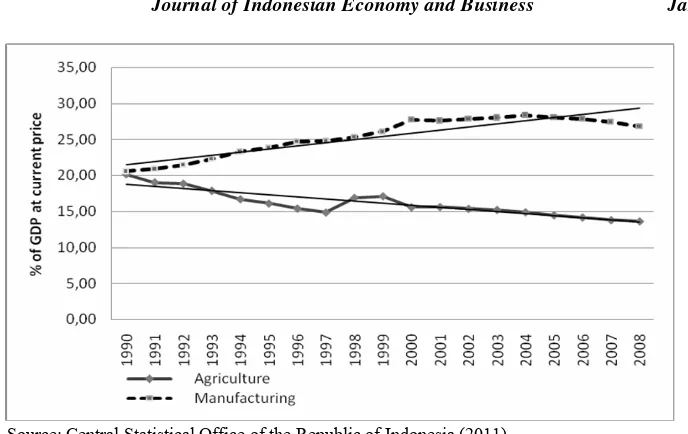
The structural change in Indonesia economic activities from agriculture to manufacturing sectors, as shown in Figure 1 shows that manufacturing has became an important sector in its contribution to the Indonesian Gross Domestic Product (GDP). During 1990-2008 the role of manufacturing is become important as the engine of growth while agricultural at the same time shows
Source: Central Statistical Office of the Republic of Indonesia (2011)
Figure 1. The Role of Manufacturing and Agricultural to Indonesia Gross Domestic Product (GDP) at Constant Prices 2000
The succeed picture regarding the devel-opment of manufacturing industry in Indone-sia, however, is not accompany by the distri-bution of manufacturing around the region. Manufacturing industry only concentrated in certain region and not in other. Data on the number of establishments of manufacturing industry between Java and outside of Java as presented in Table 1 shows that more than 80 percent of total manufacturing industry in Indonesia is located in Java, while the rest is distributed into outside of Java. Further, Kuncoro (2002) in his study found that the
concentration of manufacturing industry lo-cated in Java was formed that called two-poles patterns of concentration (bipolar pattern) between west and east region.
The densely population of Java is consid-ered as one of the factor that supported for the manufacturing industry to choose and located in Java. The high number of population in Java has an advantage in terms of localization and urbanization economies (Kuncoro, 2002). However, when viewed in more detailed, it was found that the economic activities were
Table 1. The Location of Indonesian Manufacturing Industry (No. of Establishments and Percentage)
Location 2000 2001 2002 2003 2004 2005
17,995 17,413 17,118 16,607 16,901 16,995
Java
(81.15%) (81.38%) (80.95%) (81.71%) (81.71%) (81.99%)
4,179 3,983 4,028 3,717 3,784 3,734
Outside of Java
(18.85%) (18.62%) (19.05%) (18.29%) (18.29%) (18.01%)
22,174 21,396 21,146 20,324 20,685 20,729
Total
(100) (100) (100) (100) (100) (100)
concentrated in certain areas only. It means that the concentration of manufacturing in-dustry in Java were geographical gaps in the smaller circles. For instance, observations in one pole of the existing concentration, Kuncoro (2002) found that there were several concentration of economic activities in the region, for example in Jakarta and surrounding areas such as Bogor, Tangerang and Serang, Bekasi, and Karawang the concentration of manufacturing was called Jabotabek Extended Industrial Area (EIA); Surabaya and the sur-rounding areas such as Sidoarjo, Gresik, Pasu-ruan, Mojokerto was called Surabaya EIA; city of Bandung and surrounding areas (Bandung and Purwakarta); Semarang and surrounding areas (Salatiga, Kudus, Kendal); and Surakarta and surrounding areas (Klaten, Sukoharjo, Karanganyar).
In recent years, the study related to indus-trial concentration in several countries has been carried out by many scholars while for developing countries is very rarely (Kuncoro, 2002). For Indonesian context, we found that only several studies focused on the industrial concentration such Kuncoro (2002) which took the samples throughout the provinces in Indonesia during 1976-2001; Landiyanto (2003) for the case of manufacturing industry in Surabaya for 1994 and 2002; Hidayati and Kuncoro (2005) for the case of manufacturing industry in Jakarta and Bandung for 1980-2000; Suria (2004) in the case of manufactur-ing industry in East Java for 1998-2003; and Arifin (2003) for the manufacturing industry in West Java between 1990-1999.
The motivation of the study is to investi-gate whether concentration of manufacturing industry have impact on regional inequality of the Java region. This paper is organized as follows: in the next section, we offer a brief review of the literature dealing with empirical studies related to manufacturing concentration and regional inequality. The methodology re-lated to data and details of the method of analysis are discussed in Section 3. Section 4
discusses the empirical finding. The summary and implication in Section 5.
LITERATURE REVIEW
This section discussed the literature deal-ing with empirical studies related to concen-tration of manufacturing and regional inequal-ity particularly in Indonesia contexts. The sev-eral empirical studies could be summarized from the studies Suharto (2002), Kuncoro (2002), Arifin (2003), Landiyanto (2003; 2005), and Hidayati and Kuncoro (2005).
Suharto (2002) explored the trend of re-gional disparity, specialization, and concen-tration of manufacturing employment in Indo-nesia by province and sub-sector with the fo-cus on the large and medium firms of manu-facturing industry. His study used secondary data on industrial survey conducted by Central Statistical Office of the Republic of Indonesia for period 1993-1996. The comparative tools consist of the Theil index; regional specializa-tion index, regional Gini coefficient, and loca-tional Gini coefficient were employed in his studies. He found that regional inequality in Indonesia manufacturing employment rela-tively high, compared to the international ine-quality standard. However, the study found that the disparity among province and the main island tended to be stable. To sum up, he concluded that the distribution of regional manufacturing industry employment was not different with the overall distribution (na-tional). With the exception of the wood (ISIC 33) and textile (ISIC 32) industries, the manu-facturing industry employment was relatively well distributed.
is-lands has played a prominent role in explain-ing the spatial inequality across provinces in Indonesia. Third, the pattern of spatial ine-quality formed a “U” curve suggesting a pe-riod of dispersing manufacturing activity has been replaced by a period of increasing geo-graphic concentration. Fourth, the Chow tests confirmed that structural change has occurred from 1985 onwards. In the main finding, he concluded that there was a challenge the gen-eral consensus in the new economic geography that trade liberalization encourages dispersing manufacturing activity.
Arifin (2003) identified the spatial con-centration of large and medium manufacturing industry throughout 25 districts in West Java, Indonesia. Using secondary and establishment data from Central Statistical Office of the Re-public of Indonesia for the period 1990 to 1999, the study employed the Geographic In-formation System (GIS), logistic regression, panel data regression and convergence analy-sis to identify whether the spatial concentra-tion exists in West Java. He found that the growth of industry in West Java was not dis-tributed equally among districts. Further, sev-eral districts have a high industry concentra-tion; meanwhile some district have a low dustry concentration. The manufacturing in-dustry mainly concentrated in Botabek (Bogor, Tangerang and Bekasi) and Bandung areas. The logistic regression results that labor cost (salary), output, FDI, economics of scale, dummy crisis and dummy industry were sig-nificantly explained on the concentration of manufacturing in West Java with different signs.
Using employment and value added data for manufacturing industries in Surabaya for period 1994 and 2002, and based on the LQ index, Ellison and Glaeser index (Ellison and Glaeser, 1997), and Maurel Sedillot index, Landiyanto (2003) found that manufacturing industry was concentrated in the sub-districts (kecamatan) of Rungkut, Tandes and Sawahan, which the industry of food,
bever-age, and tobacco and metal, machinery and equipment as a leading industry. Further, Landiyanto (2005) investigated the concentra-tion of East Java manufacturing industry, the locational distribution, and the relation be-tween the spatial concentration and speciali-zation of industrial in East Java. He used Lo-cation Quotient, Herfindahl Index, Elison-Glaeser Index, Krugman regional specializa-tion index, and Krugman bilateral index to analyze the data. He found that in manufac-turing industry, spatial concentration was de-termined by wages, transportation cost, market access, and externalities which related with localization economies and urbanization economies. The existence of spatial concen-tration has a relation with industrial speciali-zation which based on industrial structure on that region.
Bandung, and its surrounding regions known as Extended Metropolitan Region (EMR). The study also found the empirical evidence that by 2000, the developing of industrial agglom-eration in western polar has been developing into a network city joining Jakarta and Bandung Metropolitan Region as one big ag-glomeration.
METHODOLOGY
The main purpose of this section is to ex-plain the data and the method of analysis used in the study. The descriptions of the data are presented in the next section. This is followed by section two that describes the method of the analysis.
1. Data
The data used in the study is secondary data. The data is retrieved from the annual survey on large and medium size manufactur-ing industry conducted by Central Statistical Office of The Republic of Indonesia for period 1998 to 2007 which covers 96 regencies in six provinces in Java region. The six provinces are West Java, Central Java, East Java, D.K.I. Jakarta, D.I. Yogyakarta, and Banten. The West Java province consists of 19 regencies. While the Central Java and East Java, each consist of 31 regencies. The D.K.I. Jakarta, D.I. Yogyakarta, and Banten, each comprise of five regencies.
Medium and large size of manufacturing industry is defined as an establishment that has 20 or more workers. The 3-digit manufactur-ing industry is selected because it is the high-est level of disaggregated manufacturing in-dustry available at the regency level. The data set consists of value added, total number of employees, total payroll for all employees, production worker wages, and exports- or non-exports oriented types of industry. There are 43 three-digit manufacturing industry listed in the Kelompok Lapangan Usaha Industri (SIC).
For the purpose of the analysis, the data are selected based on the share of manufac-turing output of regency in the Regional Gross Domestic Product (RGDP). The high the share of manufacturing industry in the RGDP means that the high the dependent of a regency on manufacturing industry. The threshold of manufacturing contribution used in this study is a modified version of the study of Bostics, et al. (1997). In their study, Bostic, et al. used three threshold levels based on the share of employment in manufacturing industry as a percentage of total employment to determine a localized city-industry. The modified of threshold levels, using output data, in the present study are 0.5 percent, 1 percent, and 5 percent. The levels of threshold of output are determined arbitrarily. If the manufacturing industry in regency has a minimum threshold level of employment, for example 0.5 percent, then the regency is included in the sample. Any regency that has less than 0.5 percent level of manufacturfing employment is excluded from the sample.
2. Method of Analysis
The objective of study is to investigate the impact of manufacturing concentration on regional inequality in Java region. In order to investigate this impact, this study employed two procedures: (1) We employ the Theil in-dex to calculate whether inequality between and within region exist over the regency in Java region, and (2) We identify the manu-facturing specialization using location quo-tients (LQs) method. The calculation for those methods is given as follows:
(1) The Theil index
inequality since the index has ability to distin-guish the gap "between regions" (inequality between region) and gap "in one area" (within-region of inequality). In our study, the total of employment was chosen as the basis analysis to calculate Theil index. The formula is given as follows (Kuncoro, 2002):
where T(s) is the overall Theil index over spa-tial gaps in the Java which show from the share of regency i to total employment of manufacturing in Java, and N is the number of regency. Low index means low in the gap of inequality, and high index indicates high ine-quality.
In order to check whether concentration of manufacturing in each province based on em-ployment data using Equation 1 was given validity results, we will test using analysis of variance (ANOVA) with hypotheses as fol-lows:
Null hypothesis H0: α1 = α2 = α3 = …= αt Means that there is no differences con-centration of industrial location during observation.
Alternative hypothesis H1: α1 ≠ α2 ≠ α3 ≠…≠ αt Means that there is differences concentra-tion of industrial locaconcentra-tion during observa-tion.
The procedure testing is if the value of Fcalculated < Ftable, then null hypothesis (Ho) is
accepted and vice versa, meaning that it can be said there was no difference in the concentra-tion level of manufacturing based on employ-ment during the observation period (1998-2007).
(2) Location Quotient index
The location quotient is most frequently used in locational analysis, economic geogra-phy, and population geogrageogra-phy, but it has
much wider applicability. The location quo-tient (LQ) is an index for comparing an area's share of a particular activity with the area's share of some basic or aggregate. In our study, the LQ is used to identify areas of industrial specialization for industries, states, and re-gions. The LQ compares the proportion of employment in a particular industry within the local economy to the proportion of employ-ment in that same industry within a larger ref-erence economy (Miller, 1998; McCann, 2001). For computation, the following formula is used:
LQi = (ei/e) / (Ei/E) (2)
where LQi the location quotient of industry i in
the local region, eiemployment of industry i in
the local region, e total manufacturing em-ployment in the local region, Ei reference area
employment in industri i, E total reference area manufacturing employment. Here total manufacturing employment includes employ-ment in medium and large scale manufacturing industries. The regencies with a LQ greater than one are selected as having concentrated manufacturing and those with LQ of less than one are selected as having dispersed manu-facturing. An increase in the LQ value of a region can be considered as an indication of the increasing importance of the region as a locus of manufacturing activities.
FINDING
calculation for each threshold, our study was chosen 0.5 percent as the minimum threshold. Therefore, regency that has a minimum share of 0.5 percent manufacturing output in RGDP is included in the analysis.
The simulation for each threshold used in the study based on the data on growth regional domestic product for the whole regency in Java during 2006 and 2007. In 2006 we found that there were 42 out of 96 regencies that have a minimum of 0.5 percent of manufac-turing output in their GRDP in period 2006. However, there were 30 regencies that have a minimum of 1 percent of manufacturing out-put in their GRDP. If the threshold level was increased to 5 percent, then there were 11 re-gencies in the sample. Further, it is found that five regencies that have a minimum of 10 per-cent of manufacturing output in their GRDP. In 2007, there were 42 and 30 regencies for the threshold levels of 0.5 and 1 percents, re-spectively. For the threshold levels of 5 per-cent and 10 perper-cent, the number of regencies was 12 and 6 regencies, respectively. Thus, for the sample, this study employed a threshold level of 0.5 percent in selecting the sample of regency. Those regencies that have less that 0.5 percent level of manufacturing output in their GRDP are excluded from the analysis.
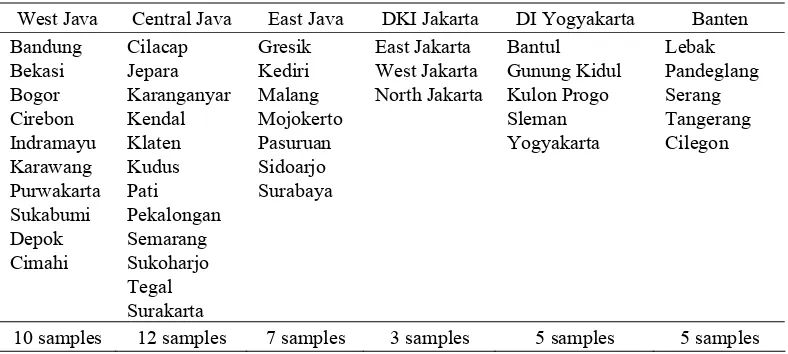
Based on the simulation using data on GRDP for each threshold as described previously, the study was chosen 0.5 percent of threshold as the minimum requirement for regency included in the sample, while other are exclude. Table 2 presents the sample of regencies that has a minimum 0.5 percent of manufacturing output in their GRDP. There were 10 out of 19 regencies in West Java were included in the sample of the study. Central Java was represented by 12 out of 31 regencies and East Java has 7 out of 31 regencies in the sample. All regencies in the D.I. Yogyakarta and Banten were included in sample, while 3 out of 5 regencies in D.K.I. Jakarta were also included. The total of samples used in the study is 42 out of the total 96 regencies (43.75 percent) in Java.
1. The Theil Index
The Theil index used to investigate the gap both between and within regions in Java based on the employment data. The Theil have two values, close to zero and close to one. If the value is close to zero means that the manu-facturing industry is more scattered, while if the Theil index is close to one means that the industry tends to be concentrated.
Table 2. Sample of Study considered, based on 0.5 percent of Threshold
West Java Central Java East Java DKI Jakarta DI Yogyakarta Banten Bandung Cilacap Gresik East Jakarta Bantul Lebak
Bekasi Jepara Kediri West Jakarta Gunung Kidul Pandeglang Bogor Karanganyar Malang North Jakarta Kulon Progo Serang
Cirebon Kendal Mojokerto Sleman Tangerang
Indramayu Klaten Pasuruan Yogyakarta Cilegon
Karawang Kudus Sidoarjo
Purwakarta Pati Surabaya
Sukabumi Pekalongan
Depok Semarang
Cimahi Sukoharjo
Tegal
Surakarta
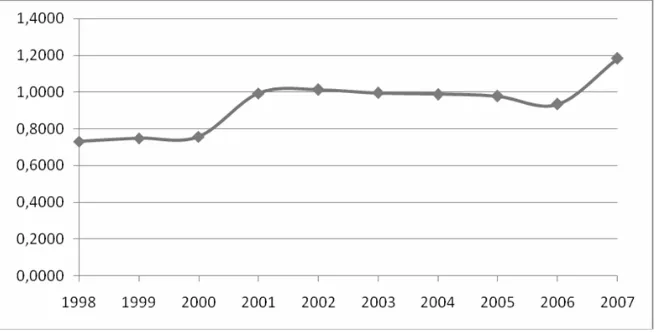
(a) The Trend
Table 3 and Figure 2 display the trend of the Theil index for 42 regencies in Java during 1998-2007. From the Table 3, it can be seen that the Theil index for regency in Java during the period of observation shows an increasing trend. An increasing in the Theil index shows inequality within a regency, while for inequal-ity between regency shows decreasing gradu-ally over the period of observation. It indicates that manufacturing industry in 42 regencies in Java are spread only in several regencies. Furthermore, the existence of this fluctuation
also reflects the existence of gaps. However, to ascertain whether there were changes in the concentration levels or not, we need to test statistically, and it is explained in the next sec-tion.
An increasing trend in the Theil index in-dicates that during 1998 to 2007 there is a de-creasing dispersion of manufacturing industry in Java. In other words, until 2007 there is sufficient evidence that spatial concentration of manufacturing industry in Java has increase gradually.
Table 3. The Theil Index for Java based on Regency, 1998-2007
Percentages Year Between Regency Within Regency Total
(Between/Total) (Within/Total)
1998 0.2610 0.7306 0.9917 26.32 73.68
1999 0.2662 0.7480 1.0141 26.25 73.75
2000 0.2660 0.7563 1.0222 26.02 73.98
2001 0.2655 0.9940 1.2595 21.08 78.92
2002 0.2416 1.0130 1.2546 19.26 80.74
2003 0.2373 0.9958 1.2331 19.25 80.75
2004 0.2412 0.9876 1.2288 19.63 80.37
2005 0.2304 0.9773 1.2077 19.08 80.92
2006 0.2249 0.9337 1.1586 19.41 80.59
2007 0.2304 1.1828 1.4133 16.30 83.70
Inequality between Regency
In term of spatial inequality between re-gency, from the Table 3, it can be seen that the Theil index shows a declining trend for the inequality between regency. This indicates that during the period 1998-2007 there has been increased dispersion of manufacturing industry in Java. In other words, until 2008, there was evidence that spatial concentration tends to decrease. The difference of a significant share of the workforce over the period 1998-2007 was the cause evidence of spatial concentra-tion. It can be seen from the sixth column of Table 3 which displays that about 73-83
per-centages spatial disparity in Java described by the degree of difference between the labor share of the regency.
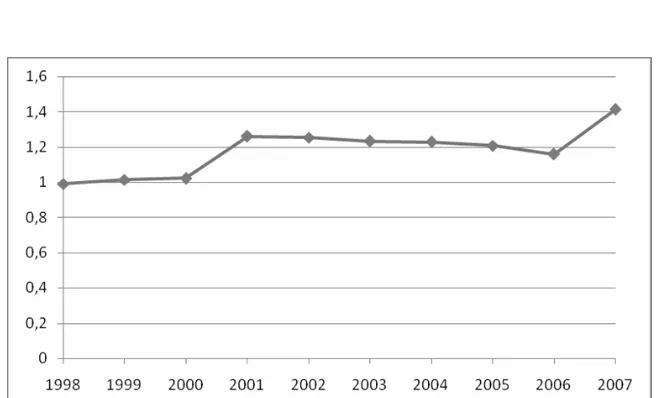
From the Figure 3, it is found that the Theil index between regency shows an in-creasing trend during the 1998-2001. This reflects that there is an increasing trend of spatial concentration in some regency or in other words there was a decrease in spatial dispersion of manufacturing industry in 1998-2001. However, this index began to decline gradually beginning 2002, which indicate a declining trend of spatial concentration in some regency.
Figure 3. The Trend of Theil Entropy between Regency, 1998-2007
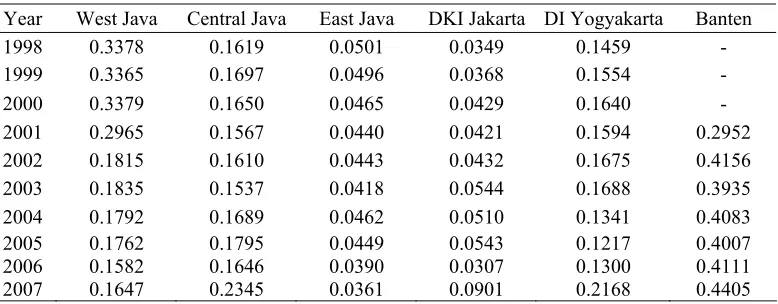
Table 4. Theil Index for Spatial Inequality within Regency, 1998-2007
Year West Java Central Java East Java DKI Jakarta DI Yogyakarta Banten
1998 0.3378 0.1619 0.0501 0.0349 0.1459 -
1999 0.3365 0.1697 0.0496 0.0368 0.1554 -
2000 0.3379 0.1650 0.0465 0.0429 0.1640 -
2001 0.2965 0.1567 0.0440 0.0421 0.1594 0.2952
2002 0.1815 0.1610 0.0443 0.0432 0.1675 0.4156
2003 0.1835 0.1537 0.0418 0.0544 0.1688 0.3935
2004 0.1792 0.1689 0.0462 0.0510 0.1341 0.4083
2005 0.1762 0.1795 0.0449 0.0543 0.1217 0.4007
2006 0.1582 0.1646 0.0390 0.0307 0.1300 0.4111
Inequality within Regency
Turning to inequality within regency, Ta-ble 4 displays the Theil index of spatial ine-quality within regency in Java during 1998 to 2007. From the table, it can be seen that the trend of spatial inequality within regency are consistent with the spatial inequality of Java (see Table 2) which shows an upward trend. An increase in entropy index in one regency indicates that the share of industrial employ-ment tends to increase during the period of study. Specifically, Theil index of West Java and Central Java shows relatively high value compared to other provinces. In 1998, the Theil index for West Java and Central Java were 0.3378 and 0.1619, respectively. This index rose to 0.1647 for West Java and to be 0.2345 for Central Java for the period 2007.
(b) Statistical Tests
Statistical test for Theil index is employed in order to see whether spatial inequality be-tween and within regency for manufacturing industry in 42 regency in Java as shown in the manufacturing trend in previous section was difference between one to other observation during 1998-2007. To reach the objective, this study employs a single factor analysis of vari-ance (ANOVA) with the hypotheses of:
Null hypothesis (H0): µ1 = µ2 = µ3 = …= µt. There is no difference concentration of in-dustrial location during observation.
Alternative hypothesis (H1): µ1≠ µ2 ≠ µ3 ≠ …≠ µt.
There is difference concentration of in-dustrial location during observation.
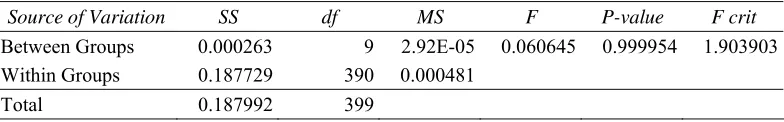
Table 5 presents the ANOVA results for Theil index’s hypothesis testing for inequality between regency and within regency. From the Table 5, it is found that the Theil’s hypothesis testing for between regency give the result of F calculated (0.060645) that is smaller than the F critical (1.903903). It means that the alterna-tive hypothesis (H1) is rejected and therefore, the null hypothesis (H0) is accepted. Thus there is sufficient statistical evidence to say that there is no difference in the concentration level of manufacturing during the observation. In terms of the Theil index within regency, the ANOVA also give a similar pattern as shown by between regency, which F calculated (0.030421) smaller than the F critical (1.903841), means that the null hypothesis (H0) is accepted and therefore rejected alter-native hypothesis (H1).
Table 5. The Theil Index’s Hypothesis Testing
ANOVA between Regency
Source of Variation SS df MS F P-value F crit
Between Groups 0.000263 9 2.92E-05 0.060645 0.999954 1.903903 Within Groups 0.187729 390 0.000481
Total 0.187992 399
ANOVA Within Regency
Source of Variation SS df MS F P-value F crit
Between Groups 0.0018568 9 0.0002063 0.030421 0.999997 1.903841 Within Groups 2.6517338 391 0.0067819
Total 2.6535907 400
2. Location Quotient Index
This study used Location Quotient index (LQ) to investigate the level of relative ad-vantage of a sector in one region compared with other region based on the employment data on manufacturing industry in 42 regencies in Java. The LQ results could be classified into: (1) LQ>1, means that the manufacturing in a region is a manufacturing base, become a leading and has the potential to be developed; (2) LQ<1, means that the manufacturing in an area is not an industrial base as well as group of industry; and, (3) LQ=1, means that the manufacturing in a particular area is only able to fulfill its own territory.
One important point to be kept in mind is about the LQ result is that the change in the value of LQ is affected by regional population shifts. In most cases, an increase in the index is accompanied by an increase in manufactur-ing employment since our study use this manufacturing data. In the same manner, a decrease in the index does not always mean the loss of employment.
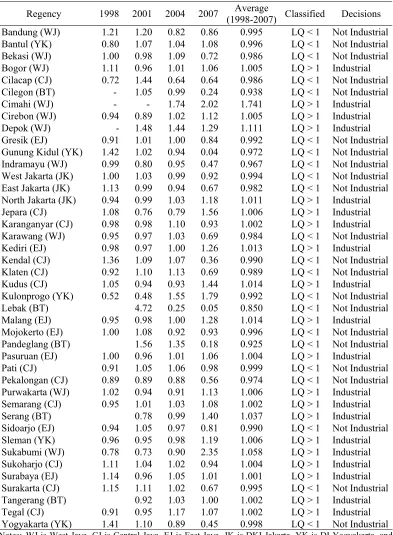
Table 6 presents the LQ results based on employment data for 42 regencies in Java during 1998 to 2007. Regencies with LQ more
than one are classified as industrial area, while LQ less than one is called not an industrial area. From the Table 6, it can be seen that there were 15 out of 42 regencies in Java which have LQ > 1 in 1998. In 2001 the num-ber of regency increasing to 19 regencies then was continuing increase to 25 regencies in 2004. But in 2007, the total of regency with LQ>1 was slightly decreased to 20 regencies. For the summary, the increasing of the LQ value during the period of study showed that there was more areas became new industrial areas. In other words, the manufacturing in Java has spread over the last 10 years.
Table 6. Location Quotient Index for Regencies in Java, 1998-2007
Regency 1998 2001 2004 2007 Average
(1998-2007) Classified Decisions Bandung (WJ) 1.21 1.20 0.82 0.86 0.995 LQ < 1 Not Industrial Bantul (YK) 0.80 1.07 1.04 1.08 0.996 LQ < 1 Not Industrial Bekasi (WJ) 1.00 0.98 1.09 0.72 0.986 LQ < 1 Not Industrial Bogor (WJ) 1.11 0.96 1.01 1.06 1.005 LQ > 1 Industrial Cilacap (CJ) 0.72 1.44 0.64 0.64 0.986 LQ < 1 Not Industrial Cilegon (BT) - 1.05 0.99 0.24 0.938 LQ < 1 Not Industrial Cimahi (WJ) - - 1.74 2.02 1.741 LQ > 1 Industrial Cirebon (WJ) 0.94 0.89 1.02 1.12 1.005 LQ > 1 Industrial Depok (WJ) - 1.48 1.44 1.29 1.111 LQ > 1 Industrial Gresik (EJ) 0.91 1.01 1.00 0.84 0.992 LQ < 1 Not Industrial Gunung Kidul (YK) 1.42 1.02 0.94 0.04 0.972 LQ < 1 Not Industrial Indramayu (WJ) 0.99 0.80 0.95 0.47 0.967 LQ < 1 Not Industrial West Jakarta (JK) 1.00 1.03 0.99 0.92 0.994 LQ < 1 Not Industrial East Jakarta (JK) 1.13 0.99 0.94 0.67 0.982 LQ < 1 Not Industrial North Jakarta (JK) 0.94 0.99 1.03 1.18 1.011 LQ > 1 Industrial Jepara (CJ) 1.08 0.76 0.79 1.56 1.006 LQ > 1 Industrial Karanganyar (CJ) 0.98 0.98 1.10 0.93 1.002 LQ > 1 Industrial Karawang (WJ) 0.95 0.97 1.03 0.69 0.984 LQ < 1 Not Industrial Kediri (EJ) 0.98 0.97 1.00 1.26 1.013 LQ > 1 Industrial Kendal (CJ) 1.36 1.09 1.07 0.36 0.990 LQ < 1 Not Industrial Klaten (CJ) 0.92 1.10 1.13 0.69 0.989 LQ < 1 Not Industrial Kudus (CJ) 1.05 0.94 0.93 1.44 1.014 LQ > 1 Industrial Kulonprogo (YK) 0.52 0.48 1.55 1.79 0.992 LQ < 1 Not Industrial Lebak (BT) 4.72 0.25 0.05 0.850 LQ < 1 Not Industrial Malang (EJ) 0.95 0.98 1.00 1.28 1.014 LQ > 1 Industrial Mojokerto (EJ) 1.00 1.08 0.92 0.93 0.996 LQ < 1 Not Industrial Pandeglang (BT) 1.56 1.35 0.18 0.925 LQ < 1 Not Industrial Pasuruan (EJ) 1.00 0.96 1.01 1.06 1.004 LQ > 1 Industrial Pati (CJ) 0.91 1.05 1.06 0.98 0.999 LQ < 1 Not Industrial Pekalongan (CJ) 0.89 0.89 0.88 0.56 0.974 LQ < 1 Not Industrial Purwakarta (WJ) 1.02 0.94 0.91 1.13 1.006 LQ > 1 Industrial Semarang (CJ) 0.95 1.01 1.03 1.08 1.002 LQ > 1 Industrial Serang (BT) 0.78 0.99 1.40 1.037 LQ > 1 Industrial Sidoarjo (EJ) 0.94 1.05 0.97 0.81 0.990 LQ < 1 Not Industrial Sleman (YK) 0.96 0.95 0.98 1.19 1.006 LQ > 1 Industrial Sukabumi (WJ) 0.78 0.73 0.90 2.35 1.058 LQ > 1 Industrial Sukoharjo (CJ) 1.11 1.04 1.02 0.94 1.004 LQ > 1 Industrial Surabaya (EJ) 1.14 0.96 1.05 1.01 1.001 LQ > 1 Industrial Surakarta (CJ) 1.15 1.11 1.02 0.67 0.995 LQ < 1 Not Industrial Tangerang (BT) 0.92 1.03 1.00 1.002 LQ > 1 Industrial Tegal (CJ) 0.91 0.95 1.17 1.07 1.002 LQ > 1 Industrial Yogyakarta (YK) 1.41 1.10 0.89 0.45 0.998 LQ < 1 Not Industrial
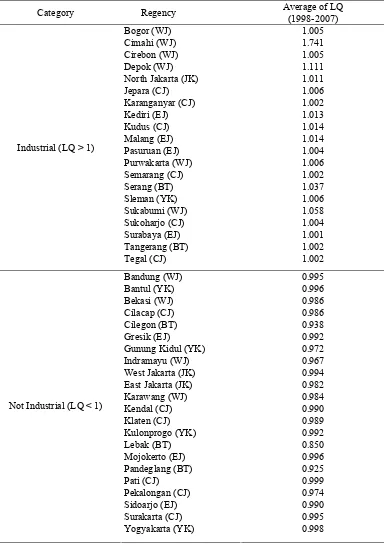
Table 7. Classification of Regency in Java based on LQ Index
Category Regency Average of LQ
(1998-2007)
Bogor (WJ) 1.005
Cimahi (WJ) 1.741
Cirebon (WJ) 1.005
Depok (WJ) 1.111
North Jakarta (JK) 1.011
Jepara (CJ) 1.006
Karanganyar (CJ) 1.002
Kediri (EJ) 1.013
Kudus (CJ) 1.014
Malang (EJ) 1.014
Pasuruan (EJ) 1.004
Purwakarta (WJ) 1.006
Semarang (CJ) 1.002
Serang (BT) 1.037
Sleman (YK) 1.006
Sukabumi (WJ) 1.058
Sukoharjo (CJ) 1.004
Surabaya (EJ) 1.001
Tangerang (BT) 1.002
Industrial (LQ > 1)
Tegal (CJ) 1.002
Bandung (WJ) 0.995
Bantul (YK) 0.996
Bekasi (WJ) 0.986
Cilacap (CJ) 0.986
Cilegon (BT) 0.938
Gresik (EJ) 0.992
Gunung Kidul (YK) 0.972
Indramayu (WJ) 0.967
West Jakarta (JK) 0.994
East Jakarta (JK) 0.982
Karawang (WJ) 0.984
Kendal (CJ) 0.990
Klaten (CJ) 0.989
Kulonprogo (YK) 0.992
Lebak (BT) 0.850
Mojokerto (EJ) 0.996
Pandeglang (BT) 0.925
Pati (CJ) 0.999
Pekalongan (CJ) 0.974
Sidoarjo (EJ) 0.990
Surakarta (CJ) 0.995
Not Industrial (LQ < 1)
CONCLUSIONS
The objective of the study is to investigate the impact of manufacturing concentration on regional inequality in Java region, Indonesia. Data on manufacturing employment for the whole regency in Java during 1998 to 2007 was used to explain the impact of manufac-turing concentration on regional inequality. Before conducting the Theil index and Loca-tion Quotient analysis, in the beginning, our study was conduct the selection of sample based on the share of manufacturing on the regional gross domestic product (RGDP) which adopting the procedure proposed by Bostic, Gans and Stern (1997). The 42 regency which have the 0.5 percent threshold level of manufacturing output in RGDP included in the analysis. Thus, the sample of the study con-sists of 10 out of 19 regencies in West Java, 12 out of 31 regencies in Central Java, and 7 out of 31 regencies for East Java. All of regencies in the DI Yogayakarta and Banten are in-cluded in the samples of study, while 3 out of 5 regencies in DKI Jakarta are also included in the sample. Consequently, the total samples used in the study are 42 regencies out of 96 regencies (43.75 percent).
In term of inequality, the Theil index found that there are changes in regional dis-parities among regency in Java with an in-creasing trend. An inin-creasing Theil index mainly shows form inequality within regency. While the inequality between regency shows a decreasing gradually over the period of obser-vation. It indicates that manufacturing in 42 regencies in Java are spread only in several regencies. Turning to Location quotient (LQ), our study revealed that the number of regency which has LQ greater than one shows in-creasing gradually during 1998 to 2007. Spe-cifically, in 1998, there were 15 out of 42 regencies in Java have the LQ index greater than one. In 2001, there 19 regencies have the LQ index greater than one. In 2001, there were 25 regencies have the LQ greater than one. However, in 2007 it was found that 20
regen-cies have LQ greater than one. Based on the results, we can conclude that increasing the number of regency with have LQ greater than one show that there was more areas become new industrial areas in the next future years. In other words, the manufacturing in Java has spread over the last 10 years.
For the conclusion, concentration of manufacturing in Java region was given effect on regional inequality among regency during the study which was revealed by inequality within regencies that shows increasing trend which implying that the manufacturing indus-try in Java concentrated only in several regen-cies. Further, the location quotient index shows an increasing trend that reveals the economy of some regencies are more depend-ent in manufacturing and at the same time it shows that several new manufacturing areas has emerged in Java. The policy related to development and arrangement of manufactur-ing is very important in order to encourage the manufacturing to concentrate in other regency. If the manufacturing dispersed gradually for the next year, then the economic growth for the whole regency in Java which based on the manufacturing sector created.
REFERENCES
Arifin, Z., 2003. “Dinamika Spasial Industry Manufaktur di Jawa Barat, Tahun 1990-1999 [Spatial Dynamic of Manufacturing Industry in West Java: 1990-1999]”. Jur-nal Ekonomi Pembangunan Kajian Eko-nomi Negara Berkembang, 111 – 121. Ellison, G., and E. L. Glaeser, 1997.
“Geo-graphic Concentration in U.S. Manufac-turing Industries: a Dartboard Approach”. The Journal of Political Economy, 105(5), 889-927.
Bostic, R. W., J. S.Gans, and C. Stern, 1997. “Urban Productivity and Factor Growth in the Late Nineteenth Century”. Journal of Urban Economics, 41, 38-55.
Greater Jakarta dan Bandung Periode 1980-2000: Menuju Satu Daerah Aglome-rasi? [Geographical Concentration of Manufacturing Industry in Greater Jakarta and Bandung 1980-2000: Toward an Ag-glomeration Region?]”. Jurnal sosiosains, 18(2).
Kuncoro, M., 2002. Analisis Spasial dan Re-gional: Studi Aglomerasi dan Kluster Industri Indonesia [Spatial and Regional Analysis: Agglomeration and Cluster Study of Indonesian’s Industri]. Yogya-karta: UPP AMP YKPN.
Landiyanto, E. A., 2003. “Konsentrasi Spasial Industri Manufaktur: Tinjauan Empiris di Kota Surabaya [Spatial Concentration of Manufacturing Industry: Empirical Study in Surabaya]” available at http://ideas.
repec.org/p/wpa/wuwpur/0501006.html accessed on April 24, 2009.
Miller, R. E., 1998. “Regional and Interre-gional Input-Output Analysis”. in: Isard, W. (Ed.), Methods of Interregional and Regional Analysis. UK: Ashgate, 41-133. McCann, P., 2001. Urban and Regional
Eco-nomics. New York: Oxford University Press.