209
INVESTMENT OPPORTUNITY SET ROLE AS MEDIATING THE EFFECT OF DIVERSIFICATION TO COMPANIES VALUE IN INDONESIA
(EMPIRICAL STUDY OF GO PUBLIC SECONDARY SECTOR COMPANIES)
Yuliani
Economics Faculty, Sriwijaya University, Palembang, South Sumatra
Djumilah Zain, Made Sudarma, Solimun
Economics and Business Faculty, Brawijaya University, Malang, East Java
Abstract
Purpose - This study aims, first, to measure and to interpret the effect of diversification on company value, and second, to measure the role of Investment Opportunity Set (IOS) as the mediating effect of diversification to company value. Design/methodology/approach - This study uses a quantitative approach with paradigm positivistme. This empirical research object is the go public secondary sector companies at Indonesia Stock Exchange (ISE). This study use sample 18 companies. Observation period is 2006-2010. The method of data analysis is Structural Equation Model (SmartPLS software) Ver 2.0 M3.
Findings - First, diversification has significant and positive effect on company value. Second, IOS acts as a partial mediating effect of diversification to company value. Research limitations - The study is not concerned with the qualitative, eg management and customer service. The reason is lack of information qualitative data. This assessment is only a kind of financial portrait moment and, of course, contains many limitations. Moreover, the researchers did not check again whether the financial report is true, that in accordance with the conditions of the company, without engineering.
Practical implications - The research could be an important input to regulators such as the company's managers, board of directors, the board of commissioners in deciding investment opportunities and to explain the information disclosure or publication on Stock Exchange in the online media. For potential investors, this study describes the company prospects before buying shares at secondary sector. Originality/value - This research fills opposition research results of previous studies, by including IOS as a mediating variable, the effect of diversification on company value. These variables can explain the emergence of the gap with the object of observation on go public secondary sector companies in Indonesia.
Keywords: Diversification, Investment Opportunity Set, Value Company. Article Classification: Research Paper
INTRODUCTION
Revolution and globalization
lead companies to choose
diversification, when faced with a very
tight competition and the market grow
rapidly. Montgomery (1994) suggest
that there are three perspectives to
diversify motives, namely Market
Power View-MPW, Resources-Based
View RBV, and Agency View. David
(2003: 167-170) states that the
development of new business is
different from the existing business
and involving a number of investment
diversification. When a company
210 one to several industries, it mean the
diversification strategy done at the
enterprise level (Hitt et al., 2011:
158-159).
Ansoff (1965) states that
diversification is the evolution of
business growth. Rumelt (1974),
Hoskisson & Hitt (1990) states that
diversification is a corporate level
strategy. Unlike Tecee et al. (1997),
Matsusaka (2001) and Barney (2002)
states that diversification can be used
as a source of sustainable competitive
advantage. Clarkson et al. (1983),
Nayyar (1993) suggested
diversification is the source of value
creation. Rumelt (1974) states there
is a correlation between the
diversification of corporate
diversification and company
performance, including Strategic
Management and Financial
Management.
Studies of diversification and its
impact on the company value is still
debating, whether diversification can
bring benefit or even a negative
impact on company value. The
studies suggesting that diversification
increases the company value are: 1)
On average, higher profitability relate
to diversification companies than
non-diversified company (Amit & Livnat,
1988; Rumelt, 1982; Aisjah, 2009). 2)
Diversification does not reduce the
company's enterprise value (Gomes &
Livdan, 2004; Sujoko, 2006). 3)
Diversification associated with
technology diversity (Miller, 2004,
2006). 4) International Diversification
did not lower the company value
(Santos et al., 2008). 5) Diversification
has positive influence on the
performance of companies in
Indonesia (Chakrabarti et al., 2007).
However, research on the effect
of diversification on company value
find the opposite result. First, the
value of diversified companies are
smaller than companies that operate
in a single segment. Value loss
ranged from 13% -15%. Difference in
value will be reduced if the company
made related diversification (Berger &
Ofek, 1995). Second, there is a
negative relationship between Tobin's
q ratio on diversification (Lang and
Stulz, 1994; Campa & Kedia, 2002;
Fukui and Ushijima, 2007). Third, no
significant effect on diversification
Excess Value and profitability (Harto,
2005; Kusmawati, 2005, Satoto, 2009,
Yuliani, 2011). Four, diversified
companies have asymmetric
information problems than the
company's focus (Clarke et al., 2004).
Various previous studies on the
effects of diversification on companies
value is still not consistent. This
211 operationalize Investment Opportunity
Set (IOS) as a mediation between the
effect of diversification on companies
value. Reason to include variables
when a company is to diversify,
namely there are a number of
investments that will be involved.
Diversification opportunities for the
company will create investment
opportunities that should be
implemented. Investment
opportunities in financial management
in the context of investment decisions
entry. Research Fama and French
(1997) has shown that the only
determinant of the company value is
an investment decision.
Myers (1977) firstly introduced
the Investment Opportunity Set (IOS)
in relation to achieving the company's
goals. Gaver and Gaver (1995) stated
that IOS provides guidance a broader,
enterprise value as the primary goal
depends on corporate spending in the
future, which is now the investment
options that are expected to yield a
greater return. IOS is a combination of
assets in place and future investment
choices with a Net Present Value
(NPV) positive (Myers, 1977; Kallapur
& Trombley, 1999). Adam and Goyal
(2008) emphasizes that the IOS plays
an important role in corporate finance
related to the achievement of
corporate goals. Smith & Watts (1992)
explains that the IOS is a component
of the company's value results from
the choices to make future
investments.
Empirical studies The IOS
influence on companies value
outcome remains consistent. On the
one hand, IOS influence on
companies value [(Fama, 1977;
MacKay, 2005; Hasnawati, 2005a,
2005b; Hossain et al., 2005; Yoon and
Starks, 1995; Nopratiwi, 2004;
Hidayat, 2010; Akhtaruddin &
Hossain, , 2008; Efni, 2011)]. But on
the other hand, Kallapur & Trombley
(1999); Suharli (1997) and Bernadi
(2008) found that IOS has no effect on
companies value. IOS effect on
companies value, which means that
the investment opportunities that
exist, if the company is able to choose
from different investment companies
will acquire surplus for a number of
investments made. Surplus proceeds
will be contributed to the cash inflow,
and then accumulated in improving
profitability. Conversely, if the IOS
does not affect the company then the
company has a deficit in the number
of investments made, which will
reduce the equity and will ultimately
lower the company value.
The phenomenon of companies
go public in Indonesia showed show
212 divestment and organization
restructuring. Examples are
Bimantara Group, Texmaco Group,
PT. Indomobil Sukses International
Tbk, PT. Karwel Indonesia, Bunas
Finance Indonesia. Sutrisno in Sujoko
(2006) found evidence that merger
and acquisition activity at corporate
strategy level actions more emphasis
on maintaining corporate sustainable
advantage. Apparently, the results
lowered the company's stock price.
For example, the management of PT.
Eastman Kodak diversify its business
through the acquisition of PT. Sterling
Drug. After the acquisition, the stock
price PT. Eastman Kodak fell 15%,
therefore, aggrieved shareholders.
This study develops a diversified
variable relationships, IOS and the
company value, as well as fill the
research gap of Lang and Stulz
(1994) and Fukui and Ushijima
(2007). Research of Lang and Stulz
(1994) in the United States and Fukui
and Ushijima (2007) in Japan showed
inconsistent results. In fact, the two
researchers using the same
performance indicators Tobin's Q.
This study fills the gap by offering a
single solution, which operate as a
mediating influence between IOS
diversification on companies value.
IOS mediating variable will make an
increasingly broad diversification, it
will lead to a variety of investment
opportunities. Existing investment
opportunities encourage companies to
choose investments with a high rate of
return. Therefore, the company
earned surplus, which in turn
increases the company value.
This study will answer the
following problems: (1) Measuring and
interpreting the effect of diversification
on company value, (2) Measuring and
examining the role of IOS as
mediation the effect of diversification
on company value. Benefits
theoretically study: (1) Testing the
theory of diversification with
perspective of Montgomery (1994), (2)
Expanding the study of signaling
theory (Ross, 1977), namely company
with variety of investment
opportunities mean better corporate
growth. (3) The study extends the
research topics of the theory of
Financial Management and
Investment Management. While the
practical benefits of this research can
be input for management, investors
and other practitioners about the
impact of the interaction of each
variable to increase the company
value in order to obtain images and
information about the financial
213
RESEARCH HYPOTHESIS
The study's findings are
inconsistent regarding the relationship
of diversification on company value.
Hitt & Hokisson (1990) suggests,
diversification relation with the
performance of non-linear form, ie the
higher the degree of diversification the
lower performance. Palich et al.
(2000) suggests, diversification and
performance relationship can be linear
and non-linear. The linear
relationship between diversification
and performance has been described
by MBV approach. Diversification can
enhance market power, facilitate the
implementation of pricing practices,
and cross-subsidies between
businesses. Therefore, it exploits the
synergy of economic diversification. In
the non-linear forms, business
diversification can lead to control
difficulties. Therefore, high
diversification will lead to greater
marginal cost, so the high
diversification causes a decrease in
the company value.
Montgomery (1994) explains
that the reason diversification
company is looking to diversify the
market. That is, the market share
control will greater. Another reason is
to optimize existing resources.
Montgomery & Wernerfelt (1988)
stated that the diversified company, it
will first try to use excess assets to the
nearest market to enter. If there is still
excess capacity, the company will
enter the market more deeply. But if
the assets used in the market too
much with the current market,
companies will lose their competitive
edge and low profit. This indicates
that the relationship between
diversification and marginal profit is
diminishing function. Several studies
have also concluded that
diversification is more profitable for
companies in emerging economies
(Khanna and Palepu, 1999). The
reason is that in countries with
developing economies, capital market
intermediaries often run inefficiently or
even absent. Based on explanation
above, the hypotheses formulation of
diversification effect on company
value is:
Hypothesis 1: The more extensive secondary sector company to diversify, the higher company value
Investment Opportunity Set as
an investment option depends on the
value of future discretionary
expenditure growth chosen by
manager (Kole, 1991). Each choice is
influenced by the growth of
competitive advantage in business.
Diversification can be done because
214 opportunities set. Investment
opportunities means the company will
have a good value, reflected in the
stock price as well as for other
indicators. IOS plays an important role
in corporate finance related to the
achievement of corporate goals.
Singh et al (2003) and MacKay
(2003) conduct empirical research on
the effects of diversification to IOS.
The results showed that company was
not consistent because the
opportunity to diversify their
investments is differ. Investment
Opportunity Set selected based on
resource considerations, strategic
assets and market share. When
companies implement diversification,
they will contribute to the increased
company value. IOS acts strengthen
the company to diversify. Therefore
the presented hypothesis as follows:
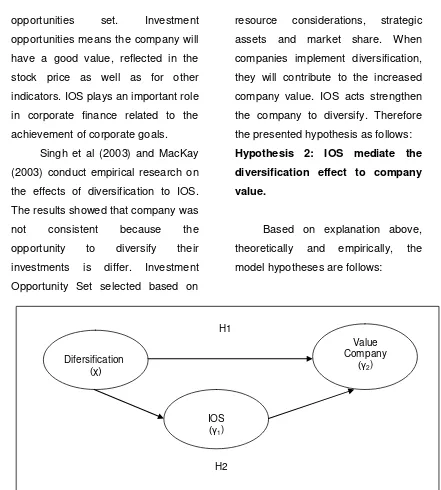
Hypothesis 2: IOS mediate the diversification effect to company value.
Based on explanation above,
theoretically and empirically, the
model hypotheses are follows:
Figure 1. Research Hypothesis Model
RESEARCH METHODS
A. Approach and Type Research The approach is a quantitative
study with paradigm positivistme by
empirical research on the go public
secondary sector companies in IDX.
While this type of research is
explanatory (explanatory research),
the aim is to find an explanation of the
relationship (causality) between
variables through hypothesis testing.
B. Population and Research Sample
The study population was all
companies included in the secondary Value
Company (γ2)
IOS (γ1) Difersification
(χ)
H1
215 sector in IDX. This includes basic
industry and chemicals (6
sub-sectors), miscellananeous industry (3
sub-sector), consumer goods industry
(5 sub-sectors) during the observation
period 2006-2010. Object of
observation in the study is the annual
report 2010 amounted to 136 issuers.
Population criteria include: 1) The
Company publishes audited financial
statements 2006-2010. 2) The
Company did not incur losses. 3) The
Company has positive retained
earnings. 4) The Company has a
positive equity balance, and 5) the
Company has more than one type of
business.
Based on these criteria, the
amount eligible is 18 companies. This
study used a sample saturated
(census). The unit of analysis is the
pooling of data with lag time during
the observation period (t) by the
number of observations 72 cases.
Companies that entered the samples
shown in Table 1:
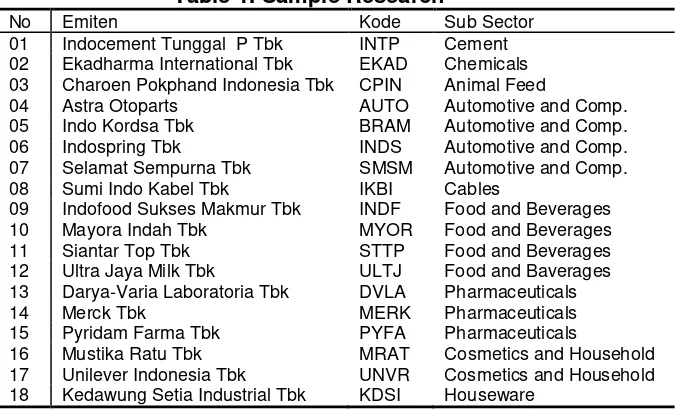
Table 1. Sample Research
No Emiten Kode Sub Sector
01 Indocement Tunggal P Tbk INTP Cement 02 Ekadharma International Tbk EKAD Chemicals 03 Charoen Pokphand Indonesia Tbk CPIN Animal Feed
04 Astra Otoparts AUTO Automotive and Comp. 05 Indo Kordsa Tbk BRAM Automotive and Comp. 06 Indospring Tbk INDS Automotive and Comp. 07 Selamat Sempurna Tbk SMSM Automotive and Comp. 08 Sumi Indo Kabel Tbk IKBI Cables
09 Indofood Sukses Makmur Tbk INDF Food and Beverages 10 Mayora Indah Tbk MYOR Food and Beverages 11 Siantar Top Tbk STTP Food and Beverages 12
13
Ultra Jaya Milk Tbk
Darya-Varia Laboratoria Tbk
ULTJ DVLA
Food and Baverages Pharmaceuticals
14 Merck Tbk MERK Pharmaceuticals
15 Pyridam Farma Tbk PYFA Pharmaceuticals
16 Mustika Ratu Tbk MRAT Cosmetics and Household 17 Unilever Indonesia Tbk UNVR Cosmetics and Household 18 Kedawung Setia Industrial Tbk KDSI Houseware
Sources: Companies Go Public Performance Summary, 2010
C. Sources and Data Collection Methods
The data used are secondary
data, such as financial statements
Year 2006-2010, obtained from the
Annual Report Database Corner
Stock IDX-UB. Furthermore, financial
statements are used to obtain data
216
D. Operational Definition of Research Variables
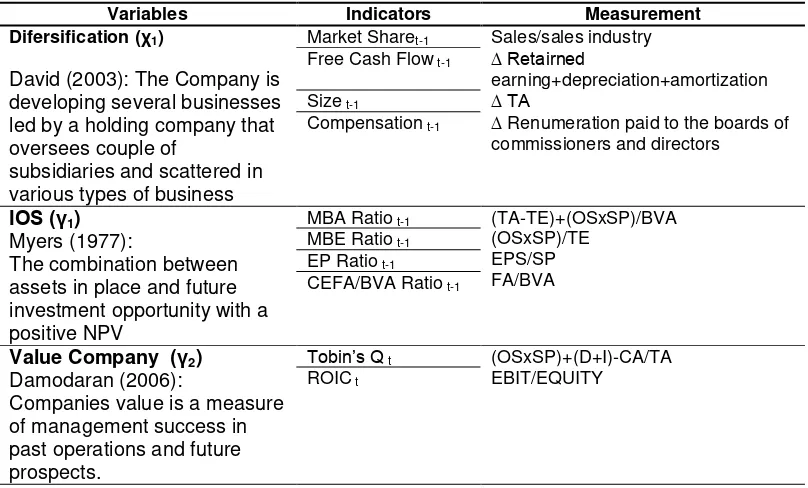
Table 2. Operational Definition of Research Variables
Variables Indicators Measurement
Difersification (χ1)
David (2003): The Company is developing several businesses led by a holding company that oversees couple of
subsidiaries and scattered in various types of business
Market Sharet-1 Sales/sales industry Free Cash Flow t-1 ∆ Retairned
earning+depreciation+amortization
Size t-1 ∆ TA
Compensation t-1 ∆ Renumeration paid to the boards of commissioners and directors
IOS (γ1)
Myers (1977):
The combination between assets in place and future investment opportunity with a positive NPV
MBA Ratio t-1 (TA-TE)+(OSxSP)/BVA (OSxSP)/TE
EPS/SP FA/BVA MBE Ratio t-1
EP Ratio t-1 CEFA/BVA Ratio t-1
Value Company (γ2)
Damodaran (2006):
Companies value is a measure of management success in past operations and future prospects.
Tobin’s Q t (OSxSP)+(D+I)-CA/TA
ROIC t EBIT/EQUITY
Description: TA = Total Assets; TE = Total Equity; OS = Outstanding Share; SP = Share Price; BVA = Book Value of Assets; EPS = Earnings Per Share; FA = Fixed Assets; D = Total Debt; I = Inventory; CA = Current Assets; EBIT = Earnings Before Interest and Tax.
E. Method of Data Analysis
Inferential statistics are used to
determine the relationship between
variables simultaneously. This study
uses Structural Equation Model (SEM)
based on the variance, the Partial
Least Square (PLS), using software
SmartPLS Ver 2.0 M3. The reasons
for using PLS is (1) The research
variables are latent or unobservable,
(2) a relatively small number of
observations namely 72 observations
and (3) empirical models indicate
causality tiered.
RESULTS AND DISCUSSION Hypothesis Testing Results (H1)
This study has two hypotheses,
the direct testing and mediating
testing variable. The test results are
presented in Table 3:
Table 3. Hypothesis Testing Results Independent
Variable
Dependent Variable
Path Coefficient t-statistic p-value Explanation
Diversification CV 0,316 2,428 0,018 Significant Diversification IOS 0,650 16,099 0,000 Significant
IOS CV 0,267 4,221 0,000 Significant
Source: Adapted from secondary data
217 Table 3 shows that each of the
independent variables have a positive
and significant effect on the
dependent variable. The direct effect
of diversification on company value is
significant and positive, the value of s
path coefficient is 0.316 and p-value
less than 0.05. The direct effect of
diversification on IOS is significant
and positive. Big path coefficient is
0.650 and p-value less than 0.05. The
direct effect of IOS on company value
is 0.267, p-value less than 0.05.
Therefore, the effect is significant and
positive.
Table 3 shows the results of a
positive and significant effect of
diversification on company value. The
first hypothesis which states the more
extensive secondary sector
companies to diversify, the higher
company's value is received (H1
Accepted).
Hypothesis Testing Results (H2) Testing mediating variables
influence also called indirect effect
testing, aims to determine the position
of mediating variable (IOS) in this
study. The process of examination the
IOS variable in determining the type of
mediation, whether partial or complete
mediation steps are as follows:
Step 1: Calculate the path
coefficients. The way is to enter the
IOS variable in the model and the
empirical test results, as shown in
Table 4:
Table 4.
Mediation Test Results Analysis with Variable IOS Original sampel
estimate
t-statistic
p-value Explanation
Diver CV (a) 0,316 2,253 0,027 Significant
Diver IOS (c) 0,650 19797 0,000 Significant
IOS CV (d) 0,267 4,417 0,000 Significant
Source: Adapted from secondary data
Step 2: Calculate the path coefficient without entering the IOS variable in
empirical models. The test results are shown in Table 5 follows:
Table 5.
Result Analysis of Variable Test Mediation Without IOS Original
sample-estimat
t-statistic p-value Explanation
Diver CV (b) 0,568 19,880 0,000 Significant
218 Table 4 and Table 5 shows the
value of (c), (d) is significant, and (b)
significant. Path coefficient (a) is
smaller than the path coefficient (b).
Therefore, the nature indirect effect of
mediated diversification on company
value through IOS is a partial
mediation. That is, diversification can
directly affect the company value and
can also through IOS. It can be stated
that hypothesis as a mediating
influence of IOS diversification on
company value received or (H2
Accepted).
DISCUSSION
Diversification Effect on Company Value
Analysis results the influence
of diversification on company value is
significant and positive. Thus,
hypothesis that the more extensive
secondary sector companies to
diversify, hence increasing the
company's value, is acceptable.
These results suggest that
diversification can explain the
variation in the increased value of
secondary sector company in
Indonesia during the Year 2006-2010.
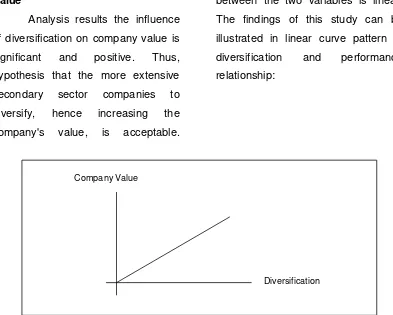
Palich et al. (2000) explains
the diversification and performance
relationship can take linear and
non-linear form. This study proves that for
the secondary sector in Indonesia
relationship between diversification
with company values are linear. The
linearity assumption is tested by
relationship between the value of
corporate diversification. The test
result significance at p-value 0.000
0.05, so it is said that the relationship
between the two variables is linear.
The findings of this study can be
illustrated in linear curve pattern of
diversification and performance
relationship:
Source: Adapted from secondary data Company Value
219
Figure 2
Linear relationships between Diversification and Company Value Findings Secondary Sector in Indonesia
Linear relation model was
developed from the market based
view and transaction cost economies
perspective. It is said that the
company can create value through the
exploitation of market power
advantages. It is a positive linear
relationship between diversification
and performance. Internal market
based view and transaction cost
perspective, by Montgomery (1994), is
proved in this study. Reason
secondary sector companies in
Indonesia to diversify created by the
views and approach of market-based
economic transaction costs.
Market-based view approach is
actually referring to the power sources
that affect industry competition that
comes from thinking Porter (1980), in
order to formulate the company's
competitive strategy related to the
environment. For Porter, Environment
is the industry in which the company
competes. The company's ability to
cope with the industrial environment is
being developed (Hitt et al., 2011)
referred as managing the company's
resources as an integrated input.
Therefore, it create a potential source
of Sustainable Competitive Advantage
(SCA), the company is able to
outperform its competitors, the
company finally can achieve superior
return.
This study supports Barney
(2002), which states that the
rationality of the company to diversify
with anticompetitive motivation is to
exploit the market share. Some
researchers such as Bourantas et al.
(1987); Amit and Livnat (1988);
Szymanski et al. (1993); Chakrabarti
et al. (2002) has demonstrated
significant and positive relationship
between diversification on company
value. Miller (2006) concluded that the
relationship diversification on
company value on the 192 companies
in the United States is as significant
and positive. While in Indonesia, the
findings are consistent with research
Aisjah (2009); Sujoko (2006), that
diversification provides significant and
positive effect for companies listed on
the Indonesian stock market.
These results contrast with the
results of Lang and Stulz (1994);
Campa and Kedia (2002) and Fukui
and Ushijima (2007). Fukui & Uhijima
research manufacturing company in
Japan. The results showed that the
relationship of diversification and
company value is significant but
negative. That is, the wider number of
220 Japan, the lower the company value.
This means that the curve of the
relationship of diversification and
value of companies in Japan are
non-linear (curviliear linkage model),
inverted-U-shaped model and the
intermediate model. Both models
happen to companies in Japan
because of diversification that have
been done have optimum limit. This
means that the company did not
generate diversification benefits in
accordance with the increase in the
degree of diversification or even lead
to an increase in some costs such as
the costs of coordination, due to the
increasing complexity of the
company's business structure. The
condition is called inverted-U model or
also occurs in organization's
diminishing returns (Palich et al.,
2000), called the intermediate linkage
model.
This study is not in line with the
findings of Berger and Ofek (1995), Li
& Wang (2003); Sulastri (2006);
Kusmawati (2005); Harto (2005,
2007). Research Berger and Ofek
(1995) using a sample of 5233
companies. The results showed that
the diversified company have
difference value loss ranged from
13% -15%, smaller than the
companies that operate in a single
segment. In addition, the company's
operating profit was also smaller
fungsi impulse respon diversified
company than the focus company or
operate with a single segment. Berger
and Ofek (1995) argued the
conditions of lower financial
performance of diversified companies
than focus company cause the
company value as a whole will be
lower, because the amount of excess
investment performance of the
company's financial results are not
well diversified into the following year.
Financial performance condition
of the secondary sector in Indonesia
during the year 2006-2010 showed
sales growth 16.94%, with average
sales of Rp 88 trillion per year. This
suggests the secondary sector
diversified companies have better
sales performance. Increased sales
growth was followed by an increase in
operating income and net income, ie
35% to 39% in operating profit and net
income for development. Financial
condition is a market share measure
of secondary sector companies in
Indonesia with a sizable percentage.
Mediating Role of IOS as Diversification Effect on Company Value
The results of path analysis, to
measure the IOS as a mediating of
variable diversification effect on
221 and positive coefficient (Table 4). This
means that the diversification affect
on company value, either directly or
indirectly, through IOS. Based on the
description of the steps to determine
the nature of the variables IOS
(Tables 4 and 5), it was found that the
variable IOS affect value company
(partial mediation). This is because
the value of (c), (d) is significant, and
(b) significant. Path coefficient (a) is
smaller than the path coefficient (b).
Positive direction of indirect effect
demonstrates the ability MBAR and
MBER
(Table 5.7) increase the
company value, initially only 0.316 in
the absence of IOS, rising to 0.568
(Table 5) after including IOS.
This study was able to prove
that the IOS is a partial intervening
variables to enhance the role MBER
and MBAR and in influencing the
company value. The consequence of
this finding is that companies need to
pay attention to the book value of
assets and the book value of equity.
The book value of assets reflects the
growth prospects of the company,
used to see how much its assets for
the company's operations. The higher
the book value, the better the
company growth prospects, because
the company has a productive asset.
The equity book value reflects the
capitalization of shares on the stock
market. The higher the equity book
value, the better the prospects of the
company in the eyes of investors and
prospective investors. This condition
will make funding decisions.
Therefore, these two elements have a
positive effect for increasing corporate
value.
The study's findings are
consistent and support Fama (1978)
research. Direct and indirect influence
of diversification on company value
through IOS is obtained from the
activities of the investment itself,
through the selection of projects or
other measures such as the creation
of new products, the replacement of
more efficient engines, the
development of research &
development, and mergers with other
companies (Myers , 1976). Enterprise
value represented by Tobin's Q is also
influenced by investment opportunities
and discretionary expenditure in the
future (Myers, 1977; Myeong &
Hyeon, 1998).
The findings in this study
support the signaling theory. IOS
shown by MBAR AND MBER
essential enhance shareholder value.
These types of investments will
provide a signal about the company's
222 prospects for assets and market
capitalization value stocks, which is
reflected in the expected future equity
growth. This fact is based on the
assumption that the maximum
company value will be acquired
through the selection of investments
with a positive net present value. That
is, the investment expenditures have
been considered and analyzed with
existing methods, the selected
investments with positive NPV (Chan
et al., 1990). Fama and French (1998)
stated that the investment provides a
positive signal about the company's
growth and capitalization growth
stocks in the future, resulting an
increase of company value as a
whole.
CONCLUSION AND
RECOMMENDATIONS
This study resulted in two
conclusions. First, the secondary
sector of Indonesia diversified
company that formed by market share
were able to increase the company
value, as reflected in the value of
Tobin's Q. Second, IOS acts as a
partial mediation between
diversification and companies value.
Some suggestions that may
suggested are: first, still need to be
developed and empirically examined
the influence of diversification on the
control systems at every level
corporate and business unit level.
This is because when companies
diversify, the consequences faced
was the change of organizational
structure or the structure of the larger
and comprehensive businesses.
Therefore, it is necessary that the
study looked at the business structure
changes because it also have an
impact on policy and strategy. This
condition is seen in the phenomenon
of several publicly traded companies
that make quite aggressive business
development for a relatively short
period of time. Second, growth
prospects and outlook for asset
capitalization of growth stocks reflect
IOS variables. Therefore, it is
important for companies to maintain
growth with positive development from
year to year. Companies that have
positive growth development give
positive signal to investors that
company performance has good
prospects.
REFERENCES
Adam, Tim & Goyal, Vidhan K. 2008.
The Investment Opportunity Set
and Its Proxy Variables. The
Journal of Financial Research. 1
(XXX1): 41-63.
Akhtaruddin, M & Hossain, M. 2008.
223 Ownership Control and
Voluntary Disclosures in
Malaysia. JOAAG. 3(2): 25-39.
Aisjah, Siti. 2009. Strategi
Diversifikasi Korporat, Struktur
Modal dan Nilai Perusahaan
(Studi Pada Perusahaan yang
Tercatat Di Bursa Efek
Indonesia). Disertasi. Program
Pascasarjana Fakultas Ekonomi
Universitas Brawijaya.
Amit, Raphael & Livnat, Joshua. 1988.
Diversification Strategies
Business Cycles and Economic
Performance. Strategic
Management Journal. 99:
99-110.
Ansoff, Igor. H. 1965. Corporate
Strategy. New York, McGraw
Hill.
Barney, Jay. 2002. Gaining and
Sustaining Competitive
Advantage, Second Edition,
Prentice Hall.
Berger, Philip G & Ofek, Eli. 1995.
Diversification’s Effect on Firm
Value. Journal of Financial
Economics. 37: 39-65.
Bernadi, K. Jemmi. 2007. Analisis
Pengaruh Cashflow dan
Kebijakan Pecking Order
Terhadap Leverage dan
Investasi serta Dampaknya
Terhadap Nilai Perusahaan
(Studi Pada
Perusahaan-Perusahaan Sektor Manufaktur).
Disertasi. Program
Pascasarjana Universitas
Brawijaya.
Campa, Manuel & Kedia. 2002.
Explaining the Diversification
Discount. The Journal of
Finance. LVII (4): 1731-1762.
Chakrabarti, Abhirup; Singh, Kulwant
& Mahmood, Ishtiaq. 2007.
Diversification and Performance:
Evidence from East Asian
Firms. Strategic Management
Journal. 28: 101-120.
Clarkson, Kenneth and Miller, Roger
Le Roy. 1983. Industrial
Organization, Mc. Graw Hill.
Clarke, Jonathan, E.C. Fee, Edward.
Thomas, Shawn. 2004.
Corporate Diversification and
Asymmetric Information:
Evidence from Stock Market
Trading Characteristics. Journal
of Corporate Finance.
10:105-129.
David, Fred R. 2003. Strategic
Management: Concepts and
Cases. 8th Edition, International
Edition, Prentice Hall Pearson
Education, Inc. Upper Saddle
River: New Jersey.
Efni, Yulia, 2011, Pengaruh
Keputusan Pendanaan,
Keputusan Investasi, Kebijakan
224 Perusahaan yang Dimediasi
oleh Risiko (Studi Pada Sektor
Properti Dan Real Estate Di
Bursa Efek Indonesia),
Ringkasan Disertasi. Universitas
Brawijaya Malang.
Fama, Eugene F. 1978. The Effect of
a Firm’s Investment and
Financing Decision on the
Welfare of its Security Holders.
American Economic Review. 68:
272-280.
__________. 1997. Industry Costs of
Equity. Journal of Financial
Economics. 43: 153-193.
Fama, Euegene F & French, Kenneth
R. 1998. Taxes, Financing
Decisions, and Firm Value.
The Journal of Finance. Vol.
53 (3): 819-843.
Fukui, Yoshitaka & Ushijima, Tatsuo.
2007. Corporate Diversification,
Performance and Restructuring
in The Largest Japanese
Manufacturers. Journal of The
Japanese and International
Economics. 21: 303-323.
Gaver, Jennifer J & Gaver, Kenneth
M. 1995. Compensation Policy
and The Investment Opportunity
Set. Financial Management. 24
(1): 19-32.
Gomes, Joao & Livdan, Dmitry. 2004.
Optimal Diversification:
Reconciling Theory and
Evidence. The Journal of
Finance. 2 (LIX): 507-535..
Harto, Puji. 2005. Kebijakan
Diversifikasi Perusahaan dan
Pengaruhnya Terhadap Kinerja:
Studi Empiris pada Perusahaan
Publik di Indonesia. SNA VIII
Solo, 15-16 September,
297-307.
Hasnawati, Sri. 2005a. Implikasi
Keputusan Investasi,
Pendanaan dan Dividen
Terhadap Nilai Perusahaan
Publik di Bursa Efek Jakarta.
Usahawan Indonesia. No.09 TH
XXXIV. 33-41.
___________. 2005b. Dampak Set
Peluang Investasi Terhadap
Nilai Perusahaan Publik di
Bursa Efek Jakarta. Jurnal AAI.
9(2): 117-126.
Hidayat, Riskin. 2010. Keputusan
Investasi dan Financial
Contraints: Studi Empiris pada
Bursa Efek Indonesia. Buletin
Ekonomi Moneter dan
Perbankan. 457-479.
Hitt, Michael A. R. Duane Ireland.
Robert E. Hosskison. 2011.
Concepts Strategic
Management Competitiveness &
Globalization 9e.South-Western
Cengage Learning. USA.
Hoskisson, Robert E & Hitt, Michael
225 Performance Outcomes of
Diversification: A Review and
Critique of Theoritical
Perpectives. Journal of
Management. 16 (2): 461-509.
Hossain, Mahmud. Ahmed, Kamran.
Godfrey, Jayne M. 2005.
Investment Opportunity Set and
Voluntary Disclosure of
Prospective Information: A
Simultaneous Equation
Approach. Journal of Business
Finance & Accounting. 32 (5) &
(6): 871-907.
Kallapur, S & Trombley, Mark A.
1999. The Association Between
Investment Opportunity Set
Proxies and Realized Growth.
Journal of Business Finance &
Accounting. 26 (3 & 4): 505-519.
Khanna, Tarun & Palepu, Krishna.
1999. Policy Shocks, Market
Intermediaries, and Corporate
Strategy: The Evolution of
Business Groups in Chile and
India. Journal of Economics &
Management Strategy. 8(2):
271-310.
Kole, S. 1991. An Investigation of The
Building of Compensation.
Working Paper.
Kusmawati. 2005. Pengaruh
Diversifikasi Usaha, Leverage,
dan Ukuran Perusahaan pada
Profitabitas Perusahaan Industri
Terbuka di Bursa Efek
Indonesia. Jurnal Riset
Akuntansi Aksioma, 4
(2):100-126.
Lang, Larry, H.P. & Stulz Rene, M.
1994., Tobin’s Q, Corporate
Diversification and Firm
Performance. Journal of Political
Economy. 1248-1278.
Li, Kai. Sarkar, Asani. Wang, Zhenyu.
2003. Diversification Benefits of
Emerging Markets Subject to
Portofolio Constraints. Journal
of Empirical Finance. 10: 57-80.
MacKay, Peter. 2003. Real Flexibility
and Financial Structure: An
Empirical Analysis. The Review
of Financial Studies. 16 (4):
1131-1165.
Matsusaka, Jhon, G. 2001. Corporate
Diversification, Value
Maximization, and
Organizational Capabilities.
Journal of Business. 74
(3):409-431.
Miller, Douglas, J. 2004. Firm’s
Technological Resources and
The Performance Effect of
Diversification: A Longitudinal
Study. Strategic Management
Journal. 25: 1097-1119.
___________. 2006. Technological
Diversity, Related Diversification
226 Management Journal. 27:
601-619.
Montgomery, Cynthia A. 1994.
Corporate Diversification.
Journal of Economic
Perspectives. 8 (3): 163-178.
Myers, Stewart C. 1977. Interactions
of Corporate Financing and
Investment Decisions—
Implications for Capital
Budgeting: Reply. The Journal
of Finance. 32(1): 218-220.
Nayyar, Praveen R. 1993.
Performance Effects of
Information Asymmetry and
Economies of Scope in
Diversified Service Firms.
Academy of Management
Journal. 36 (1): 411-418.
Nopratiwi, Agustina M. V. 2004.
Analisis Korelasi Investment
Opportunity Set Terhadap
Return Saham (Pada Saat
Pelaporan Keuangan
Perusahaan). Tesis. Pasca
Sarjana Universitas Gajah
Mada: Yogyakarta.
Palich, Leslie E. Cardinal, Laura B.
Miller, Chet C. 2000.
Curvilinearity in The
Diversification-Performance
Linkage: An Examination of
Over Three Decades of
Research. Strategic
Management Journal. 21:
155-174.
Ross, Stephen A. 1977. The
Determinan of Financial
Structure: The
Incentive-Signalling Approach. The Bell
Journal of Economics. 8 (1):
23-40.
Rumelt, Richard. P. 1974. Strategy,
Structure, and Economic
Performance, Harvard Business
School Classic.
__________. 1982. Diversification
Stratetgy and Profitability.
Strategies Management Journal.
3 (4): 359-369.
Santos, Marcelo B.D. Errunza, Vihang
R. Miller, Darius P. 2008. Does
Corporate International
Diversification Destroy Value?
Evidence from Cross-border
Mergers and Acquisition.
Journal of Banking & Finance.
32: 2716-2724.
Satoto, Sinta. H. 2009. Strategi
Diversifikasi Terhadap Kinerja
Perusahaan. Jurnal Keuangan
dan Perbankan, 13 (2):280-287.
Singh, Manohar. Wallace N. Davidson
III. Jo-Ann Suchard. 2003.
Corporate Diversification
Strategies and Capital Structure.
The Quarterly Review of
Economics and Finance.
227 Smith, Jr. Clifford. W & Watts, Ross.
L. 1992. The Investment
Opportunity Set and Corporate
Financing, Dividend and
Compensation Policies. Journal
of Financial Economics. 32:
263-292.
Suharli. 2007. Pengaruh Profitability
dan Investment Opportunity Set
Terhadap Kebijakan Dividen
Tunai dengan Likuiditas
Sebagai Variabel Penguat
(Studi pada Perusahaan yang
Terdaftar di Bursa Efek Jakarta
Periode 2002-2003). Journal
Akuntansi dan Keuangan. 9(1):
9-17.
Sujoko. 2006. Pengaruh Struktur
Kepemilikan Saham, Strategi
Diversifikasi, Leverage, Faktor
Internal dan Faktor Eksternal
Terhadap Nilai Perusahaan
(Studi pada Perusahaan
Manufaktur dan Non-Manufaktur
Di Bursa Efek Jakarta).
Disertasi. Program Doktor Ilmu
Manajemen Universitas
Brawijaya, Malang.
Sulastri. 2006. Pilihan Strategi
Diversifikasi dan Implikasinya:
Sebuah Pengembangan Model
Teoritik. Studi Empiris pada
Perusahaan Go Publik di
Indonesia. Ringkasan Disertasi.
Program Pasca Sarjana
Universitas Dipenogoro.
Semarang.
Teece, David J, Pisano, Gary, Shuen,
Amy. 1997. Dynamic
Capabilities and Strategic
Management. Strategic
Management Journal. 18 (7):
509-533.
Yoon, Pyung S & Starks, Laura T.
1995. Signaling, Investment
Opportunities, and Dividend
Announcements. The Review of
Financial Studies. 8 (4):
995-1018.
Yuliani. 2011. Leverage, Size and Age
Mediating Business Diversified
to Financial Performance:
Empirical Studies of Secondary
Sectors in Indonesian Stock
Exchange. Proceeding The 2nd
International Conference
Indonesian Management
Scientists Association. Pekan
Baru Riau. 2-4 Desember.