Ž .
Labour Economics 7 2000 203–224
www.elsevier.nlrlocatereconbase
Wage differentials between the public and the
private sectors: evidence from an economy in
transition
Vera A. Adamchik
a, Arjun S. Bedi
b,)a
Lehigh UniÕersity, Bethlehem, PA, USA b
Institute of Social Studies, Kortenaerkade 12, 2518 AX The Hague, The Netherlands
Received 5 November 1998; accepted 24 June 1999
Abstract
This paper uses data from Poland to examine whether there are any wage differentials between workers in the public and the private sectors. After standardising for worker characteristics and sector selection effects, we find a private sector wage advantage. The wage premium is particularly pronounced for University-educated workers. Our results suggest that these wage differentials will make it difficult for the public sector to attract and retain skilled employees. In addition, lower public sector wages may encourage moonlight-ing and compromise the efficiency of the public sector.q2000 Elsevier Science B.V. All
rights reserved.
JEL classification: J310
Keywords: Transition economies; Wage differentials
1. Introduction
Prior to the 1990s, the presence of the private sector in Poland was limited. Almost all non-agricultural employment was in the public sector and wages were
)Corresponding author. Tel.:q31-70-4260460; fax:q31-70-4260799
0927-5371r00r$ - see front matterq2000 Elsevier Science B.V. All rights reserved.
Ž .
determined by the government. The government tried to set wages taking into account marginal productivity, compensating wage differentials, social factors, and other considerations such as effort. However, even the first criterion itself was difficult to implement as distorted prices made it hard to measure productivity. Consequently, despite government effort, wages bore almost no relation to
differ-Ž .
ences in productivity or skill see Jackman and Rutkowski, 1994 .
In recent years, the economic transition in Poland has resulted in sharp changes in the wage structure. The rapid emergence and spread of the private sector, with its accent on productivity, has been charged as the primary force shaping these
Ž .
changes. Rutkowski 1996 displays that there has been a complete reversal of the pre-transition wage structure and reports increasing returns to education, higher private sector educational returns, higher private sector wages, and an increase in wage inequality.
Changes in the wage structure and wage differentials between the public and the private sectors may have significant consequences. Changing economic posi-tions of different groups and increasing wage differences may cause resentment, political disillusionment, and threaten or slow down the process of reform.1 Increasing wage differentials may also make it difficult for the public sector to
Ž .
retain and attract workers Katz and Krueger, 1991 . Alternatively, even if there are no recruitment problems, lower public sector wages may increase the incidence of moonlighting and adversely affect public sector efficiency. Furthermore, higher private sector wages might have spillover effects on the public sector with negative consequences on its fiscal position. Thus, the pertinent questions that need to be addressed are whether there are any wage differentials between the private and the public sectors and what are the implications of these differences. The issue of sectoral wage differentials has been intensively explored for
Ž
developed countries for recent work see Rees and Shah, 1995 and Dustmann and
. Ž
van Soest, 1998 . However, fewer studies exist for developing countries for a
.
survey see Van der Gaag et al., 1989 and for obvious reasons, work on Central and Eastern European countries is especially scanty. Existing evidence on
Ž .
private–public wage differentials in Poland is provided by Rutkowski 1996 and
Ž .
Coricelli et al. 1995 . Nevertheless, these studies should be viewed with caution as the results are based on examining average wages without controlling for workers’ characteristics. A further shortcoming of most existing research is that analysis of wage differentials is conducted after estimating sector specific wage equations.2 This approach ignores the choice aspect of belonging to a particular sector and may lead to biased estimates.
1
For instance, doctors in Warsaw were on strike for several months in 1997. Among other changes,
Ž w x.
their demands included an increase in pay packages Sluzba Zdrowia Health Care , 6–10 February
.
1997 .
2 Ž
The more recent literature addresses this problem by estimating switching regression models for,
.
( )
V.A. Adamchik, A.S. BedirLabour Economics 7 2000 203–224 205
In this paper, we use recently collected labour market data from Poland to estimate public–private sector earnings differentials. To tackle the selection issue, we rely on a switching regression model. In addition to econometric refinement, the results presented in this paper are interesting for a variety of reasons. First, our study is one of the few to explore such issues in the context of an economy undergoing transition. Second, the estimated wage gap, if any, provides an indication of the wages that the public sector needs to pay in order to keep up. This in turn provides an idea of the recruitment, retention and moonlighting problems that the public sector may face due to increasing wage differentials. The outline of the paper is as follows: Section 2 provides information on the Polish context, Section 3 discusses the analytical framework. Section 4 contains a discussion of the data and estimates. Section 5 summarises and concludes.
2. The evolution of the private sector
While the abolition of private means of production was a key precept of the socialist doctrine, the private sector never completely disappeared in Poland. Moreover, Polish central planners often used the expansion or contraction of the private sector for coping with problems of overemployment, unemployment, or
Ž .
labour shortages in some sectors Aslund, 1985 . However, since private owner-ship was an ideologically sensitive subject, its existence was concealed.3 While
figures on the share of the private sector in output are unavailable for the communist era, official employment statistics illustrate the position of the private sector in the Polish economy. Throughout this period, the private sector retained a dominant share in agricultural employment. For instance, in 1980, about 80%
ŽOECD, 1993, p. 37 of the agricultural labour force worked in private farms,.
while the private sector’s share in non-agricultural employment was small and
Ž .
constituted approximately 5% Aslund, 1985, p. 231 .
Reforms in 1982 and the subsequent economic transformation program and privatisation law of 1990 spurred the expansion of the private sector. The private sector developed due to the creation of new enterprises and through the process of privatising existing enterprises. While both elements contributed, the growth and the increasing share of the private sector in output and employment were attributed
Ž . 4
primarily to the creation of new small and medium enterprises SME . Although
3 Ž .
Commenting on the private sector during the pre-transition period, Aslund 1985 writes: ‘‘Some experts acknowledged that Polish statistics on the turnovers of private enterprises were little more than guesses’’, and further, ‘‘the extensive concealment was hardly in vain, and the state had no interest in
Ž .
revealing a large and efficient private sector’’ p. 9 .
4 Ž .
Bednarski 1997 reports that between 1990 and 1994, 1,069,000 jobs were created in the private sector. Only 342,000 of these were a result of privatisation and change in sector assignment. The remaining jobs were created due to the emergence of new SMEs. The SMEs constitute 98.6% of all
Ž .
the private sector has a presence in almost all sectors, its participation is especially dominant in the previously underdeveloped services sector, retail trade and construction.5 While the ‘‘small’’ privatisation program proceeded very rapidly, large-scale and medium enterprises still remained state-owned. It was only in 1995 that a number of state enterprises were prepared for ownership transformation.6
However, large-scale industry, especially mining, steel, power generation, telecommunications, shipbuilding, and armaments production, is still dominated by the state. Privatisation of these sectors along the lines of the first wave is also being planned. Despite the slow privatisation of the larger enterprises, the private sector has almost doubled its share of output since 1990 and currently the private sector’s share in total output as well as employment constitutes about 60%.7
The evolution of a substantial private sector has created new job opportunities and new services. However, it has also raised new issues. Wage and non-wage differences and their implications, as well as differences in job and individual
Ž .
characteristics across sectors are often debated for example, Jackman, 1992 . It is often argued that wages in the private sector are restrained by profit maximisation concerns while public sector wages are restricted primarily by the ability of public sector workers to extract as large a share of the public budget. Further, the inelastic demand for some public services and the capacity of governments to tax and borrow and absorb pay increases suggests that the public sector may pay
Ž . 8
higher wages Rees and Shah, 1995 . However, this may not be true in Poland. On the contrary, it appears that wages may be higher in the Polish private sector. Several factors may explain this feature.
First, acknowledging inflationary pressures and the budget deficit, an important feature of the Polish economic transformation program was wage control. Initially,
Ž
both public and private enterprises were subject to wage control an excess wage
5 Ž
As early as 1991, three-quarters of shops and restaurants were in private hands OECD, 1993, p.
.
39 . In 1996, private employment constituted 88% in retail trade, 78% in construction, and 46% in industry. The lowest shares were in transport, communication, mining, and education and health
Ž .
services Council of Ministers of the Republic of Poland, 1997 .
6
In this gradual style of privatisation, the ownership of 512 state enterprises was transferred to 15
Ž .
independent national investment funds NIF . These funds, generally with external fund managers, took over management of the company. Certificates in the fund programme were sold at a nominal price to adult Polish citizens. Since June 1997, these shares have been trading on the Warsaw Stock Exchange. The selection of these 512 firms appears to be based more on political rather than economic considerations. However, most of these were among the smaller state firms and were largely ‘‘ viable’’
ŽBusiness Central Europe, October 1997 . Similar schemes such as the National Industrial Funds and.
National Enfranchisement Funds are also being mooted to privatise larger firms which are in need of investment and restructuring.
7
For comparison, in 1990, the private sector share of GDP was 31% and that of total employment
Ž .
was 49% EBRD, 1996 .
8
Despite these arguments in favour of higher public sector wages, results from other countries do
Ž .
( )
V.A. Adamchik, A.S. BedirLabour Economics 7 2000 203–224 207
.
tax but in 1991, private enterprises were exempted from such a tax. Although the excess wage tax was suspended in 1994, state-owned enterprises are still subject to wage control.
Second, despite the adverse demand shocks being faced by the public sector, the wage and employment decisions of the state-owned enterprises were and are still driven by a desire to preserve jobs and minimise unemployment in order to lower social turbulence. Models of wage and employment decisions in the public
Ž . Ž .
sector presented by Jackman et al. 1992 , Blanchard et al. 1994 , Blanchard
Ž1997. and Jackman and Pauna Ž1997. imply that public sector workers in
Ž .
transition economies trade off employment against wages. Blanchard 1997 notes that the dominant role of the Polish workers and their willingness to maintain employment through wage cuts were stronger than in other post-communist countries. Therefore, it is likely that lower wages in the public sector are a consequence of an attempt to maintain the highest possible employment, subject to
Ž .
the financial constraint total wage bill . The idea of greater job security in the public sector is supported by our own calculations. Based upon Polish labour force
Ž .
surveys conducted in 1995, we find that during a 3-month interval 3.3% 0.8% of
Ž . Ž .
hired private public sector employees moved to another job, 1.7% 0.6%
Ž .
became unemployed as a result of liquidation or bankruptcy and 0.6% 0.2% as a
Ž .
result of being fired, and the total rate of job separation was 10.1% 3.2% . Third, wages in private enterprises may incorporate an element of ‘‘efficiency wage’’, and therefore private sector wages in Poland may be higher than those in the public sector. Private sector employers may set wages above market clearing levels in order to reduce turnover costs and, thus, to increase the efficiency of the
Ž .
firm Salop, 1979 or may be paying higher wages to discourage workers from
Ž . Ž .
shirking Shapiro and Stiglitz, 1984 . The latter, as argued by Lane 1992 , may operate in the private sector where job security is absent and dismissals for shirking are possible, while this aspect of wages is much less relevant in the socialised sector where the management ability to fire workers is limited by labour’s influence.
Fourth, the possibility of efficiency wages as well as the presence of internal
Ž .
labour markets and social norms Solow, 1990 may explain the downward rigidity of private sector wages in the presence of job shortages. Furthermore, it appears
Ž .
that the high unemployment rate in Poland 14.9% at the end of 1995 does not exert a high pressure on lowering wages, especially in the private sector. Socha
Ž . Ž .
and Sztanderska 1993 and Boeri 1994 point out a weak reaction of wages to growing unemployment. The authors view the low skill and training levels of the Polish unemployed as the main reasons. In a situation where the unemployed pool lacks required skills and knowledge, an emerging private sector tries to attract employed workers and direct job-to-job transitions have become a distinctive
Ž
feature of the Polish labour market see, for example, Boeri, 1994 and Jackman
.
all new job hirings and 75% of them had the private sector as their destination. In such circumstances, despite high unemployment, private sector wages may not be bid down.
Fifth, higher wages in the private sector may also be compensating for a lower
Ž .
level of social benefits. The study of Estrin et al. 1997 provides some evidence with regard to non-wage benefits in Poland. The authors report that both public and private sectors offered a substantial range of social benefits and that new private firms were in fact expanding the range of these benefits. At the same time, their analysis also indicates that new private enterprises provide a significantly fewer number of benefits to employees than state-owned or privatised firms. Thus, non-wage benefits raise the effective wage paid to the public sector workers. As a result, it may force private firms either to provide the adequate social provision or to compensate for lower non-wage benefits there by paying higher wages.
To summarise, wage differentials between the private and public sectors may be explained by several factors. On the one hand, higher private sector wages may incorporate elements of efficiency wages, while, on the other hand, higher private sector wages may simply be compensating for lower job security and lower non-wage benefits.
3. Choice of sector and the wage equations
This section presents a framework to highlight the role of wage differentials in influencing sector choice. We interpret sectoral wage differentials in terms of expected benefits and the desirability of working in a particular sector. Our model ignores the role of expected lifetime income or characteristics such as job security and other non-wage benefits in influencing sector choice. As the discussion in
Ž .
Section 2 suggests and also as pointed out by a referee , an alternative is to present the model in terms of a trade-off between wage and non-wage benefits. However, due to lack of detailed information on non-wage benefits, we present the model with the former interpretation.
More formally, workers face a choice between two sectors — the public and the private.9 Selection into a particular sector depends on the decisions of both the worker and the employer. A worker has to first determine, which sector to seek a job in, and, second, he or she has to be selected by an employer to join that sector. In the presence of job shortages, the cost of seeking a job depends on the
9
The small presence of the state sector in some industries raises the possibility that for some groups
Ž .
( )
V.A. Adamchik, A.S. BedirLabour Economics 7 2000 203–224 209
probability of not being selected which in turn is a function of worker’s character-istics. These characteristics determine the cost of seeking employment in a particular sector and also influence employers’ hiring decisions. A worker weighs the costs and expected benefits before arriving at a sector choice decision.
Ž .
Following Van der Gaag and Vijverberg 1988 , we assume that the expected benefits are equal to the wage differentials between the two sectors, and an individual i will join the private sector if the expected benefits exceed the cost, i.e., if:
lnW1 iylnW2 i)Xibq´s i
Ž .
1where W , W1 i 2 i are the private and public sector wages, respectively; X is ai
vector of characteristics associated with the probability of obtaining a private sector job and includes education, age, regional indicators and a variable
indicat-Ž 2.
ing time of entry into the labour market; and ´s i is a N 0, ss sector selection equation error term.
Following choice of sector we assume that there are two wage equations:
lnW1 isZig1q´1 i
Ž .
2lnW2 isZig2q´2 i
Ž .
3where Z is a vector of wage determining variables;i ´1 i, ´2 i are random residual
Ž 2. Ž 2.
terms assumed to be N 0, s1 , N 0, s2 . Substituting the wage equations into
Ž .
Eq. 1 , we can express the private sector selection criterion in terms of a reduced form probit model, where:
IU
sK ay´ .
Ž .
4i i i
If IiU)0, worker i is in the private sector, otherwise not. Here, K absorbs all exogenous variables in Z and X and ´i is a composite error term. The two wage
Ž .
equations and the probit equation the switching regression constitute our model.
Ž . Ž .
Relying on the assumption that ´1, ´2, ´ are N 0,S , maximum likelihood
Ž . Ž .
estimates of the model consisting of Eqs. 2 – 4 may be obtained.
Before we proceed, a couple of issues need to be discussed. It is well known that empirical models such as the one outlined above are sensitive to the distributional assumption and the specification of both the first step switching equation and the wage equations. In order to reduce this sensitivity, we would ideally like to have several variables that influence sector choice but do not influence earnings. At the very least to achieve identification of the selection equation, we need one variable that influences sector choice but may be excluded
Ž .
individual entered the labour market after 1989. The idea is that individuals entering the post-1989 labour market had greater access to the private sector and presumably lower costs of entry.10 We expect that post-1989 labour market entrants will have a higher probability of working in the private sector.11
4. Data and estimates
4.1. The data
Ž .
The data in this paper stems from a Labour Force Survey LFS conducted by the Polish Central Statistical Office in February 1996. The survey constitutes the primary labour market data collection effort of the Polish government and is designed to provide a nationally representative random sample. We restrict our
Ž . Ž .12
attention to individuals aged between 15 and 64 men and 15 and 59 women who are full-time hired workers and who supply information on their labour income. Self-employed individuals and individuals without reported wage informa-tion were deleted from the sample. The final sample consists of 13,691 individu-als. Around 68% of all workers in the sample are employed in the public sector.13
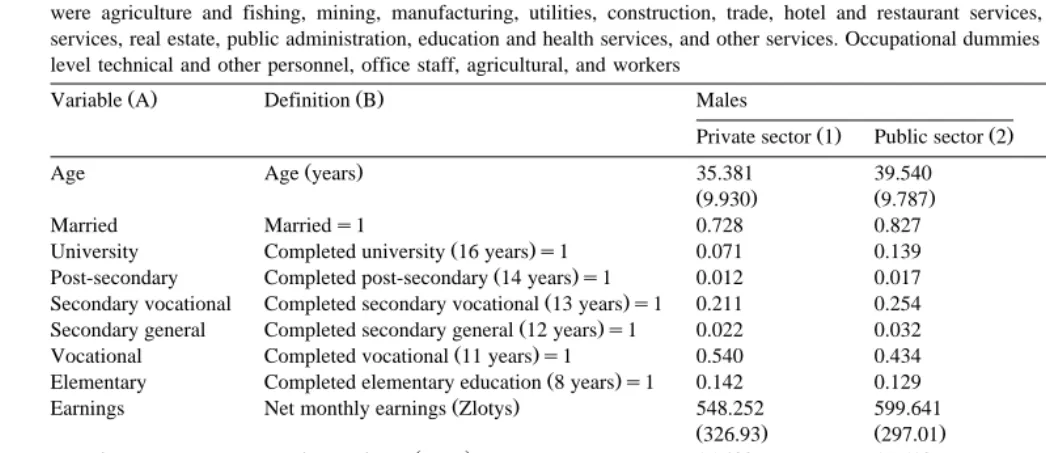
Descriptive statistics for the variables by sector and gender are provided in Table 1. In addition, Table 2 presents monthly earnings for different educational levels in both sectors for males and females. A greater proportion of employees in the public sector possess university degrees. The educational differences may be explained by the private sector presence in retail trade and basic services, which may not need very high educational qualifications. In both sectors and overall, individuals with vocational education dominate the educational structure. This is a manifestation of the pre-transition wage structure, which did not provide adequate incentives to invest in education. Acquisition of narrow vocational skills was encouraged while investment in general, transferable skills was ignored.14 Public
10
Later on in the text, we discussed the validity of these assumptions.
11 Ž
We also considered another instrument — a dummy indicating whether non-labour income such
.
as rental income was the main source of household income. However, the proportion of families in this category was too small. Accordingly, we dispensed with the use of this variable.
12
The different age restrictions for men and women correspond to their different retirement ages.
13
As defined by the LFS, the public sector includes employees of public sector enterprises and local and central government civil servants paid out of the government budget. The private sector includes industrial, service and trade economic entities belonging to physical persons or trade co-operatives
Ž
where the share of private capital is greater than 50%, co-operatives with foreign capital joint
.
ventures , foreign small enterprises and individual agricultural farms.
14
In Poland, 77.4% of secondary enrolment was in vocational schools. The corresponding figures for some other European countries are: Austria — 28.5%, Netherlands — 44.3%, Sweden — 35.6% and
Ž .
()
Definition of variables and their means standard deviations for continuous variables are shown in parentheses . The industry dummies used in our analysis were agriculture and fishing, mining, manufacturing, utilities, construction, trade, hotel and restaurant services, transport and communication, financial services, real estate, public administration, education and health services, and other services. Occupational dummies were managers and professionals, middle level technical and other personnel, office staff, agricultural, and workers
Ž . Ž .
Variable A Definition B Males Females
Ž . Ž . Ž . Ž .
Private sector 1 Public sector 2 Private sector 3 Public sector 4
Ž .
Age Age years 35.381 39.540 34.825 40.019
Ž9.930. Ž9.787. Ž9.801. Ž8.563.
Married Marrieds1 0.728 0.827 0.671 0.768
Ž .
University Completed university 16 yearss1 0.071 0.139 0.062 0.184
Ž .
Post-secondary Completed post-secondary 14 yearss1 0.012 0.017 0.040 0.099
Ž .
Secondary vocational Completed secondary vocational 13 yearss1 0.211 0.254 0.291 0.318
Ž .
Secondary general Completed secondary general 12 yearss1 0.022 0.032 0.105 0.111
Ž .
Vocational Completed vocational 11 yearss1 0.540 0.434 0.378 0.166
Ž .
Elementary Completed elementary education 8 yearss1 0.142 0.129 0.121 0.122
Ž .
Earnings Net monthly earnings Zlotys 548.252 599.641 446.583 464.361
Ž326.93. Ž297.01. Ž271.28. Ž194.53.
Ž .
Experience Work experience years 15.402 19.513 13.412 18.063
Ž10.13. Ž10.01. Ž9.711. Ž8.740.
Rural Resides in a rural areas1 0.342 0.295 0.287 0.234
Ž .
City100 Resides in city pop.)than 100,000s1 0.328 0.303 0.351 0.336
Ž
City20 Resides in city pop.)20,000 and 0.198 0.259 0.229 0.280
. -100.000s1
Ž .
City5 Resides in city pop.)5,000 and-20,000s1 0.105 0.117 0.101 0.122
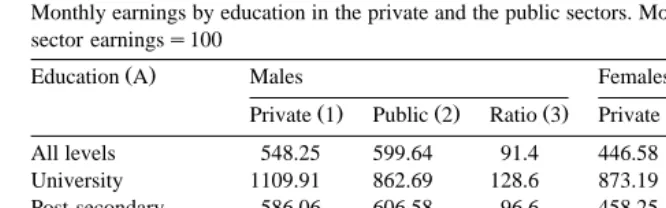
Table 2
Monthly earnings by education in the private and the public sectors. Monthly earnings in Zlotys. Public sector earningss100
Ž .
Education A Males Females
Ž . Ž . Ž . Ž . Ž . Ž .
Private 1 Public 2 Ratio 3 Private 4 Public 5 Ratio 6
All levels 548.25 599.64 91.4 446.58 464.36 96.1
University 1109.91 862.69 128.6 873.19 609.15 143.3
Post-secondary 586.06 606.58 96.6 458.25 448.68 102.1
Secondary vocational 591.72 624.82 94.7 464.71 462.06 100.5
Secondary general 655.91 610.61 107.4 479.59 482.22 99.4
Vocational 479.32 536.13 89.4 371.54 385.98 96.2
Elementary 445.63 470.14 94.7 386.72 351.71 109.9
Ž .
sector workers are generally older, with public sector male female employees
Ž .
over 4 5 years older than those in the private sector. The share of the young in the private sector may be explained by the greater employment opportunities in the new private sector as well as their higher mobility and flexibility to adjust to
Ž .
rapidly changing market conditions see OECD, 1993, pp. 40–42 . While it is possible for older public sector workers to move to the private sector, costs of entry in the form of inadequate skills or their vintage education probably makes it more difficult for them to make this change. The age gap is mirrored in the
Ž .
average experience differences. For males females , total experience averages
Ž . Ž . 15
about 20 18 and 15 13 years in the public and private sectors, respectively. To provide a picture of earnings differentials at the outset, we see that average net monthly earnings for males in the private sector are 8.6% lower than those in the public sector, for females the difference is 3.9%. These small gaps, especially for females, are noteworthy. Despite the higher experience and the presence of more highly educated workers in the public sector, earnings differences are quite small. Although the public sector advantage is not very large, earnings variation in the private sector is much higher than in the public sector.16 For males and
females, the public sector earnings advantage stems from the higher remuneration
15
The experience variable used in our work refers to actual experience. The labour force survey that we rely on asks individuals for information on the number of years that they have worked. This information is used to create the experience variable for the individuals in our sample.
16
( )
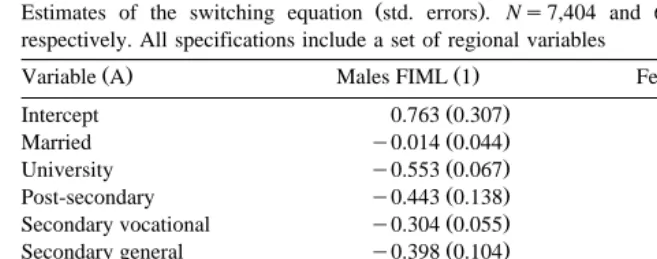
V.A. Adamchik, A.S. BedirLabour Economics 7 2000 203–224 213 Table 3
Ž .
Estimates of the switching equation std. errors . Ns7,404 and 6,287 for males and females, respectively. All specifications include a set of regional variables
Ž . Ž . Ž .
Variable A Males FIML 1 Females FIML 2
Ž . Ž .
Secondary vocational y0.304 0.055 y0.293 0.061
Ž . Ž .
Secondary general y0.398 0.104 y0.243 0.074
Ž . Ž .
Age 100 0.014 0.018 0.100 0.002
Ž . Ž .
New regime 0.228 0.067 0.028 0.083
Log likelihood y6669.76 y3965.28
for workers with vocational training. However, individuals with university
educa-Ž .
tion earn more in the private sector. Male female University-educated private
Ž .
sector employees enjoy a 28.6% 43.3% earnings advantage.
4.2. The switching equation
Estimates of the switching equation for males and females are presented in Table 3. The specification of the switching equation is similar to the wage equation. However, as mentioned earlier, to enable identification we use age
Ž .
instead of experience and include a variable new regime indicating time of entry into the labour market.
For all levels, except vocational training for women, we find negative education effects on private sector participation. Simply acquiring higher education does not increase chances of private sector employment. This suggests that other features such as the quality of the education may be more important in determining private sector participation as opposed to the quantity of the education.17 The coefficient
on age for males and females is negative and statistically significant indicating that older individuals are less likely to be working in the private sector. This feature probably reflects the private sector propensity to hire more recent graduates with modern, relevant education who can be trained as compared to more experienced
17
While our finding that individuals with higher education are more likely to work in the public sector is consistent with the bulk of the existing literature, it is possible that the results are biased due
Ž .
workers possessing vintage education and whom might be difficult to retrain. As expected, those individuals who entered the labour market after 1989 are more likely to be working in the private sector. The coefficient on this indicator variable is positive for both males and females, albeit it is statistically significant only for
Ž .
males t-statistic is 3.40 . Hence, it appears that this instrument is quite successful
Ž .
at enabling identification at least for males .
4.3. The wage equations
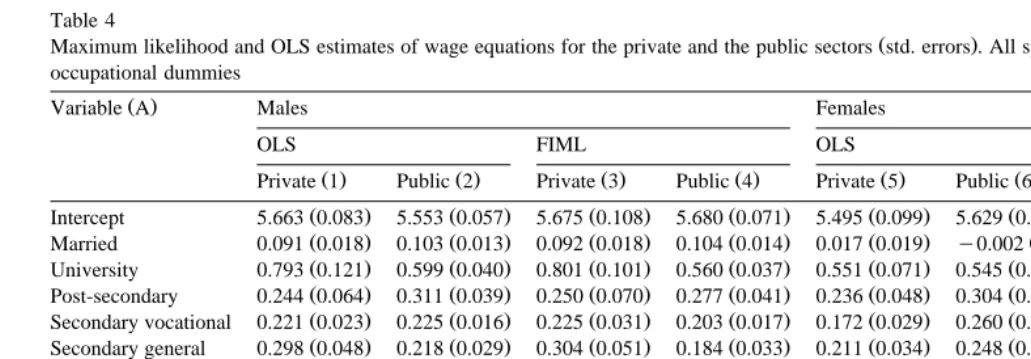
Sector specific OLS and maximum likelihood estimates of the two wage equations for both men and women18 are presented in Table 4.19 In addition to
the marriage dummy, the wage equations contain a set of variables capturing education and experience. We use educational dummies rather than years of education in order to capture non-linear and differential returns associated with different levels of education. Elementary education is the reference category. A set of thirteen industry dummies,20 occupational dummies, as well as a set of regional dummies were included to control for industry, occupational and regional effects on earnings.
Concentrating on the maximum likelihood results for males, we note that
Ž
married men earn a substantial premium in both sectors about 9% and 10% in the
. 21
private and public sectors, respectively . Returns to education at all levels are
Ž
significantly different from zero. As compared to the reference category those
.
with elementary education , all other workers enjoy an earnings advantage. Returns to general education are distinctly higher in the private sector, with returns of about 80% vs. 56% for university education and about 30% vs. 18% for secondary general education. At other educational levels, this private sector
18
For females, selection effects associated with labour force participation may be a more important source of bias as compared to sector selection effects. While we acknowledge this possibility, we do not make any adjustment for this feature as the main focus of the paper is on wage differences across sectors for those who have selected to participate in the labour force.
19 Ž .
F 29, 13,633s48.086 rejected equality of the regression coefficients for the male and female
Ž . Ž .
samples. F 29, 7346s3.347 and F 29, 6229s2.632 for males and females, respectively, rejected equality of the regression coefficients for the private and public sector.
20 Ž .
Several authors e.g., Knight and Sabot, 1981 have argued that occupational and industrial dummies may be endogenous and should not be included in earnings functions. On the other hand, if occupation and sector affects earnings, then excluding such variables may result in biased estimates. We estimated specifications with and without industry and occupational dummies. Although there are differences between the estimates, the results are robust to the inclusion of these dummies.
21
While it is the usual practice to refer to coefficients in log wage equations as percentage differences, this is not appropriate for discrete variables. However, following convention we interpret these coefficients in terms of percentage difference. The exact interpretation is provided in Halvorsen
Ž .
()
V.A.
Adamchik,
A.S.
Bedi
r
Labour
Economics
7
2000
203
–
224
215
Table 4
Ž .
Maximum likelihood and OLS estimates of wage equations for the private and the public sectors std. errors . All specifications include regional, industry and occupational dummies
Ž .
Variable A Males Females
OLS FIML OLS FIML
Ž . Ž . Ž . Ž . Ž . Ž . Ž . Ž .
Private 1 Public 2 Private 3 Public 4 Private 5 Public 6 Private 7 Public 8
Ž . Ž . Ž . Ž . Ž . Ž . Ž . Ž .
Intercept 5.663 0.083 5.553 0.057 5.675 0.108 5.680 0.071 5.495 0.099 5.629 0.052 5.508 0.124 5.423 0.053
Ž . Ž . Ž . Ž . Ž . Ž . Ž . Ž .
Married 0.091 0.018 0.103 0.013 0.092 0.018 0.104 0.014 0.017 0.019 y0.002 0.009 0.018 0.019 0.006 0.010
Ž . Ž . Ž . Ž . Ž . Ž . Ž . Ž .
University 0.793 0.121 0.599 0.040 0.801 0.101 0.560 0.037 0.551 0.071 0.545 0.023 0.564 0.078 0.614 0.025
Ž . Ž . Ž . Ž . Ž . Ž . Ž . Ž .
Post-secondary 0.244 0.064 0.311 0.039 0.250 0.070 0.277 0.041 0.236 0.048 0.304 0.018 0.246 0.070 0.367 0.023
Ž . Ž . Ž . Ž . Ž . Ž . Ž . Ž .
Secondary vocational 0.221 0.023 0.225 0.016 0.225 0.031 0.203 0.017 0.172 0.029 0.260 0.014 0.175 0.035 0.278 0.015
Ž . Ž . Ž . Ž . Ž . Ž . Ž . Ž .
Secondary general 0.298 0.048 0.218 0.029 0.304 0.051 0.184 0.033 0.211 0.034 0.248 0.017 0.214 0.039 0.263 0.018
Ž . Ž . Ž . Ž . Ž . Ž . Ž . Ž .
Vocational 0.074 0.026 0.094 0.018 0.075 0.027 0.085 0.020 0.032 0.034 0.091 0.019 0.028 0.044 0.045 0.020
Ž . Ž . Ž . Ž . Ž . Ž . Ž . Ž .
Experience 0.014 0.003 0.012 0.002 0.014 0.004 0.010 0.002 0.006 0.003 0.019 0.002 0.006 0.004 0.027 0.002 U
2 Ž . Ž . Ž . Ž . Ž . Ž . Ž . Ž .
Experience 100 y0.026 0.007 y0.016 0.004 y0.026 0.008 y0.014 0.004 0.014 0.009 y0.026 0.005 0.013 0.010 y0.040 0.005
N 2,681 4,723 2,681 4,723 1,640 4,647 1,640 4,647
Ž . Ž . Ž . Ž .
si 0.339 0.310 0.338 0.006 0.323 0.005 0.319 0.264 0.317 0.006 0.305 0.004
Ž . Ž . Ž . Ž .
ri´ – – y0.062 0.315 y0.396 0.062 – – y0.068 0.252 0.790 0.016
2
advantage is not as pronounced and is in fact reversed for both post-secondary and vocational education. The estimates also show that the private sector exhibits greater variation in educational returns and earnings. Not only are returns to university education higher in the private sector but the earnings gap between university graduates and those with lower educational levels is much higher within the private sector. Returns to experience are similar across the two sectors.
In contrast to males, the maximum likelihood estimates show that married women do not earn significantly higher wages than their unmarried counterparts. Returns to education are positive, but, unlike those for the male sample, are higher in the public sector at all educational levels. This may seem odd and is explained
Ž .
by the large effects of the occupational dummies not reported in Table 4 . Similarly, experience is more highly rewarded in the public sector.
A comparison of the OLS and FIML results reveals that, for both males and females, there are several differences in the public sector estimates. For males, allowing for correlation between the error terms in the wage equation and the sector equation leads to a small downward revision of most of the education and experience coefficients in the public sector. In the absence of this correction, returns in the public sector would be slightly overestimated. For the private sector,
Ž .
the correlation coefficient is negative y0.062 but insignificant and for the public
Ž .
sector negative y0.396 and highly significant. Therefore, the estimated selection effect is positive in the private sector but negative in the public sector. This
Ž .
implies that males in the private public sector have unobserved characteristics
Ž .
which allow them to earn more less than the average worker in the private and the public sectors. This pattern of positive selection suggests that individuals with better skills select themselves into the sector with higher variance in earnings. For females, there is a substantial upward revision of most of the education and experience coefficients in the public sector. For the private sector, the selection effect is similar to that for males. However, the public sector correlation
coeffi-Ž .
cient is positive 0.790 and significant. Thus, there are positive selection effects in both sectors and this suggests that females with unobserved wage advantages in
Ž .
the private public sector are more likely to select themselves into the private
Žpublic sector..
4.4. SensitiÕity analysis
We now turn to an assessment of the sensitivity of our results to the identifica-tion assumpidentifica-tions. Identificaidentifica-tion in our baseline specificaidentifica-tions relies on differences in the functional form and on using the age and new regime variables in the sector choice equation and excluding them from the wage equations. To discern the sensitivity of our estimates as well as to assess the validity of these assumptions, we re-estimate our model for both males and females by dropping some of these
Ž .
( )
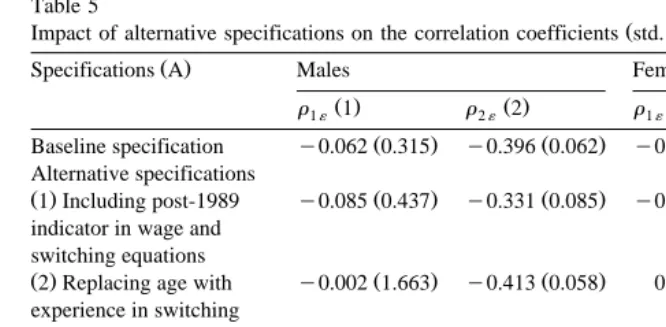
V.A. Adamchik, A.S. BedirLabour Economics 7 2000 203–224 217 Table 5
Ž .
Impact of alternative specifications on the correlation coefficients std. errors
Ž .
Specifications A Males Females
Ž . Ž . Ž . Ž .
r1´ 1 r2´ 2 r1´ 3 r2´ 4
Ž . Ž . Ž . Ž .
Baseline specification y0.062 0.315 y0.396 0.062 y0.068 0.252 0.790 0.016 Alternative specifications
wage equations. In the second alternative specification, we replace age with experience in the switching equation and include the new regime indicator variable in the wage equations as well, thus, this specification relies only on the functional form for identification. And, finally, in our third alternative specification, we exclude occupational and sectoral indicators from the wage equations.
For males, the alternative specifications yield results that are similar to our
Ž .
baseline specification see Table 5, columns 1 and 2 . Furthermore, when the new regime indicator variable appears in both the wage and switching equations, the coefficients on this variable in the wage equations are insignificant in the private
Žcoefficient y0.0175, std. error 0.038 and public sectors coefficient. Ž y0.055, .
std. error 0.085 , while retaining its magnitude and significance in the switching
Ž .
equation 0.196, std. error 0.069 . Next, when we use experience instead of age in the switching equation and include the new regime indicator in both the switching and wage equations, the results are similar to those in the first alternative specification. The coefficients on the new regime indicator are insignificant in the wage equations and, albeit smaller, the variable retains significance in the
switch-Ž .
ing equation 0.128, std. error 0.067 . Estimates from our third alternative specification indicate that changes in the specification of the wage equation leave our estimates largely unperturbed.
To further assess the validity of excluding age from the wage equations, we run
Ž .
()
V.A.
Adamchik,
A.S.
Bedi
r
Labour
Economics
7
2000
203
–
224
Table 6
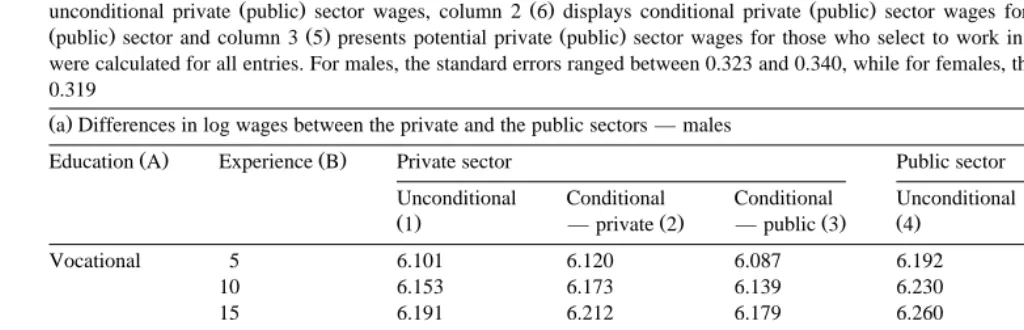
Ž .
All other characteristics are set at the sample mean. Wages are predicted on the basis of the FIML estimates reported in Tables 3 and 4. Column 1 4 presents
Ž . Ž . Ž .
unconditional private public sector wages, column 2 6 displays conditional private public sector wages for those who choose to work in the private
Žpublic sector and column 3 5 presents potential private public sector wages for those who select to work in the public private sector. Standard errors. Ž . Ž . Ž .
were calculated for all entries. For males, the standard errors ranged between 0.323 and 0.340, while for females, the standard errors ranged between 0.305 and 0.319
Ž .a Differences in log wages between the private and the public sectors — males
Ž . Ž .
Education A Experience B Private sector Public sector
Unconditional Conditional Conditional Unconditional Conditional Conditional
Ž .1 — private 2Ž . — public 3Ž . Ž .4 — private 5Ž . — public 6Ž .
Vocational 5 6.101 6.120 6.087 6.192 6.307 6.102
10 6.153 6.173 6.139 6.230 6.354 6.148
15 6.191 6.212 6.179 6.260 6.394 6.186
Secondary 5 6.252 6.274 6.240 6.307 6.444 6.235
vocational 10 6.303 6.327 6.293 6.345 6.492 6.280
15 6.341 6.366 6.332 6.376 6.532 6.317
Secondary 5 6.330 6.353 6.319 6.292 6.437 6.226
general 10 6.381 6.406 6.372 6.330 6.485 6.271
15 6.419 6.446 6.411 6.360 6.525 6.307
University 5 6.828 6.853 6.818 6.664 6.824 6.608
10 6.879 6.907 6.871 6.702 6.873 6.652
()
V.A.
Adamchik,
A.S.
Bedi
r
Labour
Economics
7
2000
203
–
224
219
Ž .b Differences in log wages between the private and the public sectors — females
Ž . Ž .
Education A Experience B Private sector Public sector
Unconditional Conditional Conditional Unconditional Conditional Conditional
Ž .1 — private 2Ž . — public 3Ž . Ž .4 — private 5Ž . — public 6Ž .
Vocational 5 5.855 5.873 5.839 5.558 5.354 5.739
10 5.898 5.919 5.884 5.664 5.428 5.817
15 5.948 5.971 5.936 5.749 5.489 5.883
Secondary 5 6.003 6.030 5.993 5.791 5.495 5.900
vocational 10 6.046 6.076 6.038 5.896 5.564 5.984
15 6.095 6.128 6.089 5.982 5.622 6.056
Secondary 5 6.041 6.067 6.031 5.776 5.489 5.891
general 10 6.084 6.113 6.076 5.882 5.559 5.974
15 6.134 6.165 6.127 5.967 5.617 6.046
University 5 6.392 6.427 6.387 6.127 5.739 6.188
10 6.435 6.473 6.431 6.233 5.805 6.278
not suggest that it should be included in the wage equation. For instance, in the
Ž
former specification the coefficients on the age variables were 0.018 std. error
. Ž .
0.015 and 0.112 std. error 0.071 for the private and public sectors, respectively.
Ž .
The lack of age effects is explained by the correlation 0.910 between experience and age and implies that the experience variable is capturing age or other life-cycle effects. These informal checks seem to indicate that at least for the male sample excluding age from the wage equation is not inappropriate.
Ž
Results for the female sample displayed more sensitivity see Table 5, columns
.
3 and 4 . The inclusion of the new regime indicator in the wage equations did not affect the results. However, the replacement of age with experience in the switching equation and inclusion of the new regime indicator variable in the wage equations resulted in a reversal of the sign on the private sector selection coefficient. The lack of better identifying instruments and the change of signs for the female sample urge caution in the interpretation of these selection effects.
4.5. Examining wage differentials
The estimation results presented in Tables 3 and 4 can now be used to analyse the gap between private and public sector earnings. For males, we predict log
Ž .
monthly earnings of 6.350 572 Zlotys in the private sector and log monthly
Ž . 22
earnings of 6.278 532 Zlotys for an identical public sector worker. This represents a 7% earnings advantage for an average male private sector worker. For females, the difference is slightly more pronounced and there is a 10% wage
Ž .
differential 474 Zlotys in the private and 427 Zlotys in the public sector . To further analyse wage differentials, we predict unconditional and conditional log wages rates for individuals with different educational and experience charac-teristics. The unconditional wage may be interpreted as the expected or offered wage before an individual joins a particular sector while conditional wage is the wage obtained by an individual while working in that particular sector.
Table 6a and b present predicted wages for male and female private and public sector workers with different educational and experience characteristics. Columns 1 and 4 display unconditional private and public sector log wages, respectively. Concentrating on the results for males, we note that the private sector offered log wages for a male worker are higher for those with general education, that is, university and secondary general education, and lower for those with vocational education. This pattern probably reflects the vestiges of the previous regime where vocational and specialised education was accorded a greater ‘‘social value’’. The private sector wage advantage tends to increase with experience and is pronounced
22
( )
V.A. Adamchik, A.S. BedirLabour Economics 7 2000 203–224 221
at the university level. For instance, a male worker with university education and 5
Ž .
years of work experience all other characteristics are held at the sample average
Ž .
receives a private sector log wage offer of 6.828 923 Zlotys while the public
Ž .
sector log wage offer is 6.664 784 Zlotys , that is an 18% earnings advantage. The advantage at the secondary general level is smaller and ranges from 4% to 6%. For females, the offered log wages are higher in the private sector at all levels of education and experience. This advantage ranges from 19% for those with secondary vocational education to 23% for those with university education.
Columns 2 and 6 present wages for those workers who have chosen to work in the private and public sectors, respectively. For males, the opposing selection effects detected in the two sectors cause the conditional wage differential to be greater than the unconditional wage differential. The private sector conditional log wage for a worker with university education and 5 years of work experience is
Ž . Ž
6.853 946 Zlotys while the public sector conditional log wage is 6.608 740
.
Zlotys , that is a 22% earnings advantage. Similarly, the private sector conditional wage advantage also increases for workers with other levels of education. For females, the positive selection effects detected in both sectors lead to a narrowing of these differentials. At the secondary vocational level, the differential drops to around 12% while at the university level, it is around 21%.
To discern the selection effects in a clearer manner, we present an additional set of conditional wages. Column 3 displays the wages that public sector workers would have received had they been working in the private sector and column 5 presents the wages that private sector workers would receive if they were working in the public sector. For males, there is negative selection into the public sector and it appears that even if the public sector workers were working in the private sector they would earn less than those who have selected to work in the private
Ž .
sector compare columns 2 and 3 . On the other hand, private sector workers in the public sector would potentially earn more than those who have selected to work in
Ž .
the public sector compare columns 5 and 6 . For females, there is evidence of positive selection in both sectors and we note that the potential wages of public sector workers in the private sector are lower as compared to those who have selected to work in the private sector; and, similarly, the potential wages for private sector workers in the public sector are lower than for those who have selected to work in the public sector. However, since the positive public sector selection effect is more pronounced, this group of workers experiences a much smaller wage differential between the two sectors.
5. Summary and conclusion
these differences. To examine this question, we relied on recently collected labour market data and used a switching regression model. Overall, we found a private sector earnings advantage, which was particularly pronounced at the university level. For males, we detected positive selection into the private and negative selection into the public sector. For females, we observed positive selection in both the public and private sectors.
What are the consequences of these wage differences and selection effects? For males, the extent of the wage gap for those with university education and the negative selection effects suggest that the public sector may be facing difficulties in retaining and recruiting highly educated and high calibre individuals. While wage differences between the two sectors are more pronounced for females, it appears that intangible job characteristics like prestige, job security, job flexibility and other non-wage benefits are successful in motivating skilled female workers to seek work in the public sector. Even if there are no recruitment problems, widening wage gaps might promote moonlighting. This is particularly attractive for public sector workers as they can retain their secure first job and supplement their incomes by maintaining a second job. Double jobbing and doing the bare minimum at their public sector job will compromise the efficiency of the public sector.23
While wider wage gaps create problems, attempts to keep up are fraught with negative consequences. Paying higher wages will increase the wage bill and strain the fiscal position of the public sector. This strain may be particularly severe in situations where public sector enterprises have been used as employment generat-ing vehicles. Ignorgenerat-ing the wage gap will reduce fiscal strain, promote inefficiency and create an increasingly disaffected public sector workforce. On the other hand, attempting to keep up may be impossible. Although painful, the best way to satisfy the need for higher public sector efficiency and ease fiscal strain may be to reduce public sector employment and pay higher wages to educated workers.
Acknowledgements
We wish to thank the Central and East European Economic Research Centre at Warsaw University, Poland for providing us with the data. We are grateful to E. Aksman, W. Charemza, S. Wellisz, and especially to two anonymous referees for
23
Our data provide some evidence of higher moonlighting in the public sector. Ten percent of public sector workers have an additional job as compared to 6% in the private sector. These figures are certainly underreported. An article in the popular press reports that around 18% of workers have two
Ž .
jobs Wprost, 1 December 1996 . Additionally, there is a greater tendency for highly educated workers to have two jobs. While around 12% of our sample has university education, the percentage of university educated amongst those with two jobs is around 24%. In related work, the effect of wage
Ž .
( )
V.A. Adamchik, A.S. BedirLabour Economics 7 2000 203–224 223
their helpful comments. Thanks also to L. Morawski for material help and several discussions on the Polish labour market.
References
Aslund, A., 1985. Private Enterprise in Eastern Europe. St. Martin’s Press, New York.
Bedi, A., 1998. Sector choice, multiple job holding and wage differentials: evidence from Poland. Journal of Development Studies 35, 162–179.
Bednarski, M., 1997. Small and medium companies and active labour market policy in Poland. Mimeo, Department of Economics, Warsaw University.
Blanchard, O., 1997. The Economics of Post-Communist Transition. Clarendon Press, Oxford. Blanchard, O., Commander, S., Coricelli, F., 1994. Unemployment and the labour market in Eastern
Europe. Unemployment in Transition Countries: Transient or Persistent? OECD, Paris, pp. 59–76. Boeri, T., 1994. Labour market flows and the persistence of unemployment in Central and Eastern Europe. Unemployment in Transition Countries: Transient or Persistent? OECD, Paris, pp. 13–56.
Ž .
Coricelli, F., Hagemejer, K., Rybinski, K., 1995. Poland. In: Commander, S., Coricelli, F. Eds. , Unemployment, Restructuring, and the Labour Market in Eastern Europe and Russia. The World Bank, Washington, DC, pp. 39–90.
Council of Ministers of the Republic of Poland, 1997. Rozwoj sektora prywatnego. Biuletyn Eko-nomiczny 10.
Dustmann, C., van Soest, A., 1998. Public and private sector wages of male workers in Germany. European Economic Review 42, 1417–1441.
EBRD, 1996. Poland Country Profile 1996.
Estrin, S., Schaffer, M., Singh, I., 1997. The provision of social benefits in state owned, privatised, and
Ž .
private firms in Poland. In: Rein, M., Friedman, B., Worgotten, A. Eds. , Enterprise and Social Benefits After Communism. Cambridge Univ. Press, pp. 25–48.
Halvorsen, R., Palmquist, R., 1980. The interpretation of dummy variables in semilogarithmic equations. American Economic Review 70, 474–475.
Jackman, R., 1992. Wage policy in the transition to a market economy: the Polish experience. In:
Ž .
Coricelli, F., Revenga, A. Eds. , Wage Policy During the Transition to a Market Economy. The World Bank, Washington, DC, pp. 89–97.
Jackman, R., Pauna, C., 1997. Labour market policy and the reallocation of labour across sectors. In:
Ž .
Zecchini, S. Ed. , Lessons from the Economic Transition: Central and Eastern Europe in the 1990s. Kluwer Academic Publishers, Boston, pp. 373–392.
Ž .
Jackman, R., Rutkowski, M., 1994. Labour markets: wages and employment. In: Barr, N. Ed. , Labour Markets and Social Policy in Central and Eastern Europe. Oxford Univ. Press, New York, NY, pp. 121–159.
Jackman, R., Layard, R., Scott, A., 1992. Unemployment in Eastern Europe. Paper presented to NBER conference. Cambridge, MA, February.
Katz, L., Krueger, A., 1991. Changes in the structure of wages in the public and private sectors. In:
Ž .
Ehrenberg, R. Ed. , Research in Labour Economics. JAI Press, Greenwich, CT, pp. 137–172. Knight, J., Sabot, R., 1981. The returns to education: increasing with experience or decreasing with
expansion? Oxford Bulletin of Economics and Statistics 43, 51–71.
Lane, T., 1992. Wage controls in reforming socialist economies: design, coverage, and enforcement. In:
Ž .
Coricelli, F., Revenga, A. Eds. , Wage Policy During the Transition to a Market Economy. The World Bank, Washington, DC, pp. 73–87.
Morawski, L., 1997. The growth of small and medium enterprises in Poland. Mimeo, CEEERC, Department of Economics, Warsaw University.
Rees, H., Shah, A., 1995. Public–private sector wage differential in the UK. The Manchester School of Economic and Social Studies 63, 52–68.
Rutkowski, J., 1996. High skills pay off: the changing wage structure during economic transition in Poland. Economics of Transition 4, 89–112.
Salop, S., 1979. A model of the natural rate of unemployment. American Economic Review 69, 117–125.
Shapiro, C., Stiglitz, J., 1984. Equilibrium unemployment as a worker discipline device. American Economic Review 74, 433–444.
Socha, M., Sztanderska, U., 1993. The labour market. In: Kierzkowski, H., Okolski, M., Wellisz, S.
ŽEds. , Stabilisation and Structural Adjustment in Poland. Routledge, London, pp. 131–151..
Solow, R., 1990. The Labour Market as an Institution. Blackwell, Cambridge, MA.
Van der Gaag, J., Vijverberg, W., 1988. A switching regression model for wage determinants in the public and private sectors of a developing country. Review of Economics and Statistics 70, 244–252.