Journal of Laboratory Chemical Education 2017, 5(1): 9-12 DOI: 10.5923/j.jlce.20170501.03
High School Chemistry Activities with an Environmental
Concern: Cost-Effective Colorimetric Ion Analysis
Zahra Arzani1,*, Hassan Hazarkhani2
1
Office of Teaching and Training, Karaj, Iran 2
Department of Chemistry, Organization for Educational Research and Planning, Tehran, Iran
Abstract
Teaching high school chemistry is a difficult task in developing countries. The materials in laboratories should be cheap and accessible. Moreover, waste recovering systems do not exist in most of these countries. Therefore, it is imperative to instill in students the habit as well as the need to feel responsible for what waste their activities will produce. In this manuscript we explain a method to determine the presence of Fe2+ and Cu2+ ions in unknown solutions with cheap equipment. This can be used to illustrate the Beer–Lambert law and also emphasizes environment protection. Each experiment takes 2 hours of a group.Keywords
Green Chemistry,High School, Introductory Chemistry, Colorimetry, Hands-On Learning1. Introduction
It has been shown that teaching chemistry is not very popular. In fact it could be irrelevant in the eyes of students which find it difficult to learn [1-4]. Therefore, it is essential to combine the teaching of chemistry with experiments that grab students’ attention and excite them about the subject. In third world countries the problem is exacerbated by the need for cheap equipment given low budgets and scarce resources [5]. Furthermore, environment pollution is also a growing concern causing a lot of problems in the world. Thus, school chemical experiments should be arranged in a way that is safer for the environment. Students also should be sensitive to what will be left after these experiments as waste. It is to be hoped that as a result, this will become a habit for their daily activities as well.
In this regards, one of the useful experiment is microfluidic analysis. Microfluidics is the science and technology of systems that process or manipulate small amounts of fluids using channels with dimensions of tens to hundreds of micrometer [6]. Unfortunately this work is not well known among high school teachers. There are reports for different paper-based microfluidic analytical devices
(μPADs) in literature [7-10] but the cheapest and easiest one is recommend by Wang and at al., [11-13] which can be used in high school chemistry laboratories. The main advantage of this method is showing chemistry in real life with simple equipment and using very small amount of
* Corresponding author:
[email protected] (Zahra Arzani) Published online at http://journal.sapub.org/jlce
Copyright © 2017 Scientific & Academic Publishing. All Rights Reserved
compounds.
Colorimeter and determination of ion concentration in unknown samples is one of the popular undergraduate laboratory works in universities. Whereas doing so in high school, requires expensive spectroscopy equipment. Potentially, this can be achieved using a form of colorimetry in which comparisons of depth of color are made by eyeballing without necessarily using a colorimeter [15]. In this method, a set of solutions will be prepared and the color of the unknown tube will be compared with them in order to find which matches best. Kohl et al. [22] used digital images of solutions (food dye, sports drinks, and Iron chloride). Kuntzleman at el. [25] left samples in a cardboard box, allowed light to pass through it, and used a cell phone as the light detector. Moreover, Rice at el. [23] also used a cell phone camera as a simple, low cost experimental technique for teaching molecular diffusion.
We tried to repeat nitrite ion determination with a paper microfluidic device which Wang and et al [11] proposed. However, we encountered two main problems. First, N-(1-naphthyl) - ethylene diamine and p-amino benzene sulfonamide which are used as mixed indicators for the nitrite ion, were not familiar to high school students. Second, preparing these compounds was not so easy. Therefore, we decided to use the method for iron ion determination in an iron tablet.
10 Zahra Arzani et al.: High School Chemistry Activities with an Environmental Concern: Cost-Effective Colorimetric Ion Analysis
first, we wanted to emphasize using minimum amounts of compounds and therefore produce less waste, second; we wanted to explain the importance of iron tablet intake for women.
4,7-diphenyl-1,10-phenanthroline reacts with Fe2+ forming a complex with a deep red color which absorbs light at wavelength 533 nm and can be used to illustrate the Beer–Lambert Law [14]. 4,7-diphenyl-1,10-phenanthroline is not familiar for high school student, therefore the iron (II) in sample and known solutions was converted to iron (III) by potassium permanganate in an acidic solution which then turned into a red color by a potassium thiocyanate solution.
A camera-phone was used as the detector for the assay. In the next experiment, the concentration of an unknown copper (II) ion was determined by a set of known concentrations and their color changes after using an
ammonia solution. Ammonia evaporates after the solution
dries, therefore, instead of a paper microfluidic device, a
simple plastic sheet was used [5]. Again, a camera-phone is used as the detector for this assay. These two experiments are very simple and data collection is fast and easy. It can be done in all high school laboratories.
2. Materials
The unknown sample was an iron tablet which was manufactured by Rouz Darou laboratories in Tehran. A Whatman filter paper was used. Drawing a circle by a permanent marker pen on the filter paper made hydrophobic barriers constraining the reactions in defined areas. A camera–phone was used to capture images of reaction and
the Adobe Photoshop 7.0 ME software was employed to get
the gray values of the detection areas from the collected images.
2.1. Fabrication of the Paper-Based Device
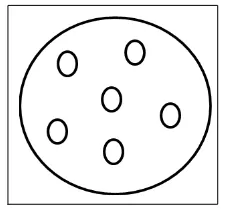
As Wang and et al. recommended, a filter paper (Whatman No.1) was used. This provides a good medium for the colorimetric reaction to take place. Filter papers were placed into a dry glass petri dish in a fume hood; a solution of potassium thiocyanate was poured into the dish to completely soak the papers. The papers were taken out and left in the hood for an hour to become dry. With a permanent marker, six circles were drawn onto the dried filter paper (Figure 1).
Figure 1. Drawing a Pattern in filter paper
2.2. Sample Preparation
Standard solutions with concentrations of 0.020, 0.016, 0.012, 0.008 and 0.004 mol.L-1 were prepared from solid iron (II) sulfate heptahydrate (FeSO4.7H2O M = 278.0146 g /
mole) by dissolving 0.278 g in a 50 mL volumetric flask
(solution A). Students were required to dilute this solution
following the procedures described in table 1 and calculate
the molarity of each test tube. An iron tablet was carefully
weighed and its color peel was removed with a sharp knife. The white tablet was then grinded in a mortar and dissolved into a 50 mL volumetric flask (solution B).
Table 1. Preparing solutions in test tube
Test
2.3. Procedures for Determination of Iron Ions
Using a clean dropper the solution of each test tube with known concentration was carefully dropped onto six outer circles. The same volume of tablet solution was dropped onto the central circle. After a few seconds, an image was captured by a camera phone.
Figure 2. The relationship between percentage of grayscale and iron concentration
2.4. Procedures for Determination of Copper (II) Ions
Standard solutions with concentrations of 0.04, 0.032, 0.024, 0.016 and 0.008 mol.L-1 were prepared from solid copper (II) sulfate pentahydrate (CuSO4.5H2O M = 249.5 g
/ mole) by dissolving 0.249 g in a 25 mL volumetric flask
(solution A). Students were required to dilute this solution
Journal of Laboratory Chemical Education 2017, 5(1): 9-12 11
Table 2. Preparing solutions in watch glasses
No.
Drops of standard
solution A
Drops of distilled water
Drops of unknown
Cu2+ ion
(mol/L)
1 1.0 4.0 0.0 3
8.0 10× −
2 2.0 3.0 0.0 3
16.0 10× −
3 3.0 2.0 0.0 3
24.0 10× −
4 4.0 1.0 0.0 3
32.0 10× −
5 5.0 0.0 0.0 3
40.0 10× −
6 0.0 0.0 5.0 X
Six circles were drawn onto a paper and it was placed under a plastic cover. Two drops of each solution was added to corresponding numbers. (Figure 3).
Figure 3. Drops of solutions on a sheet of plastics
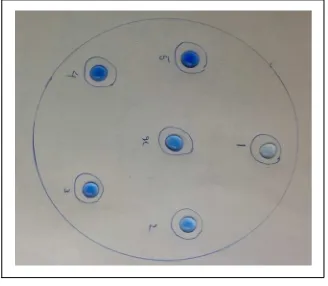
2 drops of Ammonia solution was carefully dropped onto the central each circles. After a few seconds, an image was
captured by a camera phone (figure 4).
Figure 4. Copper solutions with ammonia
3. Results
According to figure 2, the relation between the
concentration of the iron ion and the intensity of the gray color is linear with the correlation coefficient 0.909 and standard error of the estimation 3.5777. The linear equation was expressed as y = 1550x + 38.6 where x represents the iron ion concentration (mol. L-1), and y represents the gray
value (%). By using this data, the concentration of iron ion was found to be 0.017 mol. L-1 in tablet sample, which means there is 47.6 mg Fe2+ in each tablet. The 4.8% difference between the written value in tablet box and the experimentally determined iron ion concentration is readily rationalized given the approximations implicit to this methodology.
The equation for copper ion concentration was expressed as y = 1100x + 38.4 where x represents the copper ion concentration (mol. L-1), and y represents the gray value with the correlation coefficient 0.989 and standard error of the estimation 1.673.
4. Hazards
The potassium thiocyanate solution is toxic and should be used only in a chemical fume hood. It can be absorbed through the skin. Potassium thiocyanate is a skin and eye irritant and is toxic when ingested. Eye contact will cause redness and pain. Skin contact will cause localized irritation. Ingestion will cause headache, nausea, vomiting, dizziness and faintness [16-19].
Potassium permanganate solution can cause skin irritation. Flush with water immediately [20].
5. Conclusions
It is obvious that teaching chemistry with experiments increases enthusiasm and motivation among students. In most high schools in developing countries there are not enough facilities to achieve this goal; therefore in this article we proposed two simple experiments: paper-based microfluidic analytical devices for iron ion detection and plastic sheet instead of microplate for copper ion detection.
All the equipment are simple and easy to use. Furthermore the experiment reduces disposal and students learn more about protecting the environment. Above all, by doing this experiment, as well as teaching chemistry concepts, the importance of iron tablet intake will be explained.
ACKNOWLEDGEMENTS
Special thanks are owed to the principle of the beheshty high school in Karaj for facilitating access to laboratory supplies.
REFERENCES
[1] Holbrook J. Making chemistry teaching relevant, Chemical Education International, 2005, Vol. 6, No. 1,
www.iupac.org/publications/cei
12 Zahra Arzani et al.: High School Chemistry Activities with an Environmental Concern: Cost-Effective Colorimetric Ion Analysis
[3] Carter, C.S.; Brickhouse, M.W. What makes chemistry
difficult? Alternate Perceptions, Journal of Chemical
Education, 1989, 66(3), 223-225.
[4] Nakhleh, M.B. Why some students don’t learn chemistry, Chemical Misconceptions, Journal of Chemical Education, 1992, 69(3), 191-196.
[5] Arzani, Z. Chemical waste management in high school, International Journal of Sustainable Development, 2012, 05:
02, (©Ontario International Development Agency ISSN:
1923-6654 (print). ISSN 1923-6662 (online). Available at http://www.ssrn.com/link/OIDA-Intl-Journal-Sustainable-De v.html
[6] Whitesides, G. M. The Origins and the future of microfluidics.
Nature. 2006, 442 (7101), 368−373.
[7] Martinez, A. W.; Phillips, S. T.; Butte, M. J.; Whitesides, G. M. Patterned paper as a platform for inexpensive, low-volume,
portable bioassays, Angew. Chem., Int. Ed. 2007, 46, pp.
1318–1320.
[8] Lu, Y.; Shi, W. W.; Jiang, L.; Qin, J. H.; Lin, B. C. Rapid prototyping of paper-based microfluidics with wax for low-cost, portable bioassay, Electrophoresis, 2009, 30, pp. 1497-1500.
[9] Li, X.; Tian, J. F.; Nguyen, T.; Shen, W. Paper-based
microfluidic devices by plasma treatment, Analytical
Chemistry, 2008, 23, pp. 9131-9134.
[10] Bruzewicz, D. A.; Reches, M.: Whitesides, G. M. Low-Cost printing of poly(dimethylsiloxane) Barriers To Define
Microchannels in Paper, Analytical Chemistry, 2008, 80, pp.
3387-3392.
[11] Wang, B.; Lin, Z. ; Wang M. Fabrication of a paper-based microfluidic device to readily determine nitrite ion concentration by simple colorimetric assay, J. Chem. Educ. 2015, 92, 733−736 .
[12] Nie, J.; Zhang, Y.; Lin, L.; Zhou, C.; Li, S.; Zhang, L.; Li, J. Low- Cost fabrication of paper-based microfluidic devices by one-step plotting. Anal. Chem. 2012, 84 (15), 6331−6335 http://www.ncbi.nlm.nih.gov/pubmed/22881397
[13] Cain, L.; Wu, Y.; Xu, C.; Chen, Z. A Simple paper-based microfluidic device for the determination of the total amino acid content in a tea leaf extract. J. Chem. Educ. 2013, 90 (2),
232−234.
[14] Housecroft Catherine E.; Constable Edwin C. -Chemistry: an introduction to organic, inorganic, and physical, 4th Edition -Pearson Academic, 2009; page 383.
[15] http://www.nuffieldfoundation.org/practical-chemistry/colori metric-determination-copper-ore- (accessed Aug 2015)
[16] Material Safety Data Sheet, potassium thiocyanate, http://avogadro.chem.iastate.edu/MSDS/KSCN.htm ((accessed Sep 2015)
[17] Potassium thiocyanate,
https://en.wikipedia.org/wiki/Potassium_thiocyanate ((accessed Sep 2015)
[18] http://www.rsc.org/images/loc/2012/pdf/T.5.138.pdf (accessed Oct 2015)
[19] http://www.ihcworld.com/royellis/ABCSafe/chemicals/potas sium-thiocyanate.htm (accessed Sep 2015)
[20] Material Safety Data Sheet, Potassium permanganate, http://avogadro.chem.iastate.edu/MSDS/KMnO4.htm (accessed Sep 2015)
[21] Kohl S. K.; Landmark, J. D.; Stickle, D. F. Demonstration of
Absorbance using color image analysis and colored solutions. J. Chem. Educ. 2006, 83, 644−646 .
[22] Kehoe, E.; Penn, R. L. Introducing colorimetric analysis with
camera phones and digital ameras: An activity for high school
or general chemistry. J. Chem. Educ. 2013, 90, 1191−1195
[23] Rice N. P., Beer M. P. and Williamson M. E., A Simple educational method for the measurement of liquid binary diffusivities
[24] Kuntzleman T.S. and Jacobson E. C., Teaching beer’s law
and absorption spectrophotometry with asmart phone: A
substantially simplified protocol J. Chem. Educ. 2016, 93,