www.elsevier.nl / locate / econbase
Public policy and health insurance choices of the elderly:
evidence from the medicare buy-in program
* Aaron S. Yelowitz
Department of Economics, University of California, Los Angeles, 405 Hilgard Avenue, Los Angeles, CA 90095-1477, USA
Received 1 May 1997; received in revised form 1 September 1999; accepted 1 October 1999
Abstract
This study provides evidence on health insurance decisions of senior citizens. Nearly all senior citizens have health insurance coverage through Medicare, but poor seniors may also qualify for Medicaid that fills many gaps in Medicare coverage. Since 1987, the Medicaid program has expanded eligibility. Using the SIPP, I find that Medicaid eligibility increased from 8.7% in 1987 to 12.4% in 1995. For every 100 elderly who became eligible, approximately 50 took up Medicaid, but more than 30 dropped private coverage, resulting in crowd-out of 60%. Crowd-out came from individuals dropping privately purchased health insurance rather than dropping employer-provided retiree health insurance. The roles of asset tests, health status, and the panel structure of the SIPP are also explored. I find that a major strength of the SIPP is in its point-in-time asset information for determining Medicaid eligibility, while the changing income and demographic information over the course of the 2-year panel adds little insight beyond cross-sectional data. 2000 Elsevier Science S.A. All rights reserved.
Keywords: Medicaid; Medicare; Health insurance; Crowd-out; Aging JEL classification: H51; I11; J14
*Tel.: 11-310-825-5665.
E-mail address: [email protected] (A.S. Yelowitz).
1. Introduction
The US federal government spent more than $352 billion on entitlements for the
1
elderly in 1990. Although 80% of the money went to two programs — Social Security and Medicare — a significant amount was also spent on means-tested welfare programs, such as health insurance through Medicaid, cash assistance through Supplemental Security Income (SSI), food stamps, public housing, and energy assistance. Welfare programs for the elderly do not receive as much attention as those for the young, but combined federal spending on elderly SSI and Medicaid recipients amounted to $11.7 billion in 1990, approximately 54% of the amount spent on cash assistance and health insurance for younger households on
2
AFDC.
An aim of this study is to provide evidence on the economic behavior of senior citizens with respect to the largest of these means-tested programs, Medicaid. Nearly all senior citizens have health insurance coverage through Medicare, but poor seniors may also be eligible for Medicaid, which fills many gaps in Medicare coverage and offers first-dollar coverage. During the past decade, the Medicaid program has undergone a series of changes relating to eligibility. In particular, two new categories of elderly Medicaid recipients, known as Qualified Medicare Beneficiaries (QMBs) and Specified Low-Income Medicare Beneficiaries (SLMBs), were created. The income and asset limits to qualify under these programs were less strict than the limits under existing Medicaid categories, and
3
1.9 million senior citizens were enrolled in the QMB program in 1993. My particular focus will be on two issues relating to the QMB (and SLMB) expansions. First, how much did the QMB expansions increase Medicaid eligibili-ty? The QMB expansions added to an existing and confusing patchwork of Medicaid rules that varied across states — in states where Medicaid was already generous the QMB expansions may not have made many individuals newly eligible. Second, how did increases in Medicaid eligibility affect supplemental insurance coverage? To address this, I estimate the effects of Medicaid eligibility on Medicaid coverage, private insurance coverage, and total supplemental insur-ance coverage.
In addressing these questions, this study makes two primary contributions. The first contribution is adding evidence to the growing literature on government provision of health insurance and crowd-out of private insurance through a conceptually clean example. Although a recent and controversial literature has addressed the magnitude of the effect of Medicaid expansions for pregnant women and children on private insurance coverage, there are two real-world problems associated with the structure of employer-provided health insurance and the timing
1
US House of Representatives, Overview of Entitlement Programs (1993) p. 1564.
2
This amount excludes the cost of nursing homes, which disproportionately benefit the elderly.
3
of Medicaid participation that make crowd-out estimates among the young
4
inherently difficult. First, employer-provided health insurance is usually sold only to individuals or to entire families without gradations among types of dependents. Thus, a family that wants to cover both parents, but not the children (because the children qualify for Medicaid) may find it impossible to do so with only one employer health insurance policy. As Cutler and Gruber (1996a) explain, this lack of distinction may increase or decrease crowd-out compared with the case where a policy covered only individuals, and could conceivably result in crowd-out estimates of more than 100%. Second, the Medicaid expansions for younger groups provide no immediate benefit unless the family uses health care services —
5
thus many families may wait until their child gets sick to enroll. Both Cutler and Gruber (1996a) and Currie and Gruber (1996a) find very low Medicaid take-up rates — for every 100 children made eligible for Medicaid, approximately 25 took it up. If Medicaid take-up is reduced because it provides little immediate benefit, then crowd-out estimates will be overestimated. Both complications mean that the appropriate benchmark for judging the economic importance of crowd-out is not obvious. These two problems are avoided in the context of the elderly. First, the QMB expansions provided immediate benefits because they paid for Medicare premiums (worth $550 per year). Second, the distinction between individuals and families is irrelevant because both elderly family members would be covered by QMB.
The second contribution is data-oriented. To estimate the effects of QMB, I use longitudinal data from the Survey of Income and Program Participation (SIPP) covering the years 1987–1995. The SIPP provides detailed questions on health insurance coverage and the ingredients of Medicaid eligibility including liquid assets, life insurance, the value of the car, and out-of-pocket medical expenses. I use these questions to impute Medicaid eligibility incorporating all the major categories of elderly Medicaid recipients. These additional variables, which are largely unavailable in the Current Population Survey (CPS), make a major difference to the estimates.
The main findings can be summarized as follows. First, Medicaid eligibility increased dramatically, from 8.7% in 1987 to 12.4% in 1995. Second, the expansions for the elderly resulted in dramatically higher Medicaid take-up rates than similar expansions for children. For every 100 elderly who became eligible, approximately 50 took it up. More than 30 elderly dropped private coverage, however, resulting in crowd-out of 60%. Third, crowd-out appears to come from individuals dropping privately purchased health insurance rather than dropping
4
See Cutler and Gruber (1996a–c), Currie (1996), Dubay and Kenney (1996a,b), Shore-Sheppard (1996a,b), and Swartz (1996) for differing methods and magnitudes. It is important to stress that the critiques in this paragraph have nothing to do with the underlying methodology or empirical implementation in the existing studies.
5
employer-provided retiree health insurance. Finally, the wide array of variables in the SIPP topical modules results in much less measurement error for computing Medicaid eligibility than if these variables were ignored. For example, Medicaid take-up results that ignore the Medicaid asset tests are less than half as large. I also find that the short length of the SIPP does not allow for many insights from its panel structure.
The remainder of the paper is arranged into four sections. Section 2 describes the supplemental health care choices facing the elderly. Particular attention is paid to key features of the Medigap and Medicaid policies. The section also presents some basic numbers and magnitudes of Medicaid participation. Section 3 describes the data construction and identification issues. Section 4 presents the results and robustness checks. Section 5 concludes.
2. Health insurance choices of the elderly
2.1. Some background
Health care is an important item in the consumption bundle of the elderly. Approximately 10.5% of the elderly household’s income is devoted to health care
6
expenses, compared to 3.5% for the nonelderly. The average Medicare
expendi-7
ture for elderly was $3900 in 1990. Nearly all elderly are covered by Medicare, but fee-for-service Medicare does not completely pay for health care services. The elderly are subjected to typical insurance provisions: premiums, copayments, and deductibles. They also face some price uncertainty, because physicians may charge the patient up to 15% more than Medicare’s reimbursement rates, a practice known
8
as ‘balanced billing’. In addition, Medicare does not cover the costs of all health care services, such as prescription drugs and nursing homes. Many senior citizens take-up additional coverage through private and public supplemental plans, known as Medigap and Medicaid, respectively, to fill these holes in Medicare coverage.
2.1.1. Description of Medigap
More than 75% of elderly Medicare beneficiaries — about 22 million people — obtain private insurance to help cover out-of-pocket costs. The most common type of Medicare supplemental coverage is an individually purchased Medigap policy. The Medigap market grew steadily between 1988 and 1993, rising from $7.3 to
6
US House of Representatives, Overview of Entitlement Programs (1994, p. 879).
7
US House of Representatives, Overview of Entitlement Programs (1994, p. 874).
8
9
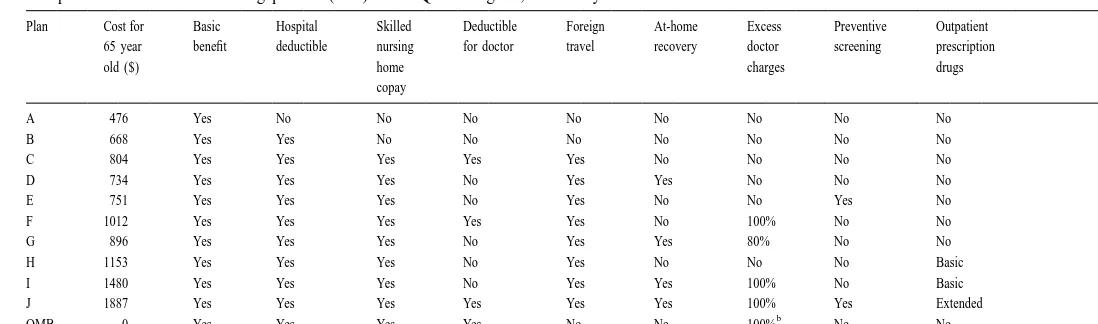
$12.1 billion. Starting in 1992, Medigap policies were required to conform to one of 10 standardized sets of benefits, called Plans A through J. For example, Plan A covers Medicare coinsurance; Plan C covers Medicare coinsurance and inpatient deductibles; and Plan J covers these cost-sharing components and several services not covered by Medicare, such as prescription drugs. Insurance companies are not required to offer all 10 plans, and many do not. Table 1 summarizes the key features of these standardized Medigap plans, and presents the annual premiums for a 65-year-old in 1992. The premiums vary based on the plan’s features — they range from $476 for Plan A, which only covers coinsurance, to $1887 for Plan J, which provides the most comprehensive coverage.
A final feature of Medigap to consider is medical underwriting. During the 6 months after a person turns age 65 and enrolls in Medicare Part B, federal law guarantees the opportunity to purchase any Medigap policy. After that, Medigap insurers may refuse to sell policies because of an applicant’s health history or status, and insurers do exercise this option. In a General Accounting Office survey of the 25 largest Medigap insurers (who represent 65% of Medigap business), 11 used medical underwriting to decide to whom to sell their policies, five sold some policies without checking health histories, and the remaining nine offered their policies without checking applicants’ health history (General Accounting Office, 1996). The largest insurer, Prudential Insurance Company of America, offered seven of the 10 policies without medical underwriting to members of the American Association of Retired Persons (AARP).
2.1.2. Description of Medicaid
Elderly people can receive assistance from Medicaid through several alternate pathways. Medicaid’s benefits vary depending on how the person qualified. The three major ways to qualify are through the QMB, SSI, and medically needy (MN) programs. Although the exact parameters to qualify vary by program, state of residence, and time period, all three programs share certain characteristics. First, all are restricted to elderly who are poor, by having limits on income and assets. The income limits for the various programs range from as low as 27% of the federal poverty line (FPL) to as high as 120% of the FPL. The asset limits range from $2000 to $10,000, and do not include the value of the recipient’s home. Second, each program has some deductions from income (for work expenses, medical expenses, and standard deductions) and has high marginal tax rates on earned and unearned income (usually 50% or higher). Third, collecting Medicaid benefits is an all-or-nothing decision for each program, known as the ‘Medicaid notch’. This means that a household with income higher than the eligibility limit receives nothing, while one with income lower than the limit receives full
9
A
.S
.
Yelowitz
/
Journal
of
Public
Economics
78
(2000
)
301
–
324
Table 1
a
Comparison of standardized Medigap Plans (A–J) to the QMB Program, calendar year 1992
Plan Cost for Basic Hospital Skilled Deductible Foreign At-home Excess Preventive Outpatient 65 year benefit deductible nursing for doctor travel recovery doctor screening prescription
old ($) home charges drugs
copay
A 476 Yes No No No No No No No No
B 668 Yes Yes No No No No No No No
C 804 Yes Yes Yes Yes Yes No No No No
D 734 Yes Yes Yes No Yes Yes No No No
E 751 Yes Yes Yes No Yes No No Yes No
F 1012 Yes Yes Yes Yes Yes No 100% No No
G 896 Yes Yes Yes No Yes Yes 80% No No
H 1153 Yes Yes Yes No Yes No No No Basic
I 1480 Yes Yes Yes No Yes Yes 100% No Basic
J 1887 Yes Yes Yes Yes Yes Yes 100% Yes Extended
b
QMB 0 Yes Yes Yes Yes No No 100% No No
a
Source: Breland (1995).
b
Medicaid services. Finally, each program provides some services or coverage that Medicare does not.
The parts of Medicaid that have undergone the most dramatic changes are the QMB and SLMB programs. The QMB program requires states to pay for Medicare premiums and cost-sharing requirements for poor elderly Medicare beneficiaries, while SLMB requires payment of Medicare premiums only. For QMB, states must pay for Medicare Part A deductibles ($736 per hospital spell in 1995), Part B deductibles ($100 per year), monthly Part B premiums ($46.10 per month), and the 20% coinsurance rate per doctor visit. In addition, physicians are prohibited from charging QMBs more than what Medicare reimburses — that is, they may not practice balanced billing. Finally, a person joining QMB keeps his ‘option value’ on the previous Medigap policy. If he qualifies, he may suspend supplemental Medigap for up to 2 years without paying premiums.
This QMB coverage itself represents a valuable benefit to an elderly individual. In 1993, the national average actuarial value of the QMB program was $950, and the minimum benefit was $439 (the annual Medicare Part B premium for a QMB who received no services during the year). Out-of-pocket costs would be reduced by more than $2300 per year for a beneficiary who has a typical hospitalization
10
and skilled nursing facility stay during the year. Returning to Table 1, the bottom row shows that QMB has many features of the Medigap Plan F policy, which had an annual premium of $1012 in 1992 (and did not pay for monthly Medicare Part B premiums).
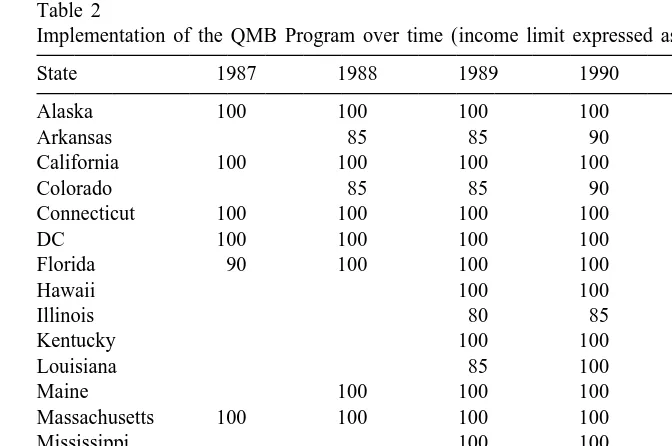
The QMB and SLMB programs were carried out through a series of voluntary state adoptions and federal mandates. Starting in 1987, the states were given additional options to expand Medicaid to the elderly. These changes serve as the primary source of variation in the Medicaid program to identify its importance on health care coverage. The Omnibus Reconciliation Act of 1986 (OBRA) gave states the option to extend Medicaid up to 100% of the poverty line for elderly who qualified for Medicare Part A coverage. Moreover, the asset limit to qualify was $4000 for a single individual and $6000 for a married couple, double the limit of the SSI program. OBRA 1986 also gave states the option to provide full Medicaid benefits (rather than just cost-sharing for Medicare) to elderly who had income below a state-established standard, though few states chose to do this. The Medicare Catastrophic Coverage Act of 1988 (MCCA) made the Medicare buy-in option mandatory, and phased in QMB eligibility over time. In addition, five states (Hawaii, Illinois, North Carolina, Ohio, and Utah) were allowed to phase in the mandate on a different schedule. Finally, OBRA 1990 increased the income limit to 110% of the poverty line in 1993, and to 120% in 1995.
Table 2 documents the QMB income limits (expressed as a percentage of the poverty line) from voluntary state adoptions between 1987 and 1992. Between
10
Table 2
a
Implementation of the QMB Program over time (income limit expressed as percnetage of the FPL)
State 1987 1988 1989 1990 1991 1992
Alaska 100 100 100 100 100 100
Arkansas 85 85 90 100 100
California 100 100 100 100 100 100
Colorado 85 85 90 100 100
Connecticut 100 100 100 100 100 100
DC 100 100 100 100 100 100
Florida 90 100 100 100 100 100
Hawaii 100 100 100 100
Illinois 80 85 95 100
Kentucky 100 100 100 100
Louisiana 85 100 100 100
Maine 100 100 100 100 100
Massachusetts 100 100 100 100 100 100
Mississippi 100 100 100 100
New Jersey 100 100 100 100 100 100
North Carolina 80 85 95 100
Ohio 80 85 95 100
Utah 80 85 95 100
Schedule for all 85 90 100 100
other states
a
Source: Intergovernmental Health Policy Project, various editions.
1987 and 1990, several states carried out the QMB expansions before the federal mandates. These states typically adopted an income limit of 100% of the poverty line and an asset limit ranging from $4000 to $6000. These states included California, the District of Columbia, Florida, Hawaii, Maine, Massachusetts, Mississippi, New Jersey, Pennsylvania, and South Carolina. These voluntary adoptions create additional variation to identify the effect of the Medicaid eligibility.
Another way to qualify for Medicaid is through the SSI program. Elderly people who are poor enough to qualify for cash assistance under the federal SSI program are generally eligible for Medicaid as ‘categorically eligible’ beneficiaries. The link to the federal program provides a nationwide floor on eligibility for the elderly of about 75% of the poverty line for a single individual. Some states supplement the federal SSI payment, however, raising this floor even higher. Assets under SSI are limited to $2000 for a single individual and $3000 for a married couple. Medicaid services for SSI beneficiaries include payment of Medicare premiums, cost-sharing, and additional services covered under state Medicaid programs such as prescription drugs, vision care, and dental care.
another seven it is granted if the recipient completes a second application with the state agency that administers the Medicaid program. In several states, Medicaid eligibility is not automatic. Twelve states, known as Section 209(b) states, have Medicaid requirements that are more restrictive than the SSI requirements, in that they impose more restrictive income or asset requirements or require an additional application.
The final way to qualify for Medicaid is through the MN program. Medically needy individuals have income levels above cash assistance levels (e.g., SSI’s limit), but incur expenses for health care services that exceed a defined level of income and assets. In 29 of the 37 states that offered MN in 1991, elderly people who required nursing home assistance qualified for MN because the high cost of nursing home care depleted their financial resources. The asset limits for MN are usually the same as SSI, though several states have limits that are higher or lower.
2.2. Some preliminary numbers
2.2.1. Changes in Medicaid enrollment and eligibility
There is no individual-level data set that allows me to separately track the three groups of Medicaid beneficiaries described above. To get a sense of the underlying time trends in QMB coverage, and Medicaid participation more generally, I draw upon Medicaid caseload numbers from administrative data for the fiscal years
11
1991–1995. Roughly 3.5–4.0 million elderly (around 12.5% of all elderly) participated in Medicaid. QMB enrollment rose from 655,000 in 1991 to 1,139,000 in 1995, and represented 90% of the growth in elderly Medicaid enrollment. In 1995, there were more QMB beneficiaries than MN beneficiaries, and the size of QMB (in terms of beneficiaries) was around 70% of that of elderly SSI recipients with cash assistance.
I also examined changes in Medicaid eligibility from 1987 to 1995 using the SIPP data described later in Section 3. For each elderly individual in my sample, I imputed eligibility for QMB, SSI, and MN based on his characteristics (e.g., income, assets, medical expenses) and the Medicaid rules in his state. In the SIPP sample, SSI eligibility gradually declined over the period, from 7.7 to 5.1%, while MN eligibility declined from 3.0 to 1.9%. Over the same time, however, QMB and SLMB eligibility rose dramatically, from 1.3% in 1987, to 11.8% in 1995. Since many individuals may qualify for Medicaid under more than one program, the sum of the three does not represent the actual change in Medicaid eligibility. As expected, the rise in Medicaid eligibility was less dramatic than the trends from QMB and SLMB eligibility. From 1987 to 1995, Medicaid eligibility increased
11
nearly 50%, from 8.7 to 12.4% of all elderly. During the same time, Medicaid
12
coverage remained roughly constant, varying from a level of 8.0–8.5%. From the time-series trends, it may be tempting to conclude that the QMB expansions were ineffective at raising Medicaid coverage, but it is important to remember that other national factors such as the Medigap standardization were changing over time, and these other factors could have independent effects on Medicaid participation.
The SIPP panel can be used to examine the dynamics of Medicaid eligibility and enrollment. To do so, I kept individuals in the SIPP who were observed in every interview. Among these individuals, 83.8% were never eligible for Medicaid, and 5.8% were always eligible. Thus, 16.2% of the sample had some exposure to Medicaid eligibility. The fraction that had some exposure to Medicaid eligibility grew over time, from 14.3% of the 1987 SIPP panel, to 17.9% of the 1993 SIPP panel. Medicaid coverage showed little change – 89.6% never participated in Medicaid, while 6.6% always participated. These numbers stay fairly steady across different panels of the SIPP. Finally, only 61.2% had private supplemental health insurance throughout the panel, while 12.5% never had it. Thus, the private health insurance take-up decision may be quite elastic for a sizable minority of the sample.
Finally, I explored the reasons why Medicaid eligibility rose throughout this period. Although the Medicaid expansions play a role, there are other reasons too. For example, as the respondents in the sample get older, their income and family structure may change, which in turn affects eligibility. Ideally, one would like to track the Medicaid rules, demographics, income, assets, medical expenses, and state of residence from 1987 to 1995 for each respondent, and ask what the trends in Medicaid eligibility would look like either holding the Medicaid rules constant,
13
or holding the socioeconomic variables constant. Unfortunately, this precise exercise cannot be done because the SIPP does not follow the respondents for more than 2 years. And it would be extremely unrealistic to make the assumption that family structure, income, assets, and medical expenses were the same for the respondents in 1987 as in 1995.
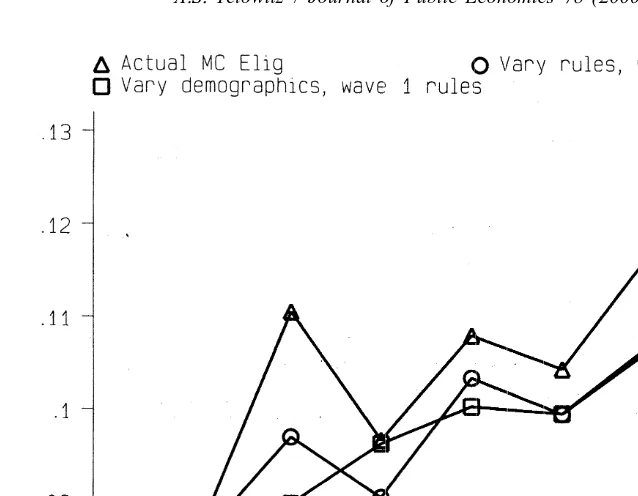
As an alternative, I computed eligibility for the SIPP sample by using the demographic and income characteristics from the first SIPP interview, and then applying the changing Medicaid laws for the remainder of the SIPP interviews for that person. By doing so, the demographics are held constant and the laws are changing. Similarly, I allowed the demographics to evolve over the interviews, and held the Medicaid rules constant. Fig. 1 plots actual Medicaid eligibility for the
12
The reason why the take-up rate is so high in the early years is that imputed Medicaid eligibility is a noisy measure of actual eligibility. Not all of those who report Medicaid coverage are imputed as eligible in the SIPP simulations. In reality, the take-up rate among imputed eligibles is around 48%.
13
Fig. 1. Effects of MC rules and demographics.
2.2.2. Individual transitions to Medicaid coverage
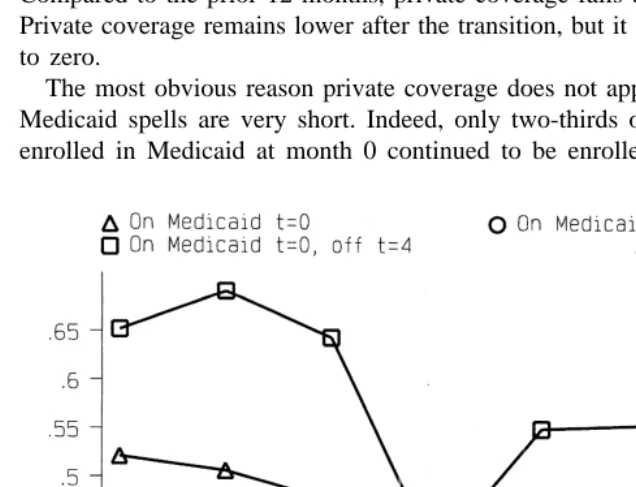
Before moving onto more formal analysis, it may be instructive to examine the evolution of private coverage when a senior citizen moves onto Medicaid coverage. How many had private coverage before Medicaid coverage, and how many drop it? To answer this, I used the longitudinal structure of the SIPP to construct a sample of individuals who enter Medicaid. Overall, 1170 elderly individuals transitioned onto Medicaid. For this sample, I computed private health insurance coverage rates for the 2-year window bracketing the transition. As the line with triangles in Fig. 2 shows, a majority start with private coverage, and that private coverage declines slightly in the 12-month period prior to Medicaid receipt (though the coverage rates at 4, 8, and 12 months before Medicaid receipt are not significantly different from each other). Of course, the private coverage rate before Medicaid enrollment is lower than for the entire sample because those who eventually transition onto Medicaid are more disadvantaged before Medicaid receipt. Private coverage drops off sharply at the time of Medicaid receipt. Compared to the prior 12 months, private coverage falls by 16 percentage points. Private coverage remains lower after the transition, but it does not fall all the way to zero.
The most obvious reason private coverage does not approach zero is that some Medicaid spells are very short. Indeed, only two-thirds of the sample who were enrolled in Medicaid at month 0 continued to be enrolled in month 4. The line
highlighted with circles shows the patterns for elderly who continued to be enrolled in Medicaid at month 4, and line highlighted with squares shows those who were not enrolled at month 4. For both lines, individuals are only included if they were observed at month 4. For individuals who were enrolled in Medicaid in both month 0 and month 4, private coverage again falls off and stays permanently lower. It still does not fall all the way to zero. It remains around 25%. In contrast, the figure shows a dramatically different path for those who were on Medicaid at month 0 and off at month 4. Private coverage drops dramatically, but then bounces back. This bounce suggests that even with medical underwriting, senior citizens still have access to private supplemental plans, at least for short Medicaid spells.
3. Data construction and identification
3.1. SIPP description
For the empirical analysis, I use the Survey of Income and Program Participa-tion (SIPP). Each household in the SIPP is interviewed at 4-month intervals (known as ‘waves’) for approximately 32 months. The SIPP is a panel survey in which a new panel is introduced each year. For the basic analysis on insurance coverage, I use all interviews from the 1987, 1988, 1990, 1991, 1992, and 1993 SIPP panels (the 1989 panel was cut off after only 1 year). The 1987 and 1988 panels began with a sample of 12,500 households. The 1990 through 1993 panels interviewed approximately 14,300, 14,000, 19,600, and 19,890 households, respectively. The SIPP provides information on the economic, demographic, and social situations of surveyed household members. Although the SIPP asks about health insurance coverage and Medicaid eligibility in every month, it is well known that many respondents give the same answer for every month within a 4-month interval. I, therefore, restrict the analysis to the last month within a 4-month interval. I include individuals once they reach the age of 65. I also restrict the sample to households located in the 42 uniquely identified states in the SIPP, because I must impute Medicaid eligibility based on state rules. In addition, I restrict the sample to individuals who provided answers to asset questions in the
14
SIPP topical modules, because I use these to impute eligibility. Finally, I exclude individuals with inconsistent demographic information (e.g., the person’s race, ethnicity, gender or veteran status changes across the SIPP interviews). An appendix with these sample screens can be found in Yelowitz (1997).
The SIPP has several advantages for analyzing welfare programs compared with the Current Population Survey (CPS) in determining Medicaid eligibility. Eligibili-ty is less prone to measurement error in the SIPP because income sources are
14
15
asked monthly rather than annually. In addition, the SIPP topical modules ask questions on liquid assets, automobiles, medical expenses, and life insurance that are used to compute eligibility, while the CPS does not. The asset information, asked once per panel, is important, because many more elderly households than working-age households will be disqualified by asset tests, the group that Cutler and Gruber (1996a) examined. The Census Bureau reports that in 1993, the median net worth for the lowest quintile was $30,400 for elderly households, while it was $970 for households with a head aged 35 to 44. Even excluding home equity, which is not counted in the Medicaid asset tests, these numbers would be $2993 and $499, respectively. Thus, even among the poorest elderly households, the asset test may be binding.
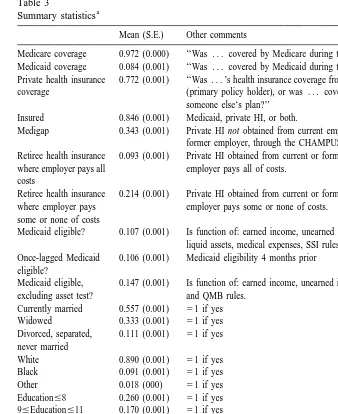
Overall, the sample consists of 200,844 observations on 29,414 individuals. Table 3 presents summary statistics. The first seven rows provide breakdowns of insurance coverage taken at the monthly level, along with the precise definitions of the variables. Most elderly report Medicare coverage. Approximately 8.4% of the elderly have Medicaid coverage. This is lower than the participation rate derived from administrative data (12.5%), because some elderly Medicaid recipients are
16
institutionalized in nursing homes, which the SIPP does not sample. Seventy-seven percent of the sample is covered by some form of private coverage. In total, nearly 85% have supplemental coverage. A small portion of the sample is covered both by Medicaid and private insurance. The next three rows show some sources of private coverage — privately purchased Medigap and employer-provided retiree health insurance. These do not add up to the total amount of private coverage
17
because some individuals are covered under a spouse’s plan. The remainder of the table presents some demographic variables included in the analysis, and some information on income, liquid assets, and medical expenses that go into calculating Medicaid eligibility.
3.2. Identification issues and instrumental variables strategy
The results on insurance coverage are estimated from a linear probability model. The equations to be estimated are of the form:
OUTCOMEi5b 1 b0 1MCELIGijt1b2Xi1b3STATEj1b4DEMOGk
1b5TIMEt1e1i (1)
15
There do not appear to be trends in the measurement error over time. The Medicaid take-up rate among those imputed to be ineligible ranged between 3.3 and 4.0% during the sample period. One cannot reject the hypothesis that these take-up rates are equal in all years.
16
Medicaid provided payments on behalf of 1.4 million nursing home recipients in 1993, who represented 34% of all elderly Medicaid recipients.
17
Table 3
a
Summary statistics
Mean (S.E.) Other comments
Medicare coverage 0.972 (0.000) ‘‘Was . . . covered by Medicare during the month?’’ Medicaid coverage 0.084 (0.001) ‘‘Was . . . covered by Medicaid during the month?’’
Private health insurance 0.772 (0.001) ‘‘Was . . . ’s health insurance coverage from a plan in . . . ’s own name coverage (primary policy holder), or was . . . covered as a family member on
someone else‘s plan?’’ Insured 0.846 (0.001) Medicaid, private HI, or both.
Medigap 0.343 (0.001) Private HI not obtained from current employer or union, through a former employer, through the CHAMPUS or CHAMPVA programs. Retiree health insurance 0.093 (0.001) Private HI obtained from current or former employer or union, where where employer pays all employer pays all of costs.
costs
Retiree health insurance 0.214 (0.001) Private HI obtained from current or former employer or union, where where employer pays employer pays some or none of costs.
some or none of costs
Medicaid eligible? 0.107 (0.001) Is function of: earned income, unearned income, cars, life insurance, liquid assets, medical expenses, SSI rules, MN rules, and QMB rules. Once-lagged Medicaid 0.106 (0.001) Medicaid eligibility 4 months prior
eligible?
Medicaid eligible, 0.147 (0.001) Is function of: earned income, unearned income, SSI rules, MN rules, excluding asset test? and QMB rules.
Currently married 0.557 (0.001) 51 if yes Widowed 0.333 (0.001) 51 if yes Divorced, separated, 0.111 (0.001) 51 if yes never married Education512 0.324 (0.001) 51 if yes Education.12 0.246 (0.001) 51 if yes Hispanic 0.047 (000) 51 if yes Female 0.596 (0.001) 51 if yes Veteran 0.243 (0.001) 51 if yes
Monthly Income / 1000 $1874 (4) Monthly total income expressed in constant 1987 dollars. Liquid Assets $42 343 (204) Annual liquid assets, 1987 dollars.
Medical Expenses $64 (0.27) Monthly out-of-pocket medical expenses, 1987 dollars. Life Insurance $6858 (47) Face value of life insurance policy, 1987 dollars. Age 73.271 (0.013) range5[65,85]
a
Sample consists of 200,844 observations on 29,414 individuals drawn from the 1987–1993 SIPP panels, covering the calendar years 1987–1995. Respondent’s answer taken from fourth reference month of each SIPP panel-wave.
individual was imputed to be eligible for Medicaid under the QMB, SSI, or MN programs. X is a vector of other individual characteristics that may affect health care coverage (such as age and its square, gender, ethnicity, education, and veteran status). STATE is a set of dummy variables indicating the state of residence ( j51,? ? ?,42), DEMOG is a set of dummy variables indicating one of 24 demographic groups, and TIME is a set of dummy variables for calendar year
18
(t51987,? ? ?,1995). Because Medicaid eligibility should increase Medicaid coverage, it is expected that its coefficient will be positive. In addition, Medicaid eligibility may crowd-out private coverage. Unlike previous studies that examined Medicaid expansions for pregnant women and children, the QMB expansions should result in a crowd-out estimate between 0 and 1. Thus, the coefficient on private coverage should be smaller in absolute value than the coefficient on Medicaid coverage.
There are still three problems with the OLS specification, which may bias the coefficient estimates. The first, and arguably the most important, is measurement error in Medicaid eligibility. Although eligibility in the SIPP improves upon measures constructed from other data sets, there is still some room for error — some individuals classified as ineligible do report Medicaid coverage. Moreover, asset holdings or medical expenses may change over time, yet I only observe them once per person over a 2-year period in the SIPP. Measurement error in Medicaid eligibility will presumably bias its coefficient toward zero. The second issue is omitted variable bias. Medicaid eligibility depends on many factors, and Eq. (1) controls for some, but not all, of their interactions. For example, determining Medicaid eligibility involves complex interactions of income, liquid assets, nonliquid assets, and medical expenses. Finally, Medicaid eligibility may be endogenous. For example, some individuals who work beyond the age of 65 will receive health insurance from their employer and enough earnings to make them ineligible for Medicaid. To address each of these concerns, I follow the methods of Cutler and Gruber (1996a) and Currie and Gruber (1996a,b), by creating a simulated measure of Medicaid eligibility as an instrument for individual Medicaid eligibility. In particular, for each calendar year of the SIPP, I divide the sample into 24 groups based on four individual characteristics: married or unmarried, white or nonwhite, completed high school or not, and ages 65 to 69, 70 to 74, and 75-plus. For each of these groups, I compute the fraction of the national sample eligible for Medicaid given a particular state’s rules for QMB, SSI, and MN. Following the notation of Cutler and Gruber (1996a), this simulated measure SIMELIG is simply a given state’s Medicaid rules applied to the national sample.
18
The motivation behind dividing the sample by these exogenous margins is that the instrument should be far less noisy. For example, changes in QMB policy are likely to have a much greater impact on eligibility for older, nonwhite, less-educated widows than on younger, white, more-less-educated married couples.
The first stage is, therefore:
MCELIGijt5u 1 u0 1SIMELIGjtk1u2Xi1u3STATEj1u4DEMOGk
1u5TIMEt1e4i (2)
The construction of the instrument motivates the inclusion of the interaction term, DEMOG. The goal is to learn about the effect of legislative changes in Medicaid eligibility — by including these demographic controls, the variation remaining in SIMELIG that explains MCELIG comes from the interaction of state rules with
19
the demographic variables, rather than from differences in demographics.
4. Results
4.1. Findings on insurance coverage
Although expanding Medicaid eligibility should clearly increase Medicaid participation, the size of the effect is not. As many studies have noted, the take-up
20
rate among eligibles for many means-tested transfer programs is far from 100%. The three most widely accepted explanations for this observation are welfare-stigma, lack of program awareness, and transaction costs. Most studies that examine take-up consider younger populations, and either the Aid to Families with Dependent Children (AFDC) or Food Stamp programs. There are several reasons to think that the take-up problems may be more severe among the elderly, and others to think that it should be less severe. Many low-income senior citizens probably did not participate in welfare programs when they were young and may lack basic transportation and access to services, both of which should decrease take-up. Because of these concerns, the Social Security Administration has conducted outreach efforts. Some states took active efforts to inform QMB recipients about their eligibility, distributing press releases, brochures, and fact sheets, setting up toll-free telephone ‘hot-line’ numbers, and issuing public service announcements. Some private organizations (such as the AARP) also publicized QMB coverage. These efforts could increase take-up. In addition, the expected benefit from participating in Medicaid is much higher for an elderly person than
19
The coefficient on SIMELIG is 0.91 with a standard error of 0.07 in the first stage regression. An analysis of variance shows that 89.9% of the variation in SIMELIG is subsumed by the DEMOG dummies, 1.8% by the STATE dummies, and 1.6% by the TIME dummies.
20
for a younger person, because Medicaid pays for Medicare’s cost-sharing provisions and the elderly person is more likely to be in poor health.
Table 4 presents the results on insurance coverage, in specifications similar to the CPS results of Cutler and Gruber (1996a). In all regressions the standard errors are corrected for repeated observations on the same individual. The standard error correction allows observations that are not independent for a given person
21
(although the error terms must be independent across people). The first three columns present results from the OLS specification, and the final three from the instrumental variables specification. The OLS results show a marginal take-up rate
22
of 36%, and it is very precisely estimated. The demographic variables enter largely as expected: being Hispanic or less educated dramatically increases the likelihood of participating in Medicaid, while being a veteran lowers it. There is little effect of gender or age on Medicaid participation, after other controls are included. The second column presents the effect of Medicaid eligibility on private supplemental coverage. Crowd-out is complete: the propensity to drop private coverage is essentially equal and opposite in sign to that on Medicaid take-up. The third column shows that, on net, supplemental insurance coverage fell.
The instrumental variables estimates, which overcome some problems of the OLS specification, offer similar conclusions but different magnitudes. They show that the coefficient on Medicaid eligibility (particularly in the Medicaid coverage equation) was biased toward zero due to measurement error. The fourth column of Table 4 shows a higher take-up rate, 51%, and a lower propensity to drop private coverage, 31%. This take-up rate of Medicaid for senior citizens is approximately twice as large as the estimates that Currie and Gruber (1996a) and Cutler and Gruber (1996a) find for young children. The estimate of crowd-out, 60%, is similar in magnitude to the estimate of Cutler and Gruber (1996a). On net, the QMB expansions raised insurance coverage among the elderly: for every 100 seniors made eligible, 19 more had supplemental coverage.
In other specifications (not shown), I examined the potential sources of crowd-out. I separated out private coverage into three categories: Medigap policies, retiree health insurance where the employer pays all of the costs, and retiree health
23
insurance where the employee pays some or all of the costs. It is expected that the first of these, Medigap insurance, would be the most likely avenue for crowd-out. There are three reasons for this. First, the senior citizen pays for Medigap himself, while the other categories of private coverage are at least
21
The standard errors in the instrumental variables estimation are similarly corrected, using the methods of Over et al. (1996).
22
When other components of Medicaid eligibility (income, liquid assets, life insurance, and automobiles) are included in the OLS specification, the coefficient and standard error estimates on Medicaid eligibility hardly change.
23
.S
.
Yelowitz
/
Journal
of
Public
Economics
78
(2000
)
301
–
324
319
Effects of the QMB expansions on Medicaid take-up, crowd-out of private health insurance, and overall supplemental insurance coverage
OLS IV
Medicaid Private HI Insured Medicaid Private HI Insured
coverage coverage coverage coverage
Medicaid 0.358 (0.008) 20.367 (0.007) 20.036 (0.007) 0.505 (0.069) 20.307 (0.074) 0.185 (0.072) eligible
Hispanic 0.125 (0.011) 20.204 (0.011) 20.073 (0.011) 0.104 (0.015) 20.212 (0.015) 20.105 (0.015) Female 0.002 (0.004) 0.033 (0.005) 0.031 (0.005) 20.001 (0.004) 0.032 (0.005) 0.028 (0.005) Age 20.001 (0.003) 0.014 (0.004) 0.013 (0.004) 20.001 (0.003) 0.014 (0.004) 0.013 (0.004)
2
Age / 100 0.001 (0.002) 20.011 (0.003) 20.010 (0.003) 0.001 (0.002) 20.011 (0.003) 20.010 (0.003) Veteran 20.023 (0.004) 0.025 (0.006) 0.002 (0.006) 20.018 (0.004) 0.027 (0.006) 0.008 (0.006) 9#Ed#11 20.037 (0.005) 0.089 (0.007) 0.054 (0.006) 20.030 (0.006) 0.093 (0.008) 0.066 (0.007) Ed512 20.156 (0.032) 0.309 (0.035) 0.164 (0.034) 20.104 (0.039) 0.331 (0.044) 0.243 (0.043) Ed.12 20.167 (0.032) 0.350 (0.035) 0.195 (0.034) 20.112 (0.040) 0.372 (0.045) 0.278 (0.044)
2
Adj. R 0.308 0.256 0.061 0.286 0.254 0.031
Mean of 0.084 0.772 0.846 0.084 0.772 0.846
dep. var.
a
partially paid for by the employer. Second, a person who takes up Medicaid through the QMB program can suspend his or her Medigap policy for up to 2 years without facing medical underwriting. Finally, employer plans may cover some services that the 10 standardized Medigap plans and the QMB program do not cover. The instrumental variables estimates bear out this hypothesis. The propensity to drop Medigap coverage is 24%, while the propensity to drop retiree coverage is less than 4% (and not statistically different from zero).
4.2. Conditional coverage, asset tests, and lagged variables
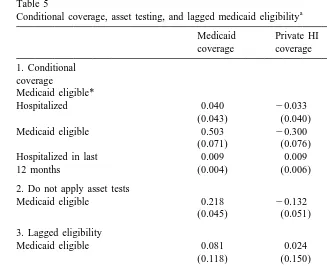
As in other studies of Medicaid, take-up is far less than 100%; at the same time, marginal take-up rates for the elderly are much higher than those for younger populations. Nonetheless, the issue of conditional coverage comes up – as Cutler and Gruber (1996a) first noted, some eligible beneficiaries may not enroll until they get sick. This argument is less plausible for the elderly, however, because the QMB program pays for Medicare Part B premiums – money that the senior citizen would have to pay whether or not he used health care. To further explore this argument, I used information in the SIPP topical module on health care utilization. The argument about conditional coverage implies that senior citizens with high medical expenses would be more likely to take-up Medicaid coverage when eligibility is expanded. Recall that the QMB program would reduce the out-of-pocket costs by more than $2300 per year for a beneficiary who has a typical hospitalization and skilled nursing facility stay (General Accounting Office, 1994). I, therefore, modify Eq. (1) by interacting MCELIG with a dummy variable for whether the person was hospitalized in the past 12 months. In addition, I include the main effects – MCELIG and the hospitalization dummy variable. As was the case for the main results in Table 4, I estimate the model with instrumental variables, using SIMELIG and SIMELIG interacted with the hospitalization dummy as instruments. The results in the first panel of Table 5 provide compelling evidence that the conditional coverage issue is irrelevant. The coefficient on the interaction term is insignificant and small, while the coefficient estimate on MCELIG is virtually the same as in Table 4.
Table 5
a
Conditional coverage, asset testing, and lagged medicaid eligibility
Medicaid Private HI Insured coverage coverage
1. Conditional coverage Medicaid eligible*
Hospitalized 0.040 20.033 0.018
(0.043) (0.040) (0.042)
Medicaid eligible 0.503 20.300 0.188
(0.071) (0.076) (0.074)
Hospitalized in last 0.009 0.009 0.015
12 months (0.004) (0.006) (0.005)
2. Do not apply asset tests
Medicaid eligible 0.218 20.132 0.091
(0.045) (0.051) (0.047)
3. Lagged eligibility
Medicaid eligible 0.081 0.024 0.109
(0.118) (0.150) (0.145)
Once-lagged Medicaid 0.456 20.373 0.079
eligible (0.093) (0.126) (0.121)
4. Lagged coverage
Medicaid eligible 0.083 0.022 0.109
(0.052) (0.143) (0.140)
Once-lagged Medicaid 0.852 20.697 0.148
coverage (0.094) (0.227) (0.222)
a
All models estimated by instrumental variables. Panel 1 consists of 139,292 observations on 27,144 individuals, panel 2 consists of 200,844 observations on 29,414 individuals, and panels 3 and 4 consist of 169,134 observations on 28,537 individuals. The models also include the covariates in Table 4.
final panel, again estimated by instrumental variables, suggests that the short-run response to increases in eligibility is quite small – approximately 8% and statistically insignificant. This might be expected, because of the slow dissemina-tion of informadissemina-tion about QMB.
4.3. Modifying the error structure
Finally, I tried to exploit the panel structure of the SIPP data by estimating models with individual fixed effects, and models with persistence in the error term. Since using the within-person variation is expected to correct many potential sources of bias, the models do not use instrumental variables. The effective sample size falls greatly, however, because only a small fraction of individuals ex-perienced changes in Medicaid eligibility during the 2-year SIPP panel, and it is these individuals who identify the coefficient on MCELIG. The first row of Table 6 presents the Medicaid take-up rate using the fixed effects specification. Although the coefficient is statistically significant, the magnitude is extremely small – approximately one-half of 1%. It is hard to make much sense of this implausibly low take-up rate. Since the coefficient on MCELIG is identified by newly eligible people, this can be interpreted as the take-up in the very first stages of eligibility. In addition, the results on private coverage make low rate on Medicaid take-up even more counterintuitive. Although only 0.5% of respondents take-up Medicaid, more than 4% drop private coverage. The second and third rows use the panel data in another way – by modeling the individual error term as an AR(1) or AR(2) process. As with the individual fixed effects, the coefficient estimates on Medicaid eligibility are implausibly small, and the crowd-out estimates are far greater than 100%.
Table 6
a
Specifications that use dynamic aspects of SIPP data
Coefficient estimates of Medicaid eligibility Medicaid Private HI Insured coverage coverage
1. Individual fixed 0.005 20.041 20.038
effects (0.001) (0.004) (0.004)
2. Error terms AR(1) 0.026 20.177 20.041
process (0.003) (0.005) (0.005)
3. Error terms AR(2) 0.027 20.145 20.040
process (0.003) (0.005) (0.005)
a
5. Conclusions
This study has examined the consequences of Medicaid expansions for the elderly. The primary results show that take-up rates for the expansions were around 50%, but more than half of those who took up Medicaid coverage also dropped private supplemental coverage. These results, then, provide a confirmation in a different setting of Cutler and Gruber’s (1996a) findings on crowd-out for pregnant women and children. Crowd-out was concentrated among the youngest of senior citizens, who are likely to find Medicaid coverage a better substitute for private supplemental coverage, and may be most responsive to different supple-mental options at the time they become eligible for Medicare. Moreover, the wide array of variables in the SIPP data leads to more precise measures of eligibility than one could obtain in the CPS, and better estimates of take-up rates and crowd-out.
Acknowledgements
I thank Jonathan Gruber for helpful discussions and assistance in obtaining some data used in this study. In addition, Janet Currie, David Cutler, Dean Hyslop, Joseph Newhouse, Douglas Staiger, Katherine Swartz, David Wise, Richard Woodbury, two anonymous referees and the editor of this journal, and participants at the NBER Health Economics conference and the Harvard-MIT-BU health seminar provided useful discussion. Gloria Chiang and Geoffrey Rapp provided excellent research assistance. This work was supported by the NBER Health and Aging Fellowship. The data and STATA programs used in this study are available from the author.
References
Blank, R., Card, D., 1991. Recent trends in insured and uninsured unemployment: Is there an explanation? Quarterly Journal of Economics 106, 1157–1189.
Breland, B., 1995. Medigap Regulation: The Case for Federal Intervention. Mimeo, LBJ School of Public Affairs, University of Texas, December.
Currie, J., 1996. Do Children of Immigrants Make Differential Use of Public Health Insurance? NBER working paper no. 5388.
Currie, J., Gruber, J., 1996a. Health insurance eligibility, utilization of medical care, and child health. Quarterly Journal of Economics 111, 431–466.
Currie, J., Gruber, J., 1996b. Saving babies: The efficacy and cost of recent changes in the Medicaid eligibility of pregnant women. Journal of Political Economy 104, 1263–1296.
Cutler, D., Gruber, J., 1996a. Does public insurance crowd out private insurance? Quarterly Journal of Economics 111, 391–430.
Cutler, D., Gruber, J., 1996c. Response to editorial. Inquiry 33, 9.
Dubay, L., Kenney, G., 1996a. Did the Medicaid Expansions for Pregnant Women Crowd Out Private Coverage? Mimeo. Urban Institute.
Dubay, L., Kenney, G., 1996b. Revisiting the issues: The effects of Medicaid expansions on insurance coverage of children. The Future of Children 6, 152–161.
General Accounting Office, 1994. Medicare and Medicaid: Many Eligible People not Enrolled in Qualified Medicare Beneficiary Program. GAO / HEHS-94-52, Report, January.
General Accounting Office, 1995. Medigap Insurance: Insurers’ Compliance with Federal Minimum Loss Ratio Standards, 1988–93, GAO / HEHS-95-151, August.
General Accounting Office, 1996. Medigap Insurance: Alternatives for Medicare Beneficiaries to Avoid Medical Underwriting, GAO / HEHS-96-180, September.
Intergovernmental Health Policy Project, Major Changes in State Medicaid and Indigent Care Programs. In: Lipson, D., Fisher, R., Thomas, C. (Eds.), The George Washington University, various editions.
Moffitt, R., 1983. An economic model of welfare stigma. American Economic Review 73, 1023–1035. Moffitt, R., 1992. Incentive effects of the US welfare system: A review. Journal of Economic Literature
30, 1–61.
Neumann, P., Bernardin, M., Evans, W., Bayer, E., 1995. Participation in the Qualified Medicare Beneficiary program. Health Care Financing Review 17, 169–178.
Over, M., Jolliffe, D., Foster, A., 1996. sg46: Huber correction for two-stage least squares estimates. Stata Technical Bulletin 29, 24–25.
Shore-Sheppard, L., 1996a. Stemming the Tide? The Effect of Expanding Medicaid Eligibility on Health Insurance Coverage. Princeton University Industrial Relations Section Working Paper[361,
April.
Shore-Sheppard, L., 1996b. The Effect of Expanding Medicaid Eligibility on the Distribution of Children’s Health Insurance Coverage. Mimeo. University of Pittsburgh, July.
Swartz, K., 1996. Medicaid crowd out and the inverse Truman bind. Inquiry 33, 5–8.
US Department of Health and Human Services, Medicaid statistics: Program and financial statistics fiscal year 1991. HCFA Pub. No. 02183, January 1993.
US Department of Health and Human Services, Medicaid statistics: Program and financial statistics fiscal year 1992. HCFA Pub. No. 10129, October 1993.
US Department of Health and Human Services, Medicaid statistics: Program and financial statistics fiscal year 1993. HCFA Pub. No. 10129, October 1994.
US Department of Health and Human Services, Medicaid statistics: Program and financial statistics fiscal year 1994. The Health Care Financing Administration, Baltimore, MD.
US Department of Health and Human Services, Medicaid statistics: Program and financial statistics fiscal year 1995. The Health Care Financing Administration, Baltimore, MD.
US House of Representatives, Overview of entitlement programs: Background material and data on programs within the jurisdiction of the committee on ways and means, Washington: Government Printing Office, Various editions.