SECONDARY METABOLITE FROM ENDOPHYTIC FUNGI
Chochlibus lunatus
OF THE
RHIZOME OF TUNJUK LANGIT (Helmynthostachys zaylanica)
Fitrya
1,* and Muharni
2 1Department of Pharmacy, University of Sriwijaya, Jl. Raya Palembang-Prabumulih Km 32, Indralaya, OI, South Sumatera, Indonesia
2
Department of Chemistry, University of Sriwijaya, Jl. Raya Palembang-Prabumulih Km 32, Indralaya, OI, South Sumatera, Indonesia
Received March 20, 2013; Accepted October 28, 2013
ABSTRACT
Helmynthostachys zaylanica which is locally known as tunjuk langit is included Ophioglosaceae genus. The rhizome of tunjuk langit is traditionally used as anticancer. Chochlibolus lunatus was isolated from the tissues of tunjuk langit rhizome. Fungal strain was identified based on the characteristics of its colony and cell morphology. Chochlibolus lunatus was cultured in Potato Dextrose Broth (PDB) medium and it was then extracted using ethylacetate (EtOAc). A secondary metabolite compound was isolated from EtOAc extract. This isolation was done by chromatography technique and the structure of this compound was determined by mean of UV, IR and NMR spectroscopic technique. Isolated compound is like oil. Based on spectra analyses, we concluded that this isolated compound was 11,12,13-trimethylheksyl-2-methylhexa-2,4-dienoat.
Keywords:Helmynthostachys zaylanica; Chochlibolus lunatus; 11,12,13-trimthylhexyl-2-methylhexa-2,4-dienoat
ABSTRAK
Tumbuhan Helmynthostachys zaylanica yang dikenal dengan nama tunjuk langit termasuk kedalam genus Ophioglosaceae. Akar tumbuhan tunjuk langit secara tradisional digunakan sebagai obat antikanker. Jamur endofitik Chochlibolus lunatus telah diisolasi dari jaringan akar Helmynthostachys zaylanica. Strain jamur ini diidentifikasi berdasarkan koloni dan morfologi sel. Chochlibolus lunatus dikultur dalam medium PDB kemudian diekstraksi dengan etilasetat. Dari ekstrak etilasetat telah diisolasi satu senyawa metabolit sekunder. Isolasi dilakukan dengan teknik kromatografi dan penentuan struktur molekul dilakukan dengan metode spektroskopi UV, IR dan NMR. Senyawa hasil isolasi berupa oil. Berdasarkan analisa data spektrum disimpulkan bahwa senyawa hasil isolasi adalah 11,12,13-trimetilheksil-2-metilheksa-2,4-dienoat.
Kata Kunci:Helmynthostachys zaylanica; Chochlibolus lunatus; 11,12,13-trimetill-2-metiheksa-2,4-dienoat
INTRODUCTION
Ophioglosaceae genus is well known to be rich in flavonoid compounds [1]. One species of this genus is
Helmynthostachys zaylanica which is locally known as Tunjuk langit [2]. Chen, et al. and Murakami, et al. reported some flavonoid compounds from the rhizome of
H. zaylanica [3-4]. The research of the bioactivity of H. zaylanica showed that the rhizome of H. zaylanica has aphrodiciac properties, hepatoprotective effect, antioxidant activity, neuroprotective activity and antiinflammatory activity [5-9]. In previous research, we discovered two flavonoids with antioxidant activity from the rhizome of H. zaylanica, one of them reported as flavonoid ugonin J [10].
The use of bioactive compound from natural plants as a drug source is frequently limited by low percentage
Materials
The rhizome of H. zaylanica was collected from Indralaya, Ogan Ilir, South Sumatera. This specimen was identified at Herbarium Bogoriense, Bogor. Materials for this research were N-hexane, ethylacetate, ethanol, silica gel 60 G (70-230 Mesh, Merck), TLC plate with silica gel 60 GF254, 0.25, 20x20 cm (Merck), potato dextrose broth (PDB), potato dextrose agar (PDA), medium for cultivation and isolation endophytic fungi, a series medium for physiologic assay or microbial identification (Czapez Dox Agar (CDA), Malt Extract Agar (MEA) and Potato Dextrose Agar (PDA).
Instrumentation
Instrumentation used in this study included distillation apparatus, rotary evaporator, counter colony, water bath, autoclave, microscope, incubator, NMR JEOL JNM ECA-500 spectrometer 500 MHz (1H) and 125 MHz (13C). UV and IR spectra were measured by using spectrophotometers (i.e., Beckman DU-700 and Shimadzu FTIR 8400) and UV lamp.
Procedure
Isolation of endophytic fungus was done by using a method described by Debbab et al. [15]. The rhizome was rinsed in sterilized water. Surface sterilization was done by immersing the rhizome in 70% ethanol and then aseptically cleaved into small segment. The material was placed on a petri dish containing PDA medium. After several days hyphae growing from the plant material were transferred to other plates which are then incubated for 10 days and periodically checked for culture purity. Fungi produced from incubation were screened to select potential secondary metabolites. The potential fungi were cultivated with optimum condition in PDB medium to produce secondary metabolites. The fungal strain was identified based on the characteristics of their colony and morphology [16].
The secondary metabolite was produced by incubating Chochlibolus lunatus fungus in 4 L liquid medium of PDB till optimum condition (2 months). Separation of filtrate from biomass was done by filtering. Filtrate containing secondary metabolite was extracted using n-hexane (2 x 4 L) and ethylacetate (EtOAc) (2 x 4 L). The quality of organic solvents used in this study is technical grade. Therefore, we needed to
(n-hexane:EtOAc 9:1; 7:3; 3:7; 1:9, EtOAc 100%) to afford 5 fractions F1 – F5.
Structure elucidation
The structure was elucidated using UV, IR, NMR 1-D (1H and 13C-NMR) and NMR 2-D (HMQC and HMBC) spectroscopic data.
RESULT AND DISCUSSION
Four endophyic fungus species isolated from the rhizome of H. zaylanica are FA1-FA4. These fungi were cultivated in liquid medium PDB for two months and then filtered. TLC of EtOAc extract showed that FA1 species was potential to produce a secondary metabolite. Based on the colony and morphology characteristics, this fungus was identified as
Chochlibolus lunatus.
Chochlibolus lunalus was recultivated in 4 L PDB medium for two months. Supernatant was extracted with n–hexane and ethyl acetate. N-hexane and ethyl acetate were evaporated to produce 2 g n-hexane and 2.5 g EtOAc extracts. TLC analysis showed that n-hexane extract was not potential to produce secondary metabolite. Purification of fraction F1 gave a pure compound (1) which was like oil. Structure elucidation was done by spectroscopic technique. The UV spectrum (1 mg/10 mL MeOH) showed maximum
absorption at λmax 273 nm indicating π → π* transition. The IR spectrum (KBr) showed typical absorptions of C-H aliphatic (2958.6, 2922.0 cm-1), carbonyl (1728.1 cm-1), C=C conjugated (1579.6-1463.9 cm-1) and C-O stretch (1272.9 cm-1).
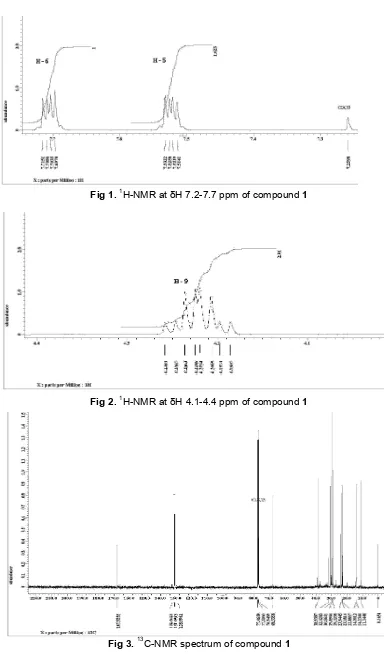
1
H-NMR spectrum of isolated compound (CHCl3-d1) showed two signals for sp2 proton at δH 7.70 ppm (1H, dd, J=3.2 and 5.8) and 7.52 ppm (1H,
dd, J=3.2 and 5.8) which were vicinally coupled each
other (Fig. 1). Signal at δH 4.22 ppm (2H, m) was attributed to methylene proton sp3 attached to electronegative atom, so that the signal appeared at
deshelding area. Signal at δH 1.68 ppm (1H, m) according to methyne sp3 was coupled with four other protons so that the signal appeared as multiplet (Fig. 2).
1
H-NMR spectrum showed signals for proton
characteristic of methyl group at δH 0.89 ppm (3H, d, J=5.7) and 0.92 ppm (3H, d, J=7.5). These signals were vicinally coupled each other. Furthermore, signal
Fig 1.1H-NMR at δH 7.2-7.7 ppm of compound 1
Fig 2.1H-NMR at δH 4.1-4.4 ppm of compound 1
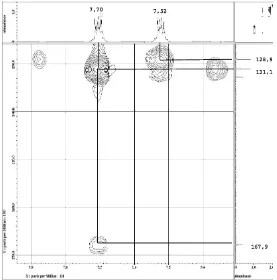
Fig 4. HMQC spectrum of compound 1 at δH 4-8 ppm and δC 70-130 ppm
Fig 5.HMBC spectrum of compound1 at δH 7.4 -7.9 ppm and δC 130-170 ppm
13
C-NMR spectrum (chloroform-d1) showed 17
carbon signals. Signal at δC 167.9 ppm attributed for
carbonyl group is specific for carbonyl of ester or carboxylate. 13C-NMR showed three signals for sp2
carbon at δC 132.7; 131.1; and 128.9 ppm resulted from
double bound having quarterner carbon (Fig. 3).
Furthermore, signal at δC 68.3 ppm is specific for
carbon attached to oxygen and 12 signals at
δC 11-40 ppm were from sp3
O
Table 1.Proton and carbon chemical shift of1H and13C-NMR spectrum of isolated compound (chloroform-d1)
Carbon
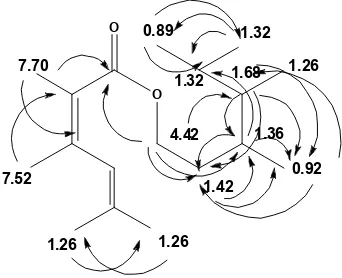
Fig 6.Stucture of isolated compound (A= structure numbering, B= chemical shift of proton and C= chemical shift of carbon)
Fig 7.HMBC correlation of compound1
Analysis of HMQC spectrum showed proton at δH 7.70 ppm attached to carbon at δC 128.9 ppm. HMBC spectrum showed that carbon at δC 128.9 ppm is correlated with carbon at δC 167.9 and 131.1 ppm. Therefore, the proton at δH 7.70 ppm is located closed to carbonyl group (Fig. 4). Proton at δH 7.52 ppm (1H, dd, 3.2; 5.5) attached to carbon at δC 128.9 ppm. Based
on HMBC correlation and its coupling constant (J=3.2)
indicated that these protons are closed each other or these protons are attached to double bond (Fig. 5)
Proton at 4.22 (2H,m) was attached with carbon
at δC 68.3 ppm and HMBC spectrum showed correlation with carbon at δC 167.9; 23.9; 30.6; and 38.9 ppm. Proton at δC 1.68 (1H, m) was attached with
carbon at δC 38.9 and correlated with carbon at δC 23.9; 30.6; and 11.1 ppm. Proton at δH 1.42 ppm (1H, m) was attached with carbon at δC 23.9 and correlated with carbon at δC 30.6 and 11.1 ppm. Based on these
data indicated that both of protons are located closed
to carbon at δC 30.6 ppm. HMQC spectrum showed that carbon was attached to proton at δH 1.36 (1H, m).
Proton at δH 1.32 ppm (1H, m) was attached with
carbon at δC 29.1 and 23.1 and correlated with carbon at δC 14.3; 23.1 and 29.1 ppm, respectively. Based on these data indicated that proton at δH 1.32 ppm was
resulted from methine group and methyl group.
Furthermore, HMQC spectrum showed that
proton at δH 0.89 (3H, d,J=5.8) and 0.92 ppm (3H,d,
Correlation between proton and carbon in HMBC is shown in Fig. 7.
CONCLUSION
The endophytic fungus Chochlibus lunatus was isolated from the tissues of tunjuk langit rhizome. The fungal strain was identified by characteristics of their colony and morphology. A secondary metabolite has been isolated from ethylacetate extract of Chochlibus lunatus. Based on spectroscopic data analysis we concluded that isolated compound is 11,12,13-trimethylhexyll-2-methylhexa-2,4-dienoat.
ACKNOWLEDGEMENT
The authors are grateful to the Herbarium Bogoriense, Bogor, Indonesia for identification of the plant specimen and LIPI Research Center for Chemistry, PUSPITEK, Serpong, Indonesia for spectrum measurement.
REFERENCES
1. Jalil, J., Bidin, A.A., and Chye, T,S., 1986, Phytocemical Study of Ophyoglosaceae Family Species, Proc Malays Biochemistry Society Conference, Fakultas Sains Hayati Universiti Kebangsaan Malaysia, Bangi Malaysia, 12, 160– 164.
2. Heyne, K., 1987, Tumbuhan Berguna Indonesia, Badan Penelitian dan Pengembangan Kehutanan, Yayasan Wahana Sarana Jaya Bogor, p. 1570.
5. Suja, S.R., Latha, P.G, Pushpangadan, P., and Rajasekharan, S., 2002, J. Trop. Med. Plants, 3, 191–195.
6. Suja, S.R, Latha, P.G, Pushpangadan, P., and Rajasekharan, S., 2004,J. Ethnopharmacol.,92, 1, 61–66.
7. Huang, Y-L., Yeh, P-Y., Shen, C., and Chen, C-C., 2003,Phytochemistry, 64, 7, 1277–1283. 8. Lin, Y-C., Huang, Y-C., Chen, S-C., Liaw, C-C.,
Kuo, S-C., Huang, L-J., and Gean, P-W., 2009,
Neurochem. Res., 34, 5, 923–930.
9. Huang, C., Hwang, T-L., Chang, C-S., Yang, Y-L., Shen, C-N., Liao, W-Y., Chen, S-C., and Liaw, C-C., 2009,J. Nat. Prod., 72, 7, 1273-1278.
10. Fitrya, Muharni, and Eliza, 2010, Indo. J. Chem., 10, 2, 226–231.
11. Radji, M., 2005, Majalah Ilmu Kefarmasian, 2, 3, 113–126.
12. Chandrashekhara, Niranjanraj, S., Deepak, S.A., Amruthesh, K.N., Shetty, N.P., and Shetty, H.S. 2007,Asian J. Plant Pathol., 1, 1, 1–11.
13. Hung, P.Q., and Annapurna, K., 2004, Omonrice, 12, 92–101.
14. Hundley, N.J., 2005, Structure Elucidation of Bioactive Compounds Isolated from Endophytes of
Alstonia Scholaris and Acmena Graveolens.
Thesis, Department of Chemistry and
Biochemistry, Brigham Young University.
15. Debbab, A., Aly, A.H., Edrada-Ebel, R.A., Müller, W.E.G., Mosaddak, M., Hakiki, A., Ebel, R., and Proksch, P., 2009,Biotecnol. Agron. Soc. Environ, 13, 2, 229–234.