152
Raising and Maintaing the Market Presence of XYZ
Jessica, Clarissa Nathania
International Business Management Program, Petra Christian University Jl. Siwalankerto 121-131, Surabaya
E-mail: jessicaaiai93@gmail.com, siekclarissanathania@gmail.com
ABSTRACT
With the recent issue, from being only a supporting office to a partner of ABC, that forced XYZ to transform its role and to expand its function. XYZ shall no longer depend on the funds given by other countries; instead they must seek aids from their local citizens. This issue results in the necessities of XYZ to make their mission and ideas known to public. One of the ways to do so is through delivering an effective content marketing in order to gain the brand awareness.
Thus, this research aims to find the most effective content marketing that contributes the highest level of convincement to raise their awareness, by analyzing the responses gathered from 100 respondents using the ordinal regression method. The 100 respondents are sampled using the stratified sampling method. This research found that infographics is the most effective content marketing, the writers also provide the most desired feedbacks by donators in order to maintain their loyalty which is the display of improvement of the people.
Keywords: Non-Profit Organization, Content Marketing, Brand Awareness, and Feedbacks.
ABSTRAK
Dengan munculnya isu baru, dari hanya sebagai cabang pembantu menjadi partner ABC, yang mengharuskan XYZ untuk mengubah perannya dan memperluas fungsinya. XYZ tidak lagi dapat mengharapkan bantuan dari luar negri; sebaliknya mereka diharuskan untuk mencari bantuan dari lokal. Isu ini akan berdampak dalam perlunya XYZ untuk mempublikasikan misi dan ide-ide nya. Salah satu cara untuk melakukannya adalah dengan menyampaikan content marketing yang efektif untuk dapat meningkatkan brand awareness.
Maka dari itu, hasil riset ini bertujuan untuk menemukan informasi iklan yang paling efektif dimana kontribusi dalam aspek kepercayaan atau keyakinan orang lah yang tertinggi, supaya dapat meningkatkan awareness, dengan cara menganalisa jawaban yang di dapat dari 100 responden dengan menggunakan metode regresi ordinal. Responden di dapat dengan menggunakan metode sampling strata. Riset ini menemukan bahwa infografik merupakan jenis isi iklan yang paling efektif, penulis juga melampirkan jenis balasan yang paling di inginkan oleh para donator yaitu bukti peningkatan orang-orang yang di bantu.
Kata Kunci: Organisasi Non-Profit, Konten Pemasaran, Brand Awareness, dan Umpan
Balik.
INTRODUCTION
Market presence or named as market share is a key to profitability, stated precisely in Harvard Business Review (Market Share – A key to Profitability, 1975, January). It is considered as one of the main determinants of business profitability as it relates with return on investment. It is obvious for both profit and not-for-profit businesses to benefit from having a desirable market presence. Profit businesses get their profitability from the income or
return on investment they receive in a certain period of time, while non-profits get their presumed
“profitability” through the amount of funds or
153 This research focuses on the recent change that XYZ, a non-profit organization which concerns on
children’s well-being especially in education and
health, encountered as of the 3rd of February 2014; the
rearrangement of role from a supporting office to a subsidiary. The change itself is followed by several additional duties, which one of them is to search for sponsors and donators by and for themselves. Previously, being a supporting office limits their authority to only allocate the funds given by the subsidiary of ABC in Jakarta to fulfill the missions for Surabaya. Thus, the change of role results on the neediness of XYZ to be independent and requires the organization to start establishing and raising the market presence in order to reach more children in need; considering the high poverty issue for Indonesia. According to The Jakarta post (Handayani, 2012), 50.57% of Indonesians lived below the poverty line of USD 2 per day. Java, as the second most populous island in Indonesia (Indonesia's Most Populous Island Java Continues to Dominate the Economy, 2013), held roughly 60% of the people that lived below the poverty line.
Facing and knowing that the poverty issue in Java is a serious problem, the writers believe that it becomes a necessity for XYZ to widen its functions to be able to contribute more to the society. In addition, raising the market presence requires the organization to communicate to the potential sponsors and donators, who are unaware of the existence of XYZ, regarding their missions, ideas, and goals for the society of Surabaya. In order to do so and make the organization known, XYZ needs to do marketing to promote their values in order to find sponsors for the representative children (the underprivileged children that are chosen to be helped or supported). Delivering the right information to the potential sponsors and donators is one of the considerations for a marketing strategy. Therefore, the writers conducted a research to find out which type(s) of content marketing is convincing or able to make people convinced to participate.
After gaining the market presence it is also equally important to sustain them; to maintain their loyalty towards the organization since the sponsors need to donate monthly and the representative children are sponsored for 10 up to 15 years ahead. So, the organization hopes that the sponsors and donators are loyal enough to keep on committing to the financial dedication made by themselves. It is necessary to continuously ensure the donators and sponsors that the allocation of money does make a difference or is significant; Just like any other business investments, everyone wishes and deserves something in return; even from the non-profits. Thus, the writers also discovered the kind(s) of feedback, which is preferable and desired by the donators and sponsors as something to get in return for their generosity and trust upon the organization.
To sum up, this research aims to find the most convincing type of content marketing to be able to raise the market presence and also aims to find the most desired feedback to provide in order to maintain them.
LITERATURE REVIEW
The first and foremost purpose of this research is to discover the most effective content marketing by
analyzing the impact of people’s likeness of the
content marketing towards the level of convincement they have towards the organization. By communicating their values and missions well, the credibility of XYZ is recognized by the potential donators and sponsors.
People’s convincement
The word convincement in marketing or management theory is not widely used instead they use persuasion to represent how convincing a product is. When a new product is launched, a company must communicate or advertise their product to get the attention of their market and hence the customers are aware of their presence. Thus, in influencing or persuading people, it is obvious that the interaction approach must be there and then, the advertising process takes place (Peter & Olson, 2005). Besides considering an effective marketing media, a company must consider the message delivered in communicating their advertisement. It has to be persuasive not only to get the attention but hoping for the behavior change as the ultimate goal (Myers, 2004); as persuasion is defined by Miller (2002) as
“the process of creating, reinforcing, or changing
people’sbeliefs or actions” (in Dillard & Pfau, 2002).
Persuasion can be stimulated by two kinds of routes; they are the Central Route and the Peripheral Route (Petty & Cacioppo, 1986). When the market is able to think about an issue and able to focus on the argument occurs, they tend to take the central route. So, the strong argument will be persuasive and the weak one will get counter argue since the market does not presume this as a compelling argument. On the other hand, sometimes the strength or significance of the argument does not matter; the motivation is not there or the market does not think carefully to take the message thoughtfully due to recent distraction or a hectic schedule. Therefore, without further analysis on whether the issue is compelling or not, the market may take the peripheral route to persuasion. The organization focuses on signals that trigger impulsive approval without absorbing the message thoroughly. In situation like this, people understand familiar statements more easily and more persuasive rather than original or unusual statements. Such as, “Don't
put all your eggs in one basket” is better than “Don't
risk everything on a single venture” (Howard &
154 peripheral route of persuasion when the customers only able to take brief amount of time, such as billboard or a quick TV commercial; instead of promoting about breakthrough technologies of Nike shoes on a billboard, they promote the shoes through a sophisticated image of the famous basketball athlete, Kobe Bryant. In conclusion, the central route is explicit and reflective and peripheral route is more implicit and automatic through repeated associations (Petty & Brinõl, 2010).
Content Marketing
Running a non-profit organization is no longer depend solely on the good intentions to fulfill its missions, instead they need to market their values and ideas to the potential donators (Kolb, 2008). It is not applied to manipulate people into actions they do not wish to take, but more to communicate the product that the customer already wants. (Kolb, 2008). To do so, marketing techniques need to be adopted, such as using promotion to boost the number of donators and to create effective campaigns (Hanson, 2001).
The writers believe that the content of the promotion itself or known as content marketing is the most mattered and persuasive as it affects the
customers’ final decision. According to a Content
Marketing Director at Monetate (Yoegel, 2012), he and other content marketing experts define content
marketing as “the marketing and business process for
creating and distributing relevant and valuable content to attract, acquire, and engage a clearly defined and understood target audience – with the objective of
driving profitable customer action.” The main
organizations’ reasons in shifting towards content
marketing are mainly about:
3. Shrinking Media Company Budgets Reduce Content Quality. According to a latest discovery: buyers need more information than ever. So, to provide a solution-oriented content is the new requirement.
4. Selling to your customers is becoming more challenging, since customers these days are more informed and educated. Thus, the more informed customers are becoming more challenging to make sales.
5. Technology is both cheap and easy to use.
The drivers are the ability to create sophisticated online publications (Web sites, digital magazines, and e-newsletters), the ability to manage huge amount of data, and the ability to do them with relatively cheap and simple ways.
6. Qualified editorial from a business is more preferable than media companies in making content marketing. Mainly because media
companies care more to advertiser’s
demands that they compromise content, as a result, the reader engagement is low.
As the popularity of content marketing arises, many types as well as combination between types are utilized in promoting products or services. However, despite the abundant techniques; there are fifteen types of content marketing that can be applied by any profit or non-profit organizations (Patel, 2014). They are infographics, a meme, a video, a guide, a book review, an opinion post, a product review, a how-to, a list, a link page, an eBook, a case study, a podcast, an interview, and an original data. The use of those types of content marketing is not limited to choosing one for every advertisement; instead they can be combined freely according to the character of the information itself as long as it does not produce an information overload. Considering the expenses on each and the compatibility of applying them to a non-profit, it turns out that image (meme), list,
infographics, and interview’s type of content
marketing are doable to be implemented by XYZ. Therefore, the writers provide a research-based analysis regarding these four types. In addition, it is happened to be that the current marketing method applied by XYZ is using brand ambassadors (Project Pop, Sydney Mohede, and Saikoji, and etcetera) to help the organization to raise its market presence by participating to many organizational events. Hence, the writers put brand ambassador as an additional type of content marketing in order to find out its
significance towards the people’s convincement. To
conclude, the five types of content marketing that are analyzed in this research are image, list (list of objectives), infographics, brand ambassador, and an
interview (victim’s testimony).
The concepts of this research are regarding content marketing and level of convincement. The relationship between concepts that are going to be investigated in this research is how the likeness towards different types of content marketing influences their level of convincement of the advertisement. The different types of content marketing are expected to give different impacts on
people’s level of convincement. Therefore, the
hyphothesis that are going to be tested in this research is whether there is any significant impact of each type
of content marketing towards people’s level of
155
RESEARCH METHOD
In making a research report, there are four different types of research methods to be analyzed, which are explanatory, descriptive, analytical, and predictive (Cooper & Schindler, 2011). Considering the criteria of each type, this research implements two kinds of research methods; which are descriptive and analytical.
The writers test five different kinds of content marketing in an advertisement and test them based on two variables, which are the likeness of each (acted as the independent variables) and the overall convincement level of the respondents (acted as the dependent variable).
Using ordinal logistic regression allows the writers to get full information of how well the likeness towards each type of content marketing (image, infographics, list of objectives, brand ambassador, and a testimony of a victim) predicts the outcome of being convinced towards the advertisement. Another benefit is also to enable the writers to know how significant the types of content
marketing towards people’s convincement that is
explained by ordinal logistic regression model. In conducting the research, the writers implemented the stratified random sampling as one of the kinds of probability sampling. In Stratified Random Sampling, the researchers have to divide the population into several subpopulations, usually based on their similarities or backgrounds. Then, randomly sampling from each subpopulation according to a independent variables. The minimum sample size for this research generated from this formula is 91 (from (50+ (8*5)). However, the writers decide the sample size of 100 to eliminate the unfairness and a high percentage of confidence level. The writers decide to get 25 respondents for each age category, since the total population for each is unknown and the fact that the older tend to be more generous in giving donations and participating in any kind of social activities.
Before applying the ordinal logistic regression, the writers must make sure that the measurement tool is appropriate (valid) and the measurement tool is able to produce consistent result (reliable). The validity test applied in this research is by comparing the r-value produced from calculating the correlation between the answers resulted from the questions that want to be tested with the r-value generated from the r table with the degree of freedom of n-2 where n is the sample size. The significance level that is going to be
used in this validity test is 5%. The total sample of this research is 100, so for the r-value from the table for n=100-2= 98 with the significance level of 0.05 is 0.197. If the r-value from the calculation is bigger than the r-value gotten from the table and the value is positive, it means that the measurement tool is valid. The writers operated this using SPSS data analysis. To test the reliability of the measurement tools in this research, the writers are going to use the Spearman- Brown Split-Half Method. It works by dividing the given test into halves and then the two halves are going to be scored separately. Then, the score of one half of the test are compared to the score of the other half of the test to see its reliability (Kaplan & Saccuzzo, 2001). To past this reliability test the Spearman-Brown coefficient equal length must be more than 0.8 (Garson, 2009).
To be able to apply ordinal logistics regression, there are four assumption tests, which need to go through (Laerd Ordinal Logistic Regression, 2013, p. 1) made for ordinal logistic regression.
First assumption is that the writers must be certain of the ordinal type of data.
Second assumption is to have at least one independent variable that can be continuous, ordinal, or category; however, any ordinal independent variable must be treated either continuous or categorical.
Third assumption is that there is no multicollinearity, it occurs when there are two or more highly correlated independent variables. The indications of having near- perfect multicollinearity are (Ghozali, 2011) from the tolerance level and Variance Inflation Factor (VIF). Tolerance level measures the variability of the chosen independent variable that is not explained by other independent variables. So, a low level of tolerance level is equal with the high value of VIF, because VIF = 1 / Tolerance. If multicollinearity exists, the tolerance level is lower or equal than 0.10 or the VIF value of more or equal than 10.
The fourth assumption is to have proportional odds; it means each independent variable has an identical effect at each cumulative split of the ordinal dependent variable. So, if the assumption of proportional odds is met, then this means that the difference in model fit (Chi-square column) between the two models to be statistically insignificant or p > 0.05. In contrast, if the assumption of proportional odds is violated, the difference in fit between the two models will be large and statistically significant or p < 0.05. Therefore, if the assumption of having proportional odds is not violated, each of the independent variable can be treated as having the same effect for each cumulative logistic (Laerd Ordinal Logistic Regression, 2013, p. 11).
156 resulted from ordinal logistic regression, which are model fit, goodness of fit test, and pseudo R square
Second is goodness-of-fit, where the table shows
the Pearson’s chi square statistic for the model. The
statistics are intended to test the consistency of the observed data with the fitted model. To make sure that the data and the model predictions are similar, the writers must examine the p value. Thus, if the p value is larger than 0.05, it means the model fits the data well; consequently, the p value of less than 0.05 suggests that the model does not fit very well.
Third is pseudo R Square, is distinguished into
two; which are Cox and Snell’s R Square and
Nagelkerke’s RSquare. Cox and Snell’s R Square is a
measurement that attempts to imitate the size of R
Moreover, the value of Nagelkerke’s R Square can be
interpreted as the value of R Square in the ordinal logistic regression. The writers choose to apply the
Nagelkerke’s R Square since it is widely known that
Cox and Snell’s R Square is the most flexible
technique for any kinds of regression (Allison, 2013). The next thing to be done is forming the ordinal logistic regression model; the regression model can be seen below,
pk = the probability of score ‘k’ occurring
The effect of each independent variable on the probability of the dependent variable occurring can be calculated using the formula of,
� = + ���� � + �� + �
The way the cumulative odds interpreted is that for every increase of 1 unit point in the independent variable in will affect the probability of a certain score of convincement occurring. Another way to interpret the result of the ordinal regression is by looking at the odd ratio that can be calculated from:
Odd ratio = exp (
Odd ratio shows that for each 1 unit increase in the independent variable, will increase or decrease the odds of the dependent variable from occurring.
RESULTS AND DISCUSSION
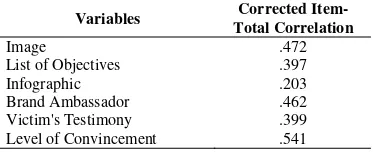
Both results of the validity and reliability test can be seen from the result table of Spearman-Brown Split Half test. The writers compared the r-value from the r table with the calculated r-value. The r-value from the table for N=98 and = . 5 is 0.197. While it can be seen from the table below in the Corrected Item – Total Correlation column that all of the calculated r-value is bigger than 0.197 meaning that all variables passed the validity test.
Table 1. Validity Analysis Result Table
Variables Corrected
Item-The result of the reliability test can be seen from the table below. The Spearman-Brown Equal Length value for the 6 variables (5 independent variables and 1 dependent variable) is 0.802, which is above the limit of 0.08 (Garson, 2009). It means that the measurement tool used in this research is reliable.
Table 2. Reliability Analysis Result Table
Cronbach's Alpha Part 1 Value .301 logistic regression. First assumption is that the writers must be certain of the ordinal type of data. In the questionnaires distributed for the research, the writers only provide one question for each variable. The writers requested the respondents to rate their likeness as well as the level of convincement from 1 to 10 and the gap between these scores is relative for each person and the order is meaningful. Therefore, it is proven that the type of data of this research is ordinal. Second assumption is to have at least one independent variable that can be continuous, ordinal, or category. There are five independent variables in this research and each of these independent variables is ordinal type of data. The writers then decided to treat the ordinal data as a continuous data for the sake of this ordinal regression analysis.
157 tolerance levels are bigger than 0.10 and the VIF value is lower than 10.
Table 3. Multicollinearity Analysis Result Table
Model
Brand Ambassador .662 1.510
Victim's Testimony .858 1.165
From the table above it can be seen that all the odds. The criterion for a model to pass this test is that the parallelism of this model is not significant (sig.>0.05).
Table 4. Parallel Lines Test Result Table
Model
-2 Log
Likelihood Chi-Square Df Sig.
Null Hypothesis 321.430
General 206.379b 115.050c 30 .000
From the table 4, it can be seen that the model
used in this research doesn’t pass the parallelism test.
Some research said that the reason of model violates this test is because there is a continuous variable in the independent variable (Allison, 1999) which in this research all the independent variables are continuous variable. In ordinal logistic regression, the contrasts or violations made in the proportional odds are not always relevant. Instead, it is very likely in any particular application that the proportional odds assumption does not support. Moreover, proportionality in the odds ratios is a property of the
model and not a property of the “real world”. That is
why most researches that use ordinal logistic regression do not test this assumption, even though it is testable (Jones & Sobel, 2000).
Following the validity, reliability, and the assumption tests; the writers then analyze the data using ordinal logistic regression. There are three kinds of analyses resulted from ordinal logistic regression. First is model fit analysis. We can see whether the effect of independent variables significant or not from the significant value of the table. It needs to be less than 0.05.
Table 5. Model Fitting Analysis Result Table
Model -2 Log independent variables have significant effect in predicting the outcome of the dependent variable.
The second analysis is the goodness-of-fit analysis. The criterion for the model to be considered fits is that the p value needs to be larger than 0.05 for both Pearson and Deviance. The result of the analysis can be seen from the table 6, it can be seen that the significant value for both Pearson and Deviance is bigger than 0.05, it means the model used in this research is fitted.
Table 6. Goodness-of-Fit Analysis Result Table Chi-Square Df Sig.
Pearson 694.566 681 .351
Deviance 321.430 681 1.000
The third is the pseudo R Square analysis. From the table 7, it can be seen that the coefficient of
Nagelkerke’s pseudo R Square for this research is 0.362, which indicates that people’s likeness explains 36.2% of the variation of people’s level of
convincement.
Table 7. Pseudo R Square Table Cox and Snell .353
Nagelkerke .362
McFadden .119
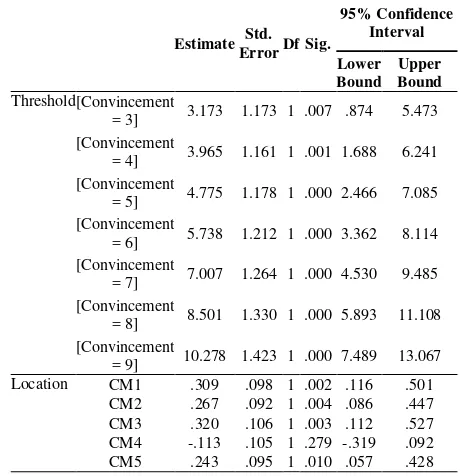
In order to know how big the influence of the independent variables in predicting the outcome of the dependent variables, the writers used the parameter of estimates to interpret the effect of the independent variables.
Table 8. Ordinal Logistic Regression Result Table
158 From the table 8 we can see that the independent variables that has significant effect is images (CM1), list of objectives (CM2), infographics (CM3), and
victim’s testimony (CM5). The independent variable
that has the biggest impact is CM3, which is inforgraphics with the significance level of 0.003 and the coefficient of 0.320. The next thing to do is by looking at the probability and also the odds ratio of the four independent variables that have significant impact. The probability and the odd ratios of the four independent variables that have significant effect can be seen from the tables below,
Table 9. Image Probability Table
aexp( + b1+exp
+ a/b pk-p(k-1) %
p3 32.53 33.53 0.97
p4 71.81 72.81 0.99 0.01609 1.61
p5 161.42 162.42 0.99 0.00758 0.76
p6 422.84 423.84 0.99 0.00380 0.38
p7 1,504.18 1,505.18 0.99 0.00169 0.17
p8 6,700.92 6,701.92 0.99 0.00052 0.05
p9 39,616.46 39,617.46 0.99 0.00012 0.012
From the table 9 it can be concluded that every 1 unit increase in the level of likeness on image will increase the probability of convincement level 4 by 1.61%, convincement level 5 by 0.76%, convincement level 6 by 0.38%, convincement level 7 by 0.17%, convincement level 8 by 0.05%, and convincement level 9 by 0.01%.
Table 10. List of Objectives Probability Table
aexp( + b1+exp
+ a/b pk-p(k-1) %
p3 31.19 32.19 0.97
p4 68.85 69.85 0.98 0.01675 1.67
p5 154.78 155.78 0.99 0.00790 0.78
p6 405.45 406.45 0.99 0.00396 0.39
p7 1,442.31 1,443.31 0.99 0.00177 0.18
p8 6,425.31 6,426.31 0.99 0.00054 0.05
p9 37,987.03 37,988.03 0.99 0.00013 0.013
From the table 10 it can be concluded that every 1 unit increase in the level of likeness on list of objectives will increase the probability of convincement level 4 by 1.67%, convincement level 5 by 0.78%, convincement level 6 by 0.39%, convincement level 7 by 0.18%, convincement level 8 by 0.05%, and convincement level 9 by 0.01%.
Table 11. Inforgraphics Probability Table
aexp( + b1+exp
+ a/b pk-p(k-1) %
p3 32.88 33.88 0.97
p4 72.60 73.60 0.99 0.01593 1.59
p5 163.20 164.20 0.99 0.00750 0.75
p6 427.52 428.53 0.99 0.00376 0.38
p7 1,520.81 1,521.81 0.99 0.00168 0.17
p8 6,775.04 6,776.04 0.99 0.00051 0.05
p9 40,054.65 40,055.65 0.99 0.00012 0.012
From the table 11 it can be concluded that every 1 unit increase in the level of likeness on infographics will increase the probability of convincement level 4 by 1.59%, convincement level 5 by 0.75%, convincement level 6 by 0.38%, convincement level 7 by 0.17%, convincement level 8 by 0.05%, and convincement level 9 by 0.01%.
Table 12. Victim’s Testimony Probability Table
aexp( + b1+exp
+ a/b pk-p(k-1) %
p3 30.45 31.45 0.97
p4 67.22 68.22 0.98 0.01714 1.71
p5 151.11 152.11 0.99 0.00808 0.81
p6 395.84 396.84 0.99 0.00405 0.41
p7 1,408.10 1,409.10 0.99 0.00181 0.18
p8 6,272.94 6,273.94 0.99 0.00055 0.05
p9 37,086.19 37,087.19 0.99 0.00013 0.013
From the table above it can be concluded that every 1 unit increase in the level of likeness on
victim’s testimony will increase the probability of
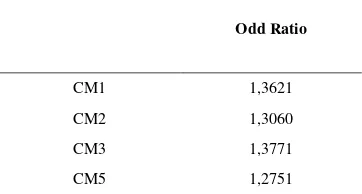
convincement level 4 by 1.71%, convincement level 5 by 0.81%, convincement level 6 by 0.41%, convincement level 7 by 0.18%, convincement level 8 by 0.05%, and convincement level 9 by 0.01%. The odd ratios for each independent variable can be seen from the table below,
Table 13. Odd Ratio
Odd Ratio
CM1 1,3621
CM2 1,3060
CM3 1,3771
CM5 1,2751
The conclusion gathered from the table above is
that for every 1 point increase in people’s likeness of
images (CM1), it increases the odd ratios of the convincement level by 1.36%, for every 1 point
increase in people’s likeness on list of objectives
(CM2) increases the odd ratios of convincement level
by 1.31%, for every 1 point increase in people’s
159 ratios of convincement level by 1.38%, and lastly, for
every 1 point increase in people’s likeness on victim’s
testimony (CM5) will increase the odd ratios of convincement level by 1.27%. From the odd ratio analysis it can be seen that inforgraphics type of
content marketing has the biggest impact on people’s
convincement.
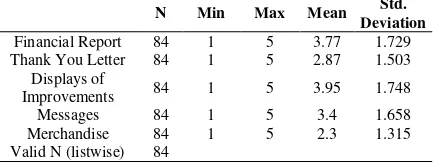
To explain the action needed to make for maintaining the market presence or making the donators and sponsors loyal to the organization, the writers analyze the importance of five doable feedbacks according to the respondents. The respondents distinguished each type of feedback; whether it is very unimportant, unimportant, neutral, important, and very important. The types of feedback, which were being asked are:
1. To get the semiannual financial report of organization.
2. To receive a thank-you letter periodically (according to the funding program followed by the donator).
3. To be sent pictures, videos, or rapport, etc. of improvements (i.e. donating for hunger in Africa; picture of the representative child(s) showing the ideal shape and well-being or activity related to nutrition program). 4. To enable the donator to be in touch with the
representative child by messages (email/letter) through the organization and/or by meeting face to face during certain occasions.
5. To get the organizational merchandise to acknowledge the participation in helping the society.
Besides, it turned out that 84 out of 100 respondents demand feedbacks. The result received from the questionnaire is,
Looking from the mean of the data resulted from the questionnaires; the highest one is 3.92, which is the displays of improvements. The lowest mean is the merchandise variable.
CONCLUSION
From the analysis using ordinal logistic regression, it can be seen that infographics has the
biggest impacts towards people’s level of convincement therefore it’s the most effective type of
content marketing. Second to infographics is the use changes occurring in people’s level of convincement.
Another finding is regarding the desired feedbacks, which the donators get in return for the support, in order to maintain the relationship between the organization and its sponsors or donators. And it appeared that the most preferred feedback is a display (picture, rapport, or other) presenting the upturn of their generosity towards the related cause. For example, if the donator is donating for a child, whose house had just gone down due to a natural disaster, the organization can send the donator a picture of the child in front of his/ her new house so that the donators are aware of the meaningful investment they have made and may encourage them to support more. With these two research-based discoveries, the organization may gain the market presence especially
in Surabaya as well as to maintain the donators’
loyalty.
Hence, these findings result two main recommendation for XYZ, which are:
1. Based on a research on 100 Surabaya citizens, it indicates that infographics type of content marketing contributes the highest impact on the convincement to donate. In addition, the second most effective is the image type of content marketing. Nevertheless, it is better to match the content marketing with the chosen promotion media; putting an infographics type of content marketing on a billboard is inappropriate since it takes several minutes to digest, whereas an image type of content marketing is more suitable since it only takes several seconds to digest.
2. After gaining many sponsors or donators, the next important thing to do is to sustain them. The writers provides five doable feedbacks that can be realized by XYZ; it shows that the respondents like an evidence showing the display of the upturn towards related cause compared to the other kinds of feedback. The proof of the well being gives values to the potential donators, which shows the worthiness of their support.
160 some alteration it might be useful to other types of organization or companies.
Second limitation is about the parameter of this research. The parameter of the independent variables in this research is only in the vicinity of content marketing. While as a matter of fact there are a lot of other factors that have potential contribution in
people’s level of convincement. This was proven
from the Nagelkerke’s pseudo Rsquare, which is
36.2%, which means there are other factors that
explain the other 63.8% of peoples’ level of
convincement. Therefore to understand deeper about
what really affect people’s level of convincement
analyzing other factors are also necessary. Fourth limitation is the depth of this research, the level of convincement of the respondents in this research were only measured by their overall likeness on the each type of content marketing, while actually things like the design, the color, and the promotion media can have impacts on the effectiveness of the marketing as well.
REFERENCES
Allison, P. (2013). What's the Best R-Squared for Logistic Regression | Statistical Horizons. Statisticalhorizons.com. Retrieved 17 June
2014, from
http://www.statisticalhorizons.com/r2logistic Buzell, R., Gale, B., & Sultan, R. (1975). Market
Share-A key to Profitability. Harvard Business Review. Retrieved from http://hbr.org/1975/01/market-share-a-key-to-profitability/ar/1
Cohen, T. (2001). Charity surge: Giving grows, fewer household give. Philanthrophy Journal. Collis, J., & Hussey, R. (2003). Business research
(1st ed.). Houndmills, Basingstoke, Hampshire: Palgrave Macmillan.
Cooper, D., & Schindler, P. (2011). Business research methods (1st ed.). New York: McGraw-statistics books (1st ed.). Asheboro: Statistical Associates Publishers.
Ghozali, I. (2011). Aplikasi Analisis Multivariate dengan Program IBM SPSS 19 (5th ed.). Semarang: Badan Penerbit Universitas Diponegoro.
Handayani, I. (2012, February 13). Beyond statistics of poverty. The Jakarta Post. Retrieved from http://www.thejakartapost.com/
Hanson, J. (2001). Breaking the cycle of marketing disinvestment: using market research to build organizational alliances. International Journal of Nonprofit And Voluntary Sector Marketing, message processing and persuasion: The role of information availability and the elicitation of judgment. Journal Of Experimental Social Psychology, 26(3), 217--239.
Howard, J., & Sheth, J. (1969). The theory of buyer behavior (1st ed.). New York: J. Wiley.
Indonesia's Most Populous Island Java Continues to Dominate the Economy. (2013). Retrieved from
http://www.indonesia-
investments.com/news/todays- headlines/indonesias-most-populous-island-of-
java-continues-to-dominate-the-economy/item972
Jacoby, J., & Olson, J. (1985). Perceived quality (1st ed.). Lexington, Mass.: LexingtonBooks. Jones, B., & Sobel, M. (2000). Modeling direction
and intensity in semantically balanced ordinal scales: An assessment of congressional incumbent approval. American Journal Of Political Science, 176-177.
Kaplan, R., & Saccuzzo, D. (2001). Psychological testing (2nd ed.). Pacific Grove, CA: Brooks/Cole Pub. Co.
Kolb, B. (2008). Marketing research for non-profit, community and creative organizations (1st ed.). Amsterdam: Elsevier Butterworth-Heinemann. Laerd Ordinal Logistic Regression. (n.d.). Retrieved
18 June 2014, from
https://statistics.laerd.com/premium/olr/ordinal-logistic-regression-in-spss-18.php
Le M, D. (2013). Content Marketing. Retrieved from https://publications.theseus.fi/bitstream/handle/ 10024/62104/Duc_LE.pdf?sequence=1
Levie, W., & Lentz, R. (1982). Effects of text illustrations: A review of research. Educational Communications and Technology Journal (ECTJ), 30(4), 195--232.
Patel, N. (2014). 15 Types of Content That Will Drive You More Traffic. Quick Sprout. Retrieved 12
June 2014, from
http://www.quicksprout.com/2014/04/14/how- these-15-types-of-content-will-drive-you-more-traffic/
Peter, J., & Olson, J. (2005). Consumer behavior and marketing strategy (1st ed.). New York: McGraw-Hill.
161 change: Implications for implicit measures. Handbook Of Implicit Social Cognition: Measurement, Theory, And Applications, 335--52.
Petty, R., & Cacioppo, J. (1986). Communication and persuasion (1st ed.). New York: Springer-Verlag.
Phelan, C., & Wren, J. (2006). Reliability and Validity. Uni.edu. Retrieved 7 May 2014, from http://www.uni.edu/chfasoa/reliabilityandvalidit y.htm
Phillip J. Holcomb, J. (2006). On the Time Course of Visual Word Recognition: An Event-related Potential Investigation using Masked Repetition Priming. Journal of Cognitive Neuroscience,
18(10), 1631.
doi:10.1162/jocn.2006.18.10.1631
Rayner, K. (1998). Eye movements in reading and information processing: 20 years of research, Psychological Bulletin 134 (3): 372–422. Rosenthal, R., & Rosnow, R. (1991). Essentials of
behavioral research (1st ed.). New York [etc.]: McGraw-Hill.
VanVoorhis, C., & Morgan, B. (2007). Understanding power and rules of thumb for determining sample sizes. Tutorials In Quantitative Methods For Psychology, 3(2), 43--50.