Michèle Belot is at the University of Edinburgh (Michele.Belot@ed.ac.uk). Marco Francesconi is at the University of Essex (mfranc@essex.ac.uk) and research associate at the Institute for Fiscal Studies. They are grateful to two anonymous referees, Gary Becker, Maristella Botticini, Martin Browning, Ken Burdett, Pierre- André Chiappori, Melvyn Coles, Aureo de Paula, Paul Eastwick, John Ermisch, Eli Finkel, Chris Flinn, James Heckman, Alison Lenton, Shelly Lundberg, Pedro Mira, Michele Pellizzari, Motty Perry, Robert Pollak, Aloysius Siow, and seminar participants at Amsterdam, CEMFI (Madrid), Chicago, Essex, IZA (Bonn), LSE, Milan, Oxford, Southampton, Swansea, Tilburg, Turin, and Warwick for suggestions and comments. The authors would like to thank the speed- dating agency personnel for providing and helping us with the data, and Aikaterini Dimika and Domenico Tabasso for excellent research assistance. Marco Francesconi also thanks the ESRC Centre for the Microeconomic Analysis of Public Policy at IFS and the ESRC Centre for Micro- social Change at Essex. The authors take responsibility for all errors.
[Submitted May 2011; accepted June 2012]
SSN 022 166X E ISSN 1548 8004 8 2013 2 by the Board of Regents of the University of Wisconsin System
T H E J O U R N A L O F H U M A N R E S O U R C E S • 48 • 2
Meeting Opportunities in Mate
Choice Decisions
Michèle Belot
Marco Francesconi
A B S T R A C T
Much empirical evidence shows that female and male partners look alike along a variety of attributes. It is, however, unclear how this positive sorting comes about because marriage is an equilibrium outcome arising from a process that entails searching, meeting, and choosing one another. This study takes advantage of unique data to shed light on the forces driving choices at the earliest stage of a relationship. Both women and men value physical attributes, such as age and weight, and reveal that their dating choices are assortative along several traits. Importantly, meeting opportunities have a substantial role in determining dating proposals.
I. Introduction
this pattern of positive marital sorting is challenging because marriage is an equilib-rium outcome arising from a process that entails searching, meeting, and choosing one another.
In a frictionless world, positive sorting may arise simply as a result of individual preferences or technological complementarities in the marital production function (Gale and Shapley 1962; Becker 1981). For instance, positive sorting can be consis-tent with aligned or “agreed- upon” preferences (whereby everyone values the same attributes) as well as with assortative or “likes- attract” preferences (whereby people prefer partners who are similar to themselves).
Search frictions, on the other hand, may lead to positive sorting through alternative mechanisms. In particular, matches could be determined by who meets whom, who proposes to whom, and who searches where. The fi rst force, who meets whom, implies that meeting opportunities play a key role in the matching process. There is evidence that people tend to meet individuals who are like themselves (Kalmijn and Flap 2001) and this alone could lead to positive sorting. Even in an environment where everyone can potentially meet everyone else, search frictions, combined with aligned prefer-ences on the partner’s type, give rise to positive sorting. As shown in Burdett and Coles (1997), a class structure will emerge in equilibrium, whereby the optimal strategy is to propose to and accept proposals from potential partners only in a fi xed type interval.1
Disentangling all such different channels empirically is challenging, as it is to identify whether mating preferences are aligned or assortative. A major problem is that analysts only observe “fi nal matches” (that is, marriages and cohabitations), but seldom observe the whole pool of potential partners, nor do they have information on the process of proposals and rejections that prelude the formation of a relationship. As a result, we are typically unable to unravel the separate infl uence of the forces that underlie this union formation.2 A few recent studies, however, shed light on the
importance of such mechanisms by examining dating choices (for example, Kurzban and Weeden 2005; Todd et al. 2007).
This paper contributes to that new growing literature by using unique data from a large commercial speed- dating agency in Britain, and makes two substantive contribu-tions. First, we provide direct evidence on the nature of the choices underlying mate selection. Second, we assess the importance of meeting opportunities relative to that of other forces driving dating choices (such as preferences for partners with certain attributes) in explaining the observed patterns in dating behavior. Both contributions rely on the fact that we use a large sample of speed daters who have a more diverse set of attributes than those analyzed in earlier studies. This in itself allows us to focus on an extensive set of dyadic interactions and analyze individual patterns of mate choices over several personal characteristics and over many events with a wide variation in the composition of the pool of participants across events.
As in earlier speed- dating studies, dating preferences can be recovered under the
as-1. If individuals can choose not only who to propose to and whom to accept proposals from, but also where they search (and therefore who they are likely to meet), then segmentation will emerge in equilibrium—that is, the marriage market will be segmented in a number of submarkets organized around classes of types (Jacquet and Tan 2007).
sumption that speed daters engage in straightforward behavior (Fisman et al. 2006)— that is, if whenever a participant proposes to one individual but does not to another, then the fl ow utility value that the participant receives from the former is greater than the corresponding value obtained from the latter. Given straightforward dating behav-ior, the speed- dating protocol offers considerable advantages in comparison to other nonexperimental settings. First, it shares some of the key useful features of an experi-mental setup. Subjects meet a large number of potential partners in a sequence of short dates that are always organized in the same way: participants meet in pairs (a man and a woman), sit at a table, and chat for three minutes. This is a compelling example of a naturally occurring market as in other fi eld studies (for example, Harrison and List 2004, 2008). Subjects’ choices in these speed- dating sessions constitute real behavior with actual consequences.
Second, matches are formed via a fully anonymized central process, whereby participants report who they wish to meet again to the dating agency and have no limit to the number of proposals they can make. The agency, in turn, exchanges con-tact details only between participants who have proposed to each other. This setting therefore offers us detailed information on the dyadic choices made by each party as well as whether they form a match or not, enabling us to analyze the determinants of mate choices and to underpin the process through which matches are formed. Third, mate choices in this context are made at the earliest stage of a union—that is, after a fi rst meeting. Since social mixing only can be achieved if people choose to engage further with each other after a fi rst encounter, these early choices are crucial for our understanding of the formation of long- term partnerships.
Finally, subjects meet before they choose. This differs from studies of other forms of mediated dating, such as small ads (Lynn and Shurgot 1984) or online dating (Hitsch, Hortaçsu, and Ariely 2010; Finkel et al. 2012), where people choose whom to meet fi rst and, only after, they possibly meet. This process of selection is likely to be driven by the information available to the parties before they meet, which may tend to exaggerate the role of certain attributes in the dating / mating market. Speed daters, in contrast, interact shortly with each other before they decide to propose or not, and have therefore more information at their disposal. There is a bulk of psychological evidence demonstrating that people make sophisticated social judgements (from mate choice to consumer choice) based on “thin slices” of social observations or very short interactions (for example, Ambady and Rosenthal 1992; Miller and Todd 1998; Finkel, Eastwick, and Matthews 2007; Finkel and Eastwick 2008; Iyengar 2009). These short interactions could therefore change the weight given to certain attributes.
We use data from 84 events, and in each of these events, we observe participants (approximately 22 men and 22 women in each event) who face exactly the same pool of potential partners (that is, the same choice set), and we observe their choices within this choice set. In addition, the real- life nature of our data is important for us to iden-tify the role played by socioeconomic attributes: Not only is the sample of participants large, but crucially it is also much more diverse than that used in other speed- dating studies (for example, Fisman et al. 2006 and 2008).
which gather individuals from all walks of life with ample variation in age, socioeco-nomic position, and physical attributes. In Section III, we will provide detailed infor-mation on our sample and discuss further the issues of its statistical representativeness and misreporting.
Our analysis yields three main fi ndings. First, both women and men value easily observable physical attributes: Women prefer men who are young and tall, while men are more attracted to women who are young and thin. We also fi nd that partner’s edu-cation and occupation have an impact on desirability, irrespective of gender. Second, there is evidence of mild positive assortative preferences (rather than agreed- upon preferences) along a number of characteristics, with both women and men preferring partners of similar age, height, and education. Third, the impact of dating preferences is limited with meeting opportunities playing a more dominant role. This result em-phasizes the notion that mating requires meeting: The pool of potential partners shapes the type of people whom subjects propose to and, ultimately, with whom they form durable relationships.
The rest of the paper is organized as follows. Section II discusses the related lit-erature. Section III introduces the speed- dating protocol and describes our data. In Section IV, we discuss our main fi ndings on attribute demands. The aim is to identify the determinants of mate choice and to establish whether, even at this early stage, a pattern of positive sorting emerges. Section V presents a picture of the patterns of dating proposals observed in the aggregate in each speed- dating session, providing us with evidence on the importance of meeting opportunities. In particular, we analyze how the relative abundance of specifi c attributes in a given market, as opposed to market homogeneity, affects mate selection. Section VI looks at dating matches—that is, cases in which individuals propose to each other. Section VII discusses our main fi ndings emphasizing caveats and interpretations, and Section VIII concludes.
II. Related Literature
Early studies on human mating date back to Westermarck (1903) and Hamilton (1912). The economics literature, which has grown out of Becker’s (1973; 1974; 1981) seminal work, has produced search and matching models that can gener-ate wide arrays of sorting (for example, Lam 1988; Burdett and Coles 1997; Shimer and Smith 2000; Teulings and Gautier 2004; Choo and Siow 2006; Smith 2006; Chiappori, Iyigun, and Weiss 2009; Gautier, Svarer, and Teulings 2010; Coles and Francesconi 2011). The focus of most of these studies, however, is different from ours, as they characterize the conditions under which positive assortative matching arises and explain why matching is assortative. They pursue this goal in a variety of ways by, for example, imposing payoff supermodularity and transferable utilities between part-ners, or allowing for frictions in the matching process with nontransferable utilities, or modeling a household production function with spousal trait complementarities.
leads to mutual confi rmation of each other’s behavior and lifestyle (Kalmijn 1994). A natural implication of this “likes- attract” mechanism is positive marital sorting. Others claim that mate preferences are shared across all individuals and primarily refl ect traits that are evolutionarily advantageous (Trivers 1972; Buss 2003). People compete with others to search for mates with valuable resources. The result of this competition is that the most attractive candidates select amongst themselves while the least attrac-tive must rely on one another. Competition for key resources on the marriage market, therefore, leads again to an aggregate pattern of positive assortative mating.
A small but burgeoning number of recent studies have analyzed mate selection taking advantage of the experimental setting of speed dating. Kurzban and Weeden (2005) use data from HurryDate, a large dating company operating in major metro-politan areas in the United States, to investigate the choices that approximately 2,600 subjects make in dating partners. Their main estimates show that female and male subjects have strong agreed- upon preferences rather than assortative preferences: They are equally attracted by physically observable attributes like weight, height, and age, and much less so by other attributes such as education and religion. They also report evidence of small positive assortative patterns along race and height.3
Within the economics literature, Fisman et al. (2006) base their experimental de-sign on the HurryDate format to analyze a sample of about 400 students at Columbia University, with the objective of identifying gender differences in dating preferences. Their results slightly differ from those found by Kurzban and Weeden (2005). Only men exhibit a preference for physical attractiveness while women respond more to intelligence and race. They fi nd some evidence of positive sorting, with male subjects valuing women’s intelligence or ambition only if it does not exceed their own. They also document the importance of group size, whereby women (but not men) become more selective in larger meetings.4
Hitsch, Hortaçsu, and Ariely (2010) follow a different approach. They use data from a large sample of users of an online dating service in Boston and San Diego to see how individual traits affect the likelihoods of having a personal profi le browsed, being contacted, and exchanging contact information via e- mail. Although online daters do not physically meet, this study confi rms some of the previous evidence based on speed dating and fi nal match data. For example, in line with the results discussed in Fisman et al. (2006), Hitsch and colleagues fi nd that women put more weight on a partner’s income than men do and, consistent with Fisman et al. (2008), women have a more pronounced preference to form a match with men of their own ethnicity. Lee (2009) also uses data from an online dating service in Korea. Her analysis compares sorting as observed in the general population to the simulated sorting that arises among dat-ers. She fi nds more sorting along age and less sorting along socioeconomic attributes among daters than among individuals in the general population.
Finally, the paper by Nielsen and Svarer (2009) is, to our knowledge, the only study that explicitly examines the extent to which opportunities in the marriage market infl u-ence the tendency of individuals to marry someone who went to the same educational
3. Other contributions in the speed- dating literature include Todd et al. (2007) and Eastwick and Finkel (2008).
institution or to an institution near them. Using Danish administrative data on fi nal matches, they fi nd that about half of the systematic sorting on education can be ex-plained by that tendency. They attribute this fi nding to low search frictions or selection of people with similar preferences into the same institutions—that is, proximity to partners, which is arguably an important component of matching opportunities.5
III. Data and Selection Issues
A. The Speed- Dating ProtocolSpeed dating offers single individuals the opportunity to meet a large number of po-tential mates over a short predetermined period of time. We use data from one of the biggest U.K. private agencies. Participants register for an event that takes place in a specifi c location during the evening in a bar or club. Participants pay a fi xed fee, which varies with location and occasional discounts. There is no specifi ed maximum number of women and men who can participate in each session, although there are rarely more than 30 women and 30 men. Events are stratifi ed by age (23–35 and 35–50 are typical age ranges) so that individuals of roughly the same ages participate in the same ses-sion. Bookings are made on the Internet or, less frequently, by phone. Individuals can book for an event as long as there are enough places available. The agency does not screen participants, nor does it intervene in the allocation of participants across events. Participants simply select a location and time.
In general, participants arrive for the event and, at registration, are given a starting table number, a label tag with a fi lm star alias, and a pen and a card to indicate the alias of the people they wish to meet again (we shall refer to this choice as a proposal). The evening proceeds as follows. People sit at the assigned table, with women usually stay-ing seated at the same table and men movstay-ing around. Each date lasts for three minutes. After a date, men move to the next table, and a new date begins. After eight individual dates the session stops and participants can move around before another round of eight three- minute dates starts. A typical evening consists of three such rounds, after which participants leave. Speed daters communicate their proposals to the agency after the event. There is no limit to the number of proposals subjects can make from the pool of participants. In fact, each individual can be matched more than once. The agency collects all these proposals and exchanges contact details only between participants who have a match—that is, those who propose to each other.
Participants are recommended to create a personal profi le on the agency’s website reporting information on age, education, occupation, basic physical characteristics (for example, weight and height), interests, smoking habits, and family situation (presence of children). 6 This information is self- reported and is not formally verifi ed by the
agency.7 Pro
fi les are accessible by all participants after the event only.
5. Bruze (2011) fi nds a strong tendency to sort positively on education in marriage among movie stars. Although this result, as Bruze suggests, could be ascribed to preferences, it might be driven instead by the pool of available partners movie stars usually interact with.
6. The profi les, however, do not contain information on race or ethnic origin.
Our estimating sample uses most of the available data drawn from these profi les. Each profi le contains information on variables generally believed to be salient deter-minants of mate selection (Buss 2003). These include cues that can be apprehended visually, such as age, weight, height, as well as other traits that cannot be easily as-sessed, for example, educational attainment, occupation, and smoking status.
There are two potential problems with this information. The fi rst is the misrepre-sentation of attributes and the other is missing information about (or nonreporting of) attributes. Regarding the fi rst issue, we do not know the extent to which partici-pants may have misrepresented their attributes in the online profi les. Using a random sample of daters, Hanckock, Toma, and Ellison (2007) provide direct evidence of the prevalence of misrepresentation in online dating profi les. They directly measure height, weight, and age for 80 online daters and then compare these “ground truth” data to the information provided in online dating profi les. The results suggest that deception is frequently observed, but that the magnitude of the deceptions is usually small. The average discrepancy between reported height and actual height is less than 1 centimeter, that between reported weight and actual weight is about 2.5 kilograms, and the deviation between observed and online age is fi ve months. These fi ndings therefore provide evidence of limited misrepresentation of attributes for online daters. We expect a smaller scope for lying among speed daters. This is because they meet personally even before accessing the online profi les. Arguably, the face- to- face meet-ing gives all participants an opportunity to assess the truthfulness of the information contained in the online profi les, especially in the case of attributes that are easier to verify. We will come back to the issue of misrepresentation in Section V.
The second problem—nonreporting—is more complex and possibly strategically motivated. Since reporting is not compulsory, participants may strategically abstain from reporting attributes they judge less desirable, rather than lie. As we will see later in this section, this behavior could explain discrepancies between the descriptive statistics of the sample and the general population.
B. Descriptive Statistics
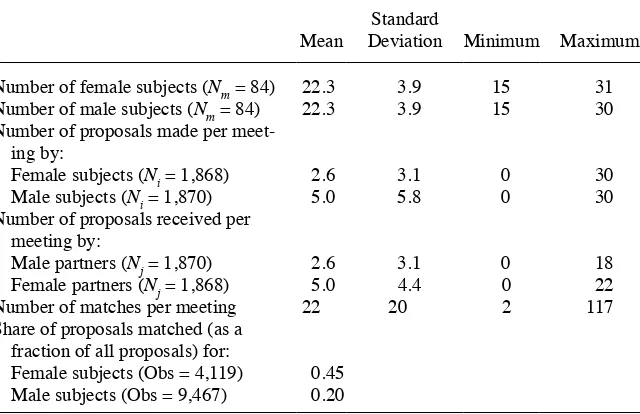
We have data on approximately 1800 women and 1800 men who participated in 84 speed- dating events organized between January 2004 and October 2005. Table 1 presents the summary statistics of these meetings. The average size of an event is approximately 22 men and 22 women. Most events do not have exactly equal num-bers of women and men, but the difference in numnum-bers rarely goes beyond three. The median participation fee across all markets is £20 per session and ranges from £10 to £25 (in 2005 prices). About 38 percent of men and 46 percent of women do not propose to anyone, and three- quarters of the nonproposing men and almost half of the nonproposing women in the sample go back another time. Proposers too go back another time, albeit at a smaller rate on average (about 10 and 20 percent for women and men, respectively).
Overall, we observe 22 matches per event, an average of roughly one per participant. To ascertain if participants who do not make any proposal are different from those who do, we checked whether the two groups are balanced in their distributions of observed characteristics for each gender separately. Regardless of subject’s gender, we cannot reject the null hypothesis that the two groups are the same along each of the variables used in our empirical analysis. We repeated this exercise for partners, to assess if part-ners who receive no proposal are different from those who are chosen at least once. Again, balance tests can never be rejected at standard levels of statistical signifi cance, irrespective of partner’s gender.8
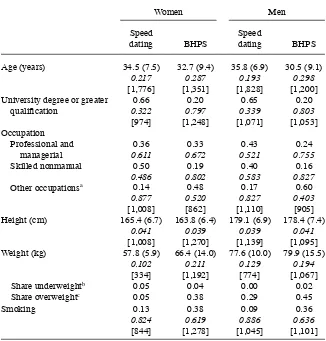
To have a better understanding of speed daters’ characteristics, we compare them to a representative sample of singles taken from the British Household Panel Survey (BHPS).9 For this comparison, we use information from the fourteenth wave (2004)
of the BHPS, and restrict the BHPS sample to individuals aged between 20 and 50. Summary statistics by sample are reported in Table 2.10 Clearly, this exercise and our
8. As already mentioned, our data do not contain information on race or ethnicity. However, given that none of the events was aimed at a specifi c ethnic / religious group and with anecdotal corroborative evidence from the agency’s management, the fraction of nonwhite participants is small (and most certainly below 5 percent). 9. Since 1991, the BHPS has annually interviewed a representative sample of about 5500 households cover-ing more than 10000 individuals. More information on the BHPS can be found at <http: // www.iser.essex .ac.uk / ulsc / bhps / doc / >.
10. The categorizations of the variables in Table 2 and used in the analysis below are standard. Some, such as education and occupation, have been motivated by data availability. Redefi ning, for example, education
Table 1
Sample Characteristics of Speed- Dating Events
Mean
Standard
Deviation Minimum Maximum
Number of female subjects (Nm = 84) 22.3 3.9 15 31
Number of male subjects (Nm = 84) 22.3 3.9 15 30
Number of proposals made per meet-ing by:
Female subjects (Ni = 1,868) 2.6 3.1 0 30
Male subjects (Ni = 1,870) 5.0 5.8 0 30
Number of proposals received per meeting by:
Male partners (Nj = 1,870) 2.6 3.1 0 18
Female partners (Nj = 1,868) 5.0 4.4 0 22
Number of matches per meeting 22 20 2 117
Share of proposals matched (as a fraction of all proposals) for:
Female subjects (Obs = 4,119) 0.45
Male subjects (Obs = 9,467) 0.20
considerations are relevant only for those speed daters and BHPS respondents with nonmissing information in each of the characteristics under analysis. As mentioned, the issue of speed daters lying about their self- reported personal traits is generally
(occupation) so that lower educational qualifi cations (other occupational groups) are explicitly considered would only lead to small cell size problems without adding new insights into mate choice decisions.
Table 2
Share underweightb 0.05 0.04 0.00 0.02
Share overweightc 0.05 0.38 0.29 0.45
Smoking 0.13
Note: In each cell, we report the mean, the standard deviation in parentheses, the coeffi cient of variation (which, in the case of the speed- dating sample is a weighted average by market, with weights given by the number of participants over the total population of speed daters) in italics, and the number of subjects in square brackets. Standard deviations are not reported for dummy variables.
a. Includes workers in manual occupations, self- employed, full- time students, and individuals in other jobs. b. If BMI<18.5.
believed to be minimal.11 The issue of missing information, instead, is more
problem-atic, especially for some variables, such as female weight. Later in this section and in Section IV, we shall come back to this issue.
Bearing these caveats in mind, the differences across samples in Table 2 are notable. Speed- dating participants are more educated (about two thirds of men and women have at least a university degree, against 20 percent of singles in the BHPS) and more concentrated in relatively high- skilled occupations (83 percent of men and 76 percent of women are in “skilled nonmanual” and “professional and managerial” jobs, as op-posed to 40 percent in the BHPS). Our sample therefore fi ts the popular view that speed- dating markets attract a disproportionate fraction of career people (Kurzban and Weeden 2005).
Speed daters (especially men) are also older than their BHPS counterparts. But if we restrict the BHPS sample to individuals with at least a university degree, the age dif-ferentials are reversed: Male and female speed daters are 1–4 years younger, respec-tively. The average height is similar in both samples, slightly below 180 centimeters for men and around 165 centimeters for women. The average weight is comparable among men in the two samples, but it is much lower for female speed daters, and this difference does not disappear even if the BHPS sample is restricted to highly educated women. Dividing weight (measured in kilograms) by height squared (measured in meters), we obtain the Body Mass Index (BMI), which we include in our empirical analysis.12 The shares of overweight men and, in particular, women are substantially
larger in the BHPS sample than in the speed- dating sample. The two sets of fi gures do not get closer even when the BHPS sample is restricted to more educated respondents.
As anticipated, the speed- dating sample is characterized by an issue of item nonre-sponse. It is possible that participants fail to report because of strategic motives, and this might make the interpretation of our demand analysis more diffi cult. For this rea-son, in Section IV we will try to minimize the resulting loss in sample size by assign-ing participants with missassign-ing weight information to the (base) normal weight category and identifying them with a missing weight dummy variable.13 We shall proceed in a
similar fashion for all the variables with missing information (except age, because we restrict the sample to individuals with valid age data). Alternative assignment rules (for example, substituting missing values with market mean or modal values computed on valid cases) have delivered exactly identical results to those discussed below and are, therefore, not reported.
Finally, smoking is more prevalent among BHPS respondents, with 36 percent of men and 38 percent of women smoking against 9 and 13 percent respectively in the speed- dating sample. Limiting the BHPS sample to highly educated individuals does not eliminate the differences but reduces them by more than half. Speed daters without missing information are therefore healthier than their BHPS counterparts. But par-ticipants in general could believe that smoking reduces their overall desirability and, consequently, may be more likely to fail to report smoking information.
11. In fact the reliability of the BHPS, our comparator data set, is also hard to establish (Lynn, 2006). 12. General health guidelines associate “normal” weight with a BMI between 18.5 and 25, and defi ne “un-derweight” when BMI is below 18.5, and “overweight” when BMI is above 25.
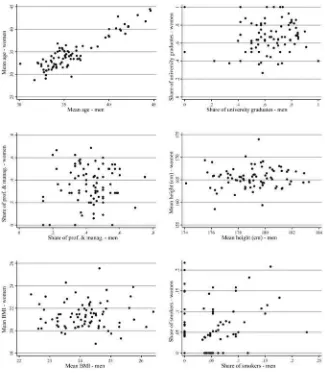
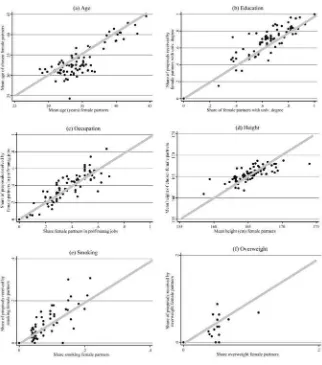
An attractive feature of the speed- dating protocol is the diversity of attributes of the participants attending the same event. Becausee events are stratifi ed by age and loca-tion, however, it is plausible that they attract people with similar attributes. To gauge the degree of sorting ex ante, we plot the distribution of female and male character-istics (means for age and height, and shares for the other attributes) across sessions (Figure 1). It shows a widespread distribution of participants along all traits, except age (which is not surprising). This is broadly confi rmed by the correlation estimates reported in the fi rst column of Table 3. Apart from age and smoking, the correlation between female and male attributes is close to zero and not signifi cant. In addition,
Figure 1
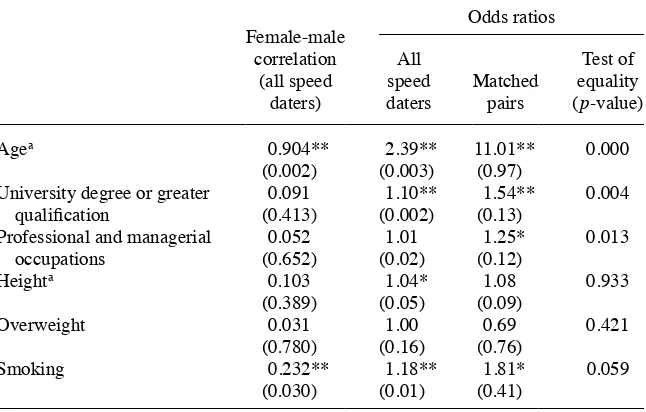
the second column of Table 3 reports odds ratios for all the female- male pairs in our sample. The odds of meeting a similar partner are slightly (but signifi cantly) greater than those of meeting a nonsimilar partner for almost all attributes, with the exception of occupation and weight. Despite this, such odd ratios are much lower than those gen-erally found for women and men in fi nal matches (for example, Mare 1991; Kalmijn 1994). We, therefore, take these results as evidence of only mild sorting ex ante. We shall return to the potential of nonrandom selection in the next sections.
IV. Individual Dating Proposals
We now estimate attribute demands looking at the whole set of pro-posals a subject can make in a given market and examining which of the potential partner’s observed attributes trigger a proposal. At this stage, we remain agnostic on the mechanisms that might drive such proposals, in particular whether they reveal
Table 3
Correlation Coeffi cients and Odds Ratios in Female and Male Attributes
Female- male
Note: The fi gures in the fi rst column are correlation coeffi cients between male and female attributes. Their standard errors (in parentheses) are bootstrapped from 100 replications. The fi gures in the second and third columns are odds ratios obtained from logistic regressions. Standard errors are in parentheses. In the column labelled “Test of equality” we report the p- value of the test that the odds ratio in the second column equals the corresponding odds ratio in the third column.
a. Odds ratios for this attribute are computed using two distinct groups—that is, individuals who are above the average age or height, and individuals who are at the average or below.
specifi c mating preferences or strategic considerations. Later in the section, we will come back to this issue.
We use a simple discrete choice framework to analyse proposal behaviour. In each market (or event) m, we observe whether a subject i proposes to partner j or not. We assume the utility U of subject i in event m depends on a vector of attributes Z of both individuals involved (for example, sociodemographic characteristics, personality traits, and physical attractiveness)—that is, Uim(Zjm,Zim). Each subject i proposes if
Uim ≥ Rim, where Rim is the unobserved reservation utility of individual i in market m.
Only a subset of cues Z, labelled X,is observed and we estimate a model of attribute demand which depends on such attributes.
The main question of the paper is to identify whether or not proposals are systemati-cally associated with specifi c cues of individuals on either side of the dating market. Are some attributes valued by everyone irrespectively of their own attributes (what we call agreed- upon or common preferences)? Or are people more likely to value attri-butes similar to theirs (what we refer to as assortative preferences)? The identifi cation relies on the fact that we observe subjects with different attributes meeting potential partners with different attributes. If choices are unrelated to attributes, this would not mean that choices are random, but rather that the specifi c attributes we observe are not relevant to individual decisions. In that case, subjects’ choice will entirely depend on the pool of available partners—that is, on meeting opportunities.
A. Baseline Estimates
We begin by investigating the simple association of partner’s attributes with the prob-ability of making a proposal, not controlling for the proposer’s characteristics. Our basic regression specifi cation is of the form
(1) dijm = X′jmβ+μi+ εijm,
where dijm is the proposal decision that subject i takes with respect to partner j in mar-ket m. This is equal to one if i proposes to j, and zero otherwise. The vector Xjm
con-tains sociodemographic characteristics of potential partners in market m, μi is a subject- specifi c permanent fi xed effect, and εijm is an idiosyncratic shock. As in other standard discrete choice problems, Equation 1 has a direct mapping to the underlying utility from partner’s attributes. Of course, it is possible that observable attributes are correlated with unobservable (to us) attributes, such as personality traits or physical attractiveness. Since we cannot identify those cues separately, the patterns we describe are associations between observable attributes and proposals. For ease of interpreta-tion, we estimate Equation 1 using linear probability models with subject fi xed effects. Qualitatively similar results were obtained using least squares regression and random effects models, which are therefore not reported.
The estimates by subject’s gender are shown in the fi rst two columns of Table 4.14
Belot and Francesconi
487
Subject’s gender
Test equality of coeffi cients (p- value)
(3)
Subject’s gender
Female (1)
Male (2)
Female (4)
Male (5)
Age (years) –0.005 –0.011 0.000 –0.005 –0.011
(0.000)*** (0.000)*** (0.000)*** (0.000)***
University degree or greater qualifi cation –0.001 0.018 0.002 –0.002 0.017
(0.004) (0.005)*** (0.004) (0.005)***
Professional and managerial 0.063 –0.070 0.000 0.060 –0.066
(0.024)** (0.025)*** (0.024)** (0.025)***
Skilled nonmanual 0.068 –0.074 0.000 0.064 –0.070
(0.024)*** (0.025)*** (0.024)*** (0.025)***
Other occupations 0.052 –0.096 0.000 0.048 –0.092
(0.025)** (0.025)*** (0.025)* (0.025)***
Smoking –0.016 –0.040 0.014 0.010 –0.028
(0.006)** (0.008)*** (0.012) (0.015)*
Height (normalized) 0.004 0.008 0.084 0.005 0.007
(0.001)*** (0.002)*** (0.001)*** (0.002)***
Weight (normalized) 0.009 –0.009 0.000 0.009 –0.009
(0.001)*** (0.002)*** (0.001)*** (0.002)***
Missing education –0.016 0.022 0.001 –0.018 0.020
(0.007)** (0.009)** (0.007)*** (0.009)**
The Journal of Human Resources
Table 4(continued)
Subject’s gender
Test equality of coeffi cients (p- value)
(3)
Subject’s gender
Female (1)
Male (2)
Female (4)
Male (5)
Missing occupation 0.047 –0.122 0.000 0.044 –0.122
(0.025)* (0.026)*** (0.025)* (0.026)***
Missing smoking status 0.014 0.003 0.228 0.014 0.002
(0.006)** (0.006) (0.006)** (0.006)
Missing height –0.033 0.000 0.000 –0.035 0.000
(0.009)*** (0.000) (0.009)*** (0.000)
Missing weight 0.010 –0.041 0.000 0.011 –0.036
(0.004)*** (0.005)*** (0.004)*** (0.006)***
Constant 0.235 0.724 0.000 0.189 0.662
(0.026)*** (0.027)*** (0.028)*** (0.031)***
Observations 41,767 40,544 41,767 40,544
R2 0.03 0.07 0.03 0.08
Note: Estimates are obtained from linear probability models including subject fi xed effects. The variables “height” and “weight” have been normalized by subtracting the corresponding sample mean and dividing by the sample standard deviation. Observations are at the subject- partner meeting level. The regressions in Columns 4 and 5 include similarity variables (see Table 5, Columns 1 and 2).
The third column reports the results on the test of equal coeffi cients by gender. All attributes, except height and missing smoking status, appear to affect desirability dif-ferently for men and women. A notable result is that partner’s attributes explain rela-tively little (between 3 and 7 percent) of the overall variation in proposals. This does not mean that preferences can have only a minor effect on mate selection: It is well established, in fact, that even mild preferences for certain attributes may lead to high levels of segregation (Schelling 1971).
On average, more educated women are two percentage points more likely to receive a proposal than less educated women. There is no evidence, however, of a similar pattern on the other side of the market—that is, in the case of women’s demand. This result does not imply, however, that education is unimportant to their mate selection. For instance, educated men may be more likely to choose educated women, while less educated men may rather choose less educated women, with educational heterogamy being negligible. The next section will examine this possibility.
Occupational status has a considerable infl uence on partner’s demand, and affects desirability in opposite directions for men and women. Women in skilled and manage-rial or professional occupations are less likely to receive a proposal than others, while the opposite pattern emerges for men. Physically observable attributes also have an effect. Both men and women are more likely to receive proposals if they are young and tall. Weight, on the other hand, has differential impacts by gender: It is a disadvantage for women but an advantage for men (see, among others, Tovée et al. 1998; Buss 2003). If a woman smokes, her likelihood of receiving a proposal is reduced by four percent-age points, and, if a man does, his likelihood goes down by about 1.5 percentpercent-age points. The analysis also includes indicator variables for missing information on partner’s characteristics. Their bivariate correlations are weakly positive and small, indicating that information is not systematically missing among a specifi c subgroup of partici-pants. Since speed daters create and post their own profi les online, it can be argued that those with missing data might seek not to disclose less desirable attributes. For example, on the basis of our previous results, overweight women and unskilled men could have an incentive not to report. The estimates in Table 4 show mixed evidence that participants who do not report information are less desirable. Women with miss-ing weight information are indeed four percentage points less likely to receive a pro-posal, but missing occupation information increases men’s desirability by almost fi ve percentage points. Regardless of subject’s gender, this pattern of association extends to other missing data indicators, with four out of 10 being negatively correlated to proposals and the other six having either positive or zero correlation.
It is worth stressing that socioeconomic status and physical attributes are correlated in our sample. For male subjects, education and occupation are strongly positively as-sociated with both own age and height. For female subjects, instead, height and weight are correlated with neither own education nor occupation, but age is negatively related to higher educational attainment.15 When formulating their proposals, therefore,
indi-viduals may be using partners’ desirable physical attributes, such as height and age, as strong predictors of socioeconomic position, as suggested by the matching theory based on costly signals developed by Hoppe, Moldovanu, and Sela (2009).
B. Common Preferences or Sorting?
The estimates so far do not take subjects’ own traits into account. It could be that the desirability of certain attributes is due to the composition of the pool of participants. For example, we do not know whether the desirability of higher educated women refl ects a true commonly shared preference for education among men or whether it refl ects a preference for a partner with similar education, since our sample is relatively highly educated.
We extend our analysis by taking into account the subject’s own attributes. We augment the model with concordance variables,16 and examine if subjects propose to
partners who are similar to themselves rather than to partners with different attributes. Our analysis is theoretically motivated by many of the studies that show striking simi-larities between mates along several dimensions, such as age, education and physical appearance (for example, Schwartz and Mare 2005; Kurzban and Weeden 2005). The demand framework analysis used in the previous subsection still yields an appropriate interpretation of the relationships of interest, provided the assumption of straightfor-ward behavior continues to hold.
We begin with a discussion of the estimates on partner variables as in the previous section, but controlling for similarity variables, which account for composition ef-fects. This permits us to assess the extent to which subjects value partner attributes conditional on their own attributes. The results are in Columns 4 and 5 of Table 4. The estimates are essentially the same as those shown in the fi rst two columns.17 Thus,
the pattern of choice we have identifi ed so far is commonly shared across individuals with different attributes. It could still be the case, however, that speed daters attach an additional value to attributes that are similar to theirs.
We therefore augment Model 1 with partner’s fi xed effects and with concordance variables—that is, we identify the effects of concordance variables controlling for subject and partner’s individual attributes. The results by subject’s gender are reported in Table 5.18 The
fi rst two columns present a specifi cation with concordance variables indicating whether subject and potential partner share similar or identical cues. The last two columns show the results from a more fl exible specifi cation, which allows for differences in the way heterogamy may affect mate choice (for example, whether the subject is more or less educated than the partner) and breaks down different types of concordance (for example, both subject and partner smoke or both do not smoke). Compared to the results of Table 4, we obtain a considerably greater R2 in all
speci-16. For this analysis, we use differences in age and height between men and women. In particular, we dis-tinguish pairs in which the man is seven centimeters taller from other pairs. Although this cutoff is arbitrary, seven centimeters correspond to one standard deviation in the height distribution of married men and women aged 20–50 in the 2004 BHPS. Seven centimeters are also about half of the gender height difference among married couples. Similar considerations apply to the case of age, for which we distinguish men who are fi ve or more years older than women. Therefore, although the construction of such concordance measures is primarily based on the empirical distributions of male- female attribute differences within our sample, their interpretation is meaningful and justifi able within both the mate selection literature more generally (Trivers 1972; 1998; Buss 2003) and the assortative mating literature more specifi cally (Kurzban and Weeden 2005; Nielsen and Svarer 2009). Several robustness checks of such measures have yielded comparable results to those reported here.
17. The results on the tests of equal coeffi cients by gender (not reported) are also the same.
Belot and Francesconi
491
Subject’s gender
Female (1)
Male (2)
Female (3)
Male (4)
Age
Man is between zero and fi ve years older 0.039
(0.003)***
0.061 (0.004)***
Man is fi ve years older or more –0.054
(0.005)***
–0.040 (0.006)***
Woman is older –0.022
(0.005)***
–0.081 (0.006)*** Education
Similar education level 0.017
(0.003)***
0.022 (0.004)***
Man is more educated –0.022
(0.086)
–0.088 (0.083)
Woman is more educated –0.000
(0.086)
0.051 (0.083)
The Journal of Human Resources
Table 5(continued)
Subject’s gender
Female (1)
Male (2)
Female (3)
Male (4)
Occupation
Similar occupation 0.007
(0.005)
0.006 (0.006)
Both students –0.010 –0.241
(0.100) (0.125)*
Both self- employed 0.106 –0.309
(0.131) (0.163)*
Both manual –0.012 0.001
(0.023) (0.028)
Both skilled / nonmanual 0.001
(0.007)
0.002 (0.008)
Both professional / manual 0.010
(0.007)
0.012 (0.009) Smoking
Similar smoking status 0.025
(0.012)**
0.014 (0.014)
Both smoke 0.045
(0.089)
0.068 (0.088)
Both do not smoke 0.003
(0.086)
Belot and Francesconi
493
(0.005) (0.006)***
Man is more than seven centimeters taller 0.021
(0.007)***
–0.009 (0.008)
Woman is taller –0.032
(0.006)***
–0.046 (0.008)*** Weight
Similar BMI 0.000
(0.007)
0.012 (0.009)
Woman overweight and man not overweight 0.109
(0.121)
0.047 (0.087)
Man overweight and woman not overweight –0.119
(0.125)
0.014 (0.071)
Observations 46,065 46,065 46,065 46,065
R2 0.32 0.34 0.32 0.18
Note: Estimates are obtained from linear probability models including subject and partner fi xed effects. The similarity variables are defi ned as follows: Education: both no degree or both with university degree, Occupation: both students, both self- employed, both skilled nonmanual, both manual, both professional / managerial; Smoking status: Both smoking, both not smoking; BMI: Both underweight, both normal weight, both overweight. Observations are at the subject- partner meeting level.
fi cations, suggesting that the inclusion of partner- specifi c fi xed effects enhances the model’s ability to capture the overall variation in proposals.
We fi nd evidence of positive sorting along age. Both men and women prefer dates where he is up to fi ve years older rather than dates where he is more than fi ve years older or where the man is younger than the woman. Mate desirability is also infl u-enced by educational homogamy (Nielsen and Svarer 2009): Partners with similar educational levels are two percentage points more likely to receive a proposal than partners with different qualifi cations. Women reveal positive assortative preferences on smoking and men on height, with both men and women disliking dates in which the woman is taller. There is instead no evidence of concordance on occupation or BMI. In fact, a man is substantially less likely to propose to a woman if both of them are students or self- employed.
An important determinant of mate choice decisions, which we have ignored so far, is the variation in the choice set faced by subjects within each session. This will be the focus of the next section. A related determinant is the choice set variation across
sections, as given by event size. Including event size (number of partners) as an ad-ditional regressor in Equation 1 does not change any of our results, with the event size estimates being always small and statistically insignifi cant.
In Section III, we pointed out that speed daters differ from singles from the general population along a number of salient characteristics. We also mentioned the possibility that the decision to speed date might signal a desire to meet people with such traits and individuals might self- select on the basis of these attributes. Consider the case of education, for which we observe speed daters are more educated than individuals from the general population. If speed daters know they are likely to meet highly educated participants and have a penchant for education, then it is possible that preferences play a role that we have not accounted for. Interestingly, we fi nd evidence of only mild preferences for higher educated partners on either side of the market. This observation could be extended to all other cues considered in the analysis.
C. Preferences or Strategic Concerns?
An important question arising from the previous analysis regards the interpretation of the mechanisms driving dating proposals. Proposals might be driven not just by pref-erences but also by strategic considerations (for example, anticipation of rejection). Choices, in fact, could be assortative either because speed daters have preferences for partners with similar attributes or because they have strategic concerns. For example, a low- education woman may be more likely to propose to a low- education man not be-cause she prefers a partner with similar education to hers, but bebe-cause she anticipates that she will not be chosen by a better educated man.
If variation in the quality of subjects in a given market leads them to make different choices, then this may be indicative of strategic choice behavior. For instance, partici-pants with relative attractiveness concerns may anticipate to be rejected in markets where they are relatively less attractive than their competitors. To test for this possibil-ity, we augmented Equation 1 with the vector (Xi− Xi(s)), where each X
i
(s) denotes the mean of attribute X computed over all subjects in a given market. If there is no strate-gic behavior of this kind, we expect the new estimated coeffi cients on all differences to be zero. All such estimates (not shown for convenience) are indeed not statistically different from zero, with the lowest p- values on age being equal to 0.174 for female subjects and 0.143 for male subjects, and with p- values of the F- test of joint signifi -cance being 0.448 and 0.403 for women and men, respectively. These results suggest, at best, a limited role for strategic choice behavior among subjects, in the sense that proposal decisions do not seem to be driven by subjects’ relative attractiveness con-cerns.
Another way of gauging the salience of strategic incentives is by looking at un-matched proposals.19 By de
fi nition, a proposal is successful only if it is matched. If speed daters are strategic and their proposal behavior is driven by the anticipation of who will reject them, we should fi nd that the correlation between proposals is positive and large, and that the proportion of proposals being matched is substantial. In events with a large fraction of “reject- averse” individuals, therefore, participants may be re-luctant to propose to partners who are believed to be less likely to reciprocate their proposal, simply because they do not wish to be turned down and not because such partners are not desirable. As documented in Section III, men propose to an average of fi ve women per session and women propose to an average of two men; the small number of male proposals is matched in only 20 percent of the cases, while the even smaller number of female proposals is matched in 38 percent of the cases. As a result, the overall correlation between proposals is positive but small (less than 0.15). This evidence supports the notion of straightforward behavior formalized by Fisman et al. (2006), on which the identifi cation of preferences in a speed- dating setup rests.
V. Aggregate Pattern of Dating Proposals
The estimates of the previous section offer evidence in favor of posi-tive sorting along a number of individual attributes. The goal of this section is to describe the aggregate patterns of proposals arising at the event (or “market”) level. As mentioned already, an important advantage of our data is that they have information on several events and, for each event, on both sides of the market in which individuals propose to each other.
In what follows we analyze two salient dimensions along which markets may vary: The fi rst is the abundance (or scarcity) of desirable attributes, and the second is the degree of homogeneity among potential partners. In some markets there may be an abundance of university graduates on both sides, while in others university graduates might be short in numbers. Alternatively, some sessions could be highly
neous, with participants being evenly distributed across educational groups on either side of the market. Although both dimensions could have a signifi cant impact on dat-ing proposal behavior, we know little about their infl uences.
A. Relative Abundance of Attributes and Aggregate Proposals
We start by presenting a simple conceptual framework that guides our empirical anal-ysis and the interpretation of the results. We have information on 84 events, each of them involving two pools of potential partners, one on each side of the market. Con-sider a specifi c speed- dating event, m (m=1, …, 84). Although, the full choice set is the product of distributions of all the observable attributes of all potential partners in m, we focus for simplicity on one attribute at the time, denoted by X, and represent the distribution of X over partners by its mean, Xm(p). For each m, we also observe the mean attribute of all partners who have been proposed to, which we refer to as the proposal setXm(c).20
Suppose dating proposals are exclusively formulated on the basis of meeting op-portunities—that is, subjects have no intrinsic preferences for X. In this environment, the mean attribute of partners who have been proposed to in market m will have to be equal to the mean attribute of all potential partners in m—that is, Xm(c)
= Xm(p). For in-stance, the share of highly educated women who have been proposed to in a given event should be equal to the share of highly educated women in that same event. Put differently, in a scatter plot of Xm(c) against X
m
(p), we would expect the data points to be
scattered along the 45- degree line. This is what we refer to as the “opportunity- only” (O- O) model, whose empirical counterpart corresponds to the following constrained regression:
(2) Xm(c) = Xm(p)
+um,
where um is an idiosyncratic shock to market m. If there is a commonly shared prefer-ence for X, then we will observe Xm(c)
> Xm(p) (that is, in the scatter plot, X m
(c) will lie above the 45- degree line), and if there is a commonly shared distaste, Xm(c)
< Xm(p) (that is, Xm(c) will lie below the 45- degree line). Such possibilities imply that Equation 2 becomes:
(3) Xm(c)
= α0+α1Xm (p)
+um,
with the O- O model corresponding to the constrained version of Equation 3 in which
(4) α0 = 0 and α1=1.
The equalities in Equation 4 provide the necessary and suffi cient statistical condi-tions under which meeting opportunities determine sorting. That is, if both equalities in Equation 4 cannot be statistically rejected, we say that meeting circumstances, as defi ned by the dating event, determine mate selection. When instead either or both equalities do not hold, the O- O hypothesis is violated. If both preferences and
oppor-20. By definition, and regardless of whether X is binary or continuous, Xm =(∑j
tunities play a role, the O- O model is rejected, but we expect α1 to be signifi cantly positive. If instead opportunities do not play a role at all, α1 should be equal to zero.
For each of the attributes used so far, Panel A of Table 6 reports the results from the regressions in Equation 3 by subject’s gender. To ease interpretation, the estimates are complemented by Figures 2 and 3, which plot Xm(c) against X
m
(p) for male and female subjects respectively. The O- O model cannot be rejected in eight out of the 12 attribute- proposal patterns analyzed here, while it can be rejected in the case of age (for both male and female proposals), smoking (female proposals) and education (male proposals). All estimates are robust to the inclusion of event size in Equation 3.
Consider the four cases in which the O- O model is rejected. In line with our earlier analysis, younger partners (regardless of gender), more educated women, and men who do not smoke tend to receive more proposals on average. Interestingly, in each of these cases, there is a switch in the aggregate proposal pattern depending on whether the attribute is abundant or not at the market level. The tendency to propose to partici-pants who are younger than the average in a given session is weaker in events in which there is an abundance of older- than- average partners, despite the fact that speed daters generally prefer younger partners. Similarly, the propensity to propose to men who do not smoke decreases when there are more male smokers present in the market. The scarcity of a desirable attribute (young age and nonsmoking) reduces its desirability, rather than heightening its demand. This cannot be easily interpreted on the basis of preferences only without resorting to opportunities. The opposite pattern is observed in the case of female education. Although women who are highly educated tend to be less popular than the average woman in sessions where there are only few of them, they become more desirable in markets where there are more of them.
The education estimates allow us to reconsider the issue of sample selection which was previously discussed in Sections III and IV. Speed daters are more educated than individuals from the population at large. If they know this and they wish to date highly educated people, the matching process we estimate at the event level should be driven by preferences to a large extent. If this is the mechanism underlying the proposal be-havior under study, then the slope parameter for education should be greater than unity. In Table 6, this emerges only for female subjects, although α1 is not statistically signifi cantly different from one. In the case of male subjects, instead, we fi nd exactly the opposite. Like in the analysis of individual demands, this evidence is hard to rec-oncile with the notion of a greater role for preferences in matching.
Dating proposals, therefore, cannot be assumed to be just a function of potential partners’ characteristics. The environment in which potential partners meet matters and may shape proposal behavior, albeit the O- O model is statistically rejected in such cases. It is worth stressing this point because market information is generally unavailable, even when online dating data are used, and, by leaving the market out of the analysis, we are likely to obtain an incomplete picture of mate choice decisions.
The Journal of Human Resources Table 6
Opportunities and Preferences in the Speed- Dating Market—Relative Abundance of Attributes
Age
R2 0.864 0.633 0.433 0.585 0.538 0.657
Observations 84 81 81 82 81 84
Male subject
R2 0.886 0.762 0.717 0.737 0.787 0.729
Belot and Francesconi
499
η1 0.88**
(0.07)
0.10 (0.14)
–0.09 (0.10)
0.11 (0.12)
0.09 (0.05)
0.10* (0.05)
R2 0.647 0.012 0.009 0.010 0.042 0.042
Observations 84 83 82 82 79 82
Male subject
η1 1.13**
(0.08)
0.001 (0.12)
0.02 (0.11)
0.10 (0.15)
–0.002 (0.008)
0.04 (0.08)
R2 0.704 0.001 0.003 0.005 0.001 0.003
Observations 84 83 82 82 79 82
Note: Ordinary least squares estimates; standard errors in parentheses. Figures in panel A are obtained from the estimation of Equation 3; those in panel B are from Equation 5 which includes a constant (see text). Observations are at the meeting level. In the rows labelled “F test,” we report the p- value of the test that α1=1 or of the test that α0=0 and α1=1.
In the previous section, we mentioned the potential issues raised by individuals who participate to more than one event. To assess the infl uence of”returning” speed daters on our results more formally, we recomputed the statistics needed to test the O- O model after excluding individuals who were observed in more than one event. The estimates from this new exercise were very close to those shown in Table 6 and are thus not reported.
Our analysis so far has assumed that proposals are determined only by partners’ characteristics and attribute distributions. Of course, they may be infl uenced also by subjects’ characteristics and distributions. For example, highly educated women may
Figure 2
Selection and Partners’ Supply—Male Subjects
receive a larger share of proposals in sessions with a greater concentration of highly educated male subjects; and, conversely, they may receive a smaller share of proposals when the pool of subjects is relatively less educated. To explore this possibility and provide a further robustness check of our results, we analyze a relationship similar to Equation 3 in which, on the righthand side, Xm(p) is replaced with the observed mean of
X computed over all subjects in m, Xm(s), that is:
(5) Xm(c)
= η0+η1Xm (p)
+νm. Figure 3
Selection and Partners’ Supply—Female Subjects
The idea here is that if, given m and X, subjects’ proposal behavior, summarized by
Xm(c), is independent of subjects’ own attribute distribution, captured by X m
(s), (or, in
other words, η1= 0), then dating proposals are expected to be shaped mainly by mar-ket conditions.21
The results are in Panel B of Table 6. Except for the cases of age and smoking, the distribution of subjects’ attributes turns out to be uncorrelated to subjects’ demands. This means that, in our speed- dating context, subjects’ characteristics do not infl u-ence subjects’ proposals (to whom they propose). Proposals, therefore, continue to be largely determined by the opportunities of meeting specifi c partners with specifi c attributes.
B. Market Homogeneity and Sorting
Other than with respect to the relative abundance of attributes, markets may also vary in their degree of homogeneity, whereby sessions could comprise more or fewer indi-viduals with similar attributes. To gauge how market homogeneity infl uences the dis-tribution of proposals, our analysis here follows that just performed, although now it focuses on changes in the degree of partner homogeneity across markets, which is defi ned as the fraction of pairs of potential partners in a given session who share a specifi c attribute. If dating proposals are exclusively formulated on the basis of meet-ing opportunities—that is, subjects have no intrinsic preferences for partners with a similar attribute, the share of partners who have been proposed to in market m will have to be equal to the share of potential partners in the same market. We keep the same notation as before, but now X refers to the fraction of partners sharing an identi-cal attribute. In such an environment, the O- O model corresponds to the following constrained regression:
(6) Xm(c) = Xm(p)
+ ξm,
where ξm is an idiosyncratic shock to market m. Again, if there is a commonly shared preference for similarity along X or if there is a commonly shared distaste, we will observe Xm(c) to be either greater or smaller than X
m, respectively. To allow for this
possibility, we then estimate
(7) Xm(c)
= γ0+γ1Xm (p)
+ξm,
with the O- O model corresponding to the constrained version of Equation 7 in which γ0 = 0 and γ1=1. The same caveat about this test as the one raised earlier—that is, that it amounts to testing a mixture of preferences and opportunities rather than the O- O model per se, applies again.
For each attribute, Table 7 reports the results from Regression 7 by subject’s gender. The O- O model is rejected in six out of the 12 cases at standard levels of statistical signifi cance. These are age and height regardless of the subject’s gender, BMI for
Belot and Francesconi
Observations 84 84 84 84 84 84
Male subject
Observations 84 84 84 84 84 84
Note: Ordinary least squares estimates; standard errors in parentheses. Figures are obtained from the estimation of Equation 7. Observations are at the meeting level. Homogeneity in attributes is defi ned as follows: Age: Man is at most fi ve years older than the woman; Education: Both with less than A- level qualifi cations, or both with A- level (or equivalent) qualifi cations, or both with university degree; Occupation: Both in professional- managerial occupations, or both in skilled nonmanual occupations, or both in manual occupations or both students; Height: Man at most seven centimetres taller than the woman; BMI: Both overweight, or both normal, or both underweight; Smoking: Both smoking, or both not smoking.
** signifi cant at 1 percent.
male subjects, and smoking for female subjects. The fact that Equation 6 cannot be rejected in the case of education and occupation indicates that sorting along such char-acteristics is likely to be mild. But we fi nd evidence of negative sorting along height (especially among women) and BMI (especially among men), while positive sorting emerges in the case of age and smoking. This evidence is indicative of the importance of assortative preferences in mate choice decisions.
VI. From Proposals to Matches
Because our data contain information on proposals made from both sides of the market, we can gain further insights on the nature of the matches arising after a fi rst encounter. A natural question, in fact, is to ask whether greater positive sorting is found when we observe a match—that is, when two people propose to each other.
Repeating the analysis reported in Section III, we compute attribute odds ratios for the female- male pairs for which there is a match. To ease our exposition, these estimates are presented in Table 3, close to the corresponding odds ratios computed on all female- male meetings. The odds of getting matched to a partner of similar age are 11 times greater than those of getting matched to a partner of different age, which represents an almost fi vefold statistically signifi cant increase with respect to the cor-responding odds ratio computed on all speed daters. The odds ratios for matched pairs on the other attributes increase too, and, as indicated by the last column of the table, this increase is signifi cant in the cases of education and occupation. But the magnitude of such odds ratios is always modest, especially if compared to the estimates found with fi nal match data (Mare 1991; Kalmjin 1994; Schwartz and Mare 2005). Thus, preferences (in particular, on age and education) infl uence match formation in this environment, but much less than what we observe amongst partners in cohabiting or marital unions in standard survey or census data.
VII. Discussion
The previous two sections document one important new result: Not only are dating proposals and matches determined by individual preferences over partner’s attributes but they also are shaped by meeting opportunities in the dating market. This indicates that dating and mating require meeting: The pool of available interaction partners is shaped by various institutionally organized arrangements (for example, schools, work places, neighborhoods, family networks, voluntary associa-tions, bars, and clubs) and these constrain the type of people with whom we form personal relationships and eventually durable unions.