434
The Impact of Brand Value towards Stock Price in Indonesian Banking Industry
Valdi Vallian
International Business Management Program, Petra Christian University Jl. Siwalankerto 121-131, Surabaya
ABSTRACT
Brand value is especially important in banking industry, because it enables firms to get recognition from customers as well as gaining loyalty, which is pivotal in determining firms’ success. The purpose of this research isto determine whether brand value affects company performance in the form of stock price. The research is conducted over four biggest banks in Indonesia in terms of market capitalization in Indonesian, namely Bank BCA, Bank Mandiri, Bank Danamon, and Bank BRI, which are observed over eight years of operation (2007-2014). Multiple linear regression method was used in this research, with the stock price as dependent variable and brand value, along with three financial performance indicators as the independent variable. The results of the research indicate that in Indonesian Banking Industry, brand value does not significantly affect stock price, at least individually. Instead, Earnings per Share is found to be the only significant impacting variable towards stock price.
Keywords: brand value, stock price, multiple linear regression, Indonesian banking industry
ABSTRAK
Brand value merupakan suatu aspek yang penting dalam dunia perbankan, karena brand value bisa menciptakan brand recognition dan juga loyalitas pelanggan, yang sangat menentukan kesuksesan perusahaan. Riset ini bertujuan untuk mengetahui apakah brand value mempengaruhi performa perusahaan, yang diukur dalam konteks pergerakan harga saham. Riset ini adalah mengenai performa empat bank (Bank BCA, Bank BRI, Bank Mandiri, Bank Danamon) dengan kapitalisasi pasar terbesar menurut Bursa Efek Indonesia selama 8 tahun berturut – turut (2007 – 2014). Peneliti menggunakan metode analisa linear berganda untuk riset ini, dengan harga saham sebagai variabel dependen dan brand value beserta tiga indikator performa finansial perusahaan sebagai variabel independen. Hasil dari riset ini mengindikasikan bahwa brand value secara individu tidak mempunyai pengaruh yang signifikan terhadap harga saham. Ternyata, EPS merupakan satu – satunya variabel yang paling berpengaruh terhadap harga saham.
Kata Kunci: brand value, harga saham, multiple linear regression, industri perbankan Indonesia
INTRODUCTION
Concepts of branding is still relatively new to the banking industry. This is supported by the fact that branding valuation reports for banking industry only emerged recently, in 2007 (Brand Finance, 2007 - 2015). However, recent researches implies that companies who apply brand value concepts well can acquire a significant advantage over competitors in the form of increased brand awareness and customer loyalty (Bain & Company, 2014) .
A research from Millward Brown, a global brand consultant, customers are much more likely to buy a product with a brand that has the elements mentioned above: meaningfully different, relevant, and does what it promises. And once the customers are hooked, they will stick with that brand in the future (Kourovskaia, 2013). As a result, the
company may be able to secure more future income, improving its brand value in the process.
435 price performance compared to those with weaker brands. Other than stock price performance, as suggested by Simon and Sullivan (1993), brand value is also affecting the market in consumer level, as it “affects behavioral outcomes, including purchase intention.” (Chu & Keh, 2006).
In order to justify the importance of brand value, study tried to establish a connection between brand value and company performance through the proxy of stock price. It is initially hypothesized that if brand value truly improves company performance, then it should significantly affect stock price.
However, it is commonly known that the movement of stock price is also influenced by firms’ operational performance, which is generally seen through companies’ financial performance indicators (New York Stock Exchange, 2010). In this study, the financial indicators used would be Book Value per Share, Earnings per Share, and Market Capitalization. As such, this study also hypothesized that brand value, along with the financial performance indicators would significantly impact the stock price.
Hypotheses testing are performed using multiple linear regression, namely t – test and F – test.
LITERATURE REVIEW
The Theory of Brand ValueAccording to Tiwari (2013), brand value is a concept of multiple interpretations. As stated previously, it can be seen from two perspectives: financial perspective and marketing perspective (Tiwari, 2013). Although the author has already stated that the focus of this study is brand value in financial perspective, both perspectives will still be discussed in the following due to the fact that both concepts are interconnected to each other.
Under marketing perspective, brand value is often referred to as brand equity. It is a concept originally conceived by Tom Aaker in his book, titled Managing Brand Equity, which was released back in 1991. Aaker defined brand equity as brand – based assets and liabilities that can improve or reduce value of a product and/or service (Aaker, 1991). The complete Aaker’s model of brand equation can be broken down in five components. First element is Brand Loyalty, which is how loyal customers are towards a certain brand, in terms of the reluctance to switch to other brands, the tendency to attract new customers, word of mouth, and most importantly the repeat and consistent usage of the brand. Second, there is Brand Awareness: how acknowledged a brand is towards the public. This can be measured by how familiar the brand is and how the brand is considered in customers’ purchasing process. The third element is Perceived Quality, which is the extent to which the brand is seen to have a good quality in products/services offered. This can be measured by availability, price, differentiation, brand extension, and the actual quality of the product/service. Fourth, Brand Association: the degree to which a brand is associated to certain real life values. For example, Apple brand is commonly associated by customers with the value of exclusivity and premium quality (Azzawi & Anthony, 2012). When the association is formed in the minds of the
customers, it can enable brands to differentiate themselves from competitors, influence buying process, creating positive customer attitudes, and also open ways to extend the brand. And last but not least, there is Other Proprietary Assets, which is proprietary elements that contribute to improving overall brand equity, such as patents, intellectual property rights, and so on.
Aside from the aforementioned factors, Aaker (1991) also acknowledged that these five determinants have its benefits towards the shareholders, mainly brand loyalty, price premium, and competitive advantage. When a firm gets a hold of these benefits, then it means that the firm already secures a certain extent of future earnings, because customers are willing to keep buying the brand at a higher price in the foreseeable future. By understanding this, then it is clear how brand can provide value to customers, and consequently, to firms.
Under financial perspective, brand value, is simply the economic value of brand towards the shareholders (Interbrand, n.d). Up until around early 1980s, the main contributor towards business value has always been tangible assets: buildings, land, manufacturing assets, and so on. However, the importance of intangible assets, such as brand, were getting more and more substantial, which was evidenced by the increasing gap between book value and market value companies in the stock market. It is very possible that the value creation was attributable to intangible assets (Interbrand, n.d). As such, it can be said that brand is the most important asset that a business could ever have. As stated previously, brand could influence customers’ perception and purchase decision to the point of securing future earnings (Brand Finance, 2007 - 2015). In an increasingly tight business environment, such kind of influence is paramount in creating shareholders value. However, until that moment the concept of brand value has yet to be established. It was under these conditions that the accounting practices started to deal with brand value in an economically sensible way.
At first, putting an economic value in a brand seemed inappropriate. The first companies that actually put brand value in their balance sheet (in the form of goodwill) were accused for value – enhancing practices (Interbrand, 2013). However, some countries like UK and France, acknowledged the value of brand and allowed companies to put them in the balance sheet. In 1988, a UK food conglomerate named Rank Hovis McDougall first pioneered the practice of valuation in his brand portfolio. From then on, the recognition of brand value gets more spotlight. In 1989, London Stock Exchange endorsed the brand valuation method from McDougall. In 1999, IFRS 10 and 11 were issued on the topic of goodwill and intangible assets. And nowadays, the economic value of brands is finally widely accepted (Interbrand, 2013).
The Theory of Stock Price
436 one can buy or sell a unit of stock. Market price of a stock is fluctuates in response to a number of factors: company profitability, financial status of the company, future prospects, and general macroeconomic environment. Second, there is Withdrawal Price: the price at which a company may withdraw preferred stock from the market. The withdrawal price is already decided prior to the issuance of shares. Third, there is also Liquidation Price: this price is also only applicable to preferred stock, which is the price at which a company agree to pay to the owners of preferred stock whenever the company is liquidated. Unpaid dividends will also be added towards the value. Lastly, stock price can be defined in Book Value: a nominal value which signifies the portion of the company’s equity for every share outstanding. This value is acquired through dividing the total of company’s equity by total amount of shares outstanding in the market.
The stock price definition referred in this study is the market price of the stock. The reason is that market price is the one used and listed in stock indexes worldwide. Market price fluctuates in its own regard, and there are two sets of factors affecting it: external and internal factors (New York Stock Exchange, 2010). The external factors affecting stock price fluctuation can be from stock index, financial information of firms, economic trends, and even major world events. However, there are also internal factors, which are embodied in companies’ financial performance indicators.
Relationship between Concepts
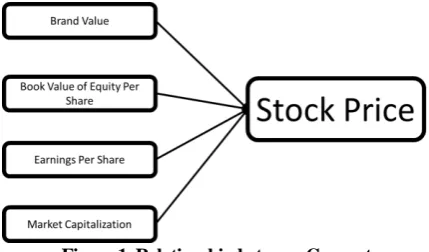
This study uses the following research framework.
Figure 1. Relationship between Concepts
The author employed the theory of brand value and stock price as the basis of this research. The brand value definition that will be used would be the financial perspective of brand value, in which the value will be acquired through Interbrand’s method of brand valuation. Brand value, as discuss previously, creates customers value first, which leads to the increasing customers to a company. This means that the company performance also increases, which will be responded by increasing demand for that company shares in the market, driving its price up. Following the previous studies, it is deemed necessary to control the association between brand value and stock price through the usage of financial indicators as additional controlling variables. The additional control variables that will be used are: book value of equity per share (Kirk, Ray, & Wilson, 2012), earnings per
share (Kirk, Ray, & Wilson, 2012), and market capitalization (Eryigit & Eryigit, 2014). Book value of equity per share is the very innate value of the share. As such, when book value goes up, then it means to the market that the company is truly growing, hence generally increasing its stock price. When earning per share increases, then it is clear that the firm’s profit increases, making it more favorable to investors, raising its stock price. When market cap increases, then it means that either more shares are being sold to the market, or the share price is on an increasing trend, which will drive more investors to buy it, raising its price. The reasoning behind the choosing of these four control variables are not only because the past researches chose the mentioned variables, but also the fact that those has been proven by researches to have a relevant explanatory power regarding the value of the stocks (Brief & Zarowin, 1999). The past two studies also concluded that brand value has a lagged effect towards stock price, hence the brand value data for the model at any point of time is lagged for one year.
There are three past researches deemed relevant, which are used as the basis of this researches.
The author has developed the following hypothesis in regard of the predicted outcome of this research. First, brand value and the financial performance indicators simultaneously and significantly affects stock price. Second, brand value significantly affects stock price.
RESEARCH METHOD
This study is generally classified as causal research, in which this research examines the relationships between brand value and stock price by setting the brand value and the as the cause to stock price performance of the mentioned companies, which is also controlled by financial indicator variables (Book value per share, book value of equity per share, earnings per share, and market capitalization). This study will describe the movement of the stock price of Indonesian commercial banks listed in Indonesian Stock Exchange as the dependent variable, as a result of the changes made by brand value, the independent variable. This relationship will be further controlled by the companies’ book value per share, book value of equity per share, earnings per share, and market capitalization as the additional controlling variables.
In line with the research purpose, the author will employ quantitative approach, which means that the author will focus on acquiring numerical data of the research subjects and generalize it among the subjects. This is intended to extract an objective answer towards the research questions the author has mentioned in previous sections. The data will be processed using SPSS Statistical Tool 19.0, and the author will employ the multiple linear regression analysis.
437 Exchange (IDX) over the years of 2007 – 2014. Specifically, the market price used would be the closing price at the end of every year. The independent variables used in this research would be: Brand Value; data will be acquired directly from Brand Finance Banking 500 report (2007 – 2015), Book Value of Equity per Share; Acquired through dividing net assets with total amount of shares outstanding with the data gathered from company annual report, Earnings per Share; acquired through dividing net earnings with number of shares outstanding using the data gathered from company annual report, and market capitalization; acquired through multiplying the yearly closing price of a certain stock with the number of shares outstanding in the same closing time.
The data type that will be used in this research will be ratio scale, as all the data required in this research, both dependent and independent variables, can be classified, ordered, measured in distance, and also be given provision of origin, and only ratio scale type of data fulfills that.
In order to acquire the most accurate, sufficient, and attainable data, the author gathers from secondary source of data for this research. Which means, that all the data in this research will be sourced from journals, company reports, book, website, and other relevant sources. The theories covered in previous sections are acquired from secondary sources, as well as the data for the dependent and independent variables. For brand value, the data will be gathered specifically from Brand Finance Banking 500 report.
The population of this study includes all banks listed in Indonesian Stock Exchange. This is done so that the whole population actually represents the Indonesian banking industry as a whole.
The sampling method that is used for this research is the judgment purposive sampling, which is a part of the nonprobability sampling which signifies that the author deliberately choose sample members to fulfill a set of criterions. As stated previously, the samples in this research would be filtered under two simple criterion: listed in Indonesian Stock Exchange during 2007 - 2014 and also listed in Brand Finance Banking 500 during 2007 – 2014. These criterions is deliberately set by the author for the sake of the availability of the data, accuracy of the data, and the profoundness of the sample. After a deeper research, this study found out that there are currently four instances that fulfills both criteria: Bank Mandiri, Bank BCA, Bank Danamon, and Bank BRI.
In this research, the author employs the multiple linear regression analysis (including F – test, t – test, and Coefficient of Determination), and consequently the author has to conduct the classic assumption test to scan and rule out any possibilities of normality, autocorrelation, multicollinearity, and heteroscedasticity in the data.
Normality test evaluates whether the sampling distribution and error distribution in the regression model are normal (Field, 2009). This can be tested through skewness and kurtosis test. As a rule of thumb, a data that is normal will have the z - skewness and z - kurtosis value between -2 and +2. (Field, 2009).
Multicollinearity test is the form of assumption that questions whether there is any correlational relationship between the predictors in the model, which are independent variables (Field, 2009). In an ideal environment, there should not be any traces of correlations in between the independent variables. In order to prevent this to happen, the author will employ the SPSS diagnostic tool called correlation matrix, which works at testing whether the predictors have strong linear relationship between each other (Ghozali, 2011). The decision rule is that if there are any two variables possessing a correlation value lower than -0.90 and higher than +0.90, multicollinearity exists, and if there are not, multicollinearity is not biasing the model.
Autocorrelation test refers to whether the residuals between any two observations are correlated (Field, 2009). Normally, this happens in time series data, due to the fact that it is naturally possible for past data to influence current data. In order to check this, Durbin – Watson test needs to be conducted. It basically tests whether the serial residuals are correlated to each other. The Durbin – Watson test results will vary from 0 to 4, and the value of 2 means that there is no autocorrelation in the data (Field, 2009). Above the value of 2 would indicate a negative correlation, and below would indicate a positive correlation. Hence, in ideal situation, the Durbin Watson value must be as close as possible to 2.
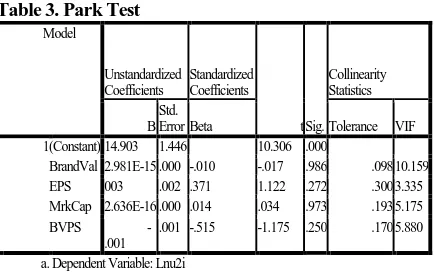
Heteroscedasticity means that the variances of the residuals in the observations are not equal (Field, 2009). In order to check this, Park Test is required. The Park Test works by doing an alternate linear regression with the logarithm value of squared residuals (LnU2I), and measuring whether if the P – value acquired from the test exceeds the significance level of the test, then it can be inferred that there is no heteroscedasticity in the model.
Multiple linear regression is the statistical method of choice in this study. Regression analysis is done under two purposes: to analyze the correlation between the dependent and the independent variables as well as its direction of relationship. According to Andy Field (2009), it is important that, after the regression model is established, to check the goodness of fit in order to check its accuracy. Goodness of fit test consists of three parts: Coefficient of determination, F – test, and t – test.
Coefficient of determination is developed from the sum of squares theory (Field, 2009). This R2 represents how good the model can explain the dependent variable, ranging from 0 to 1. The closer it is to 1, then the better the model is at explaining the dependent variable. However, as more independent variables are included in the model, the R2 gets inflated, disregarding whether the additional variables actually make sense. As such, it is inferred that the R2 needs to be adjusted in accordance to the number of independent variables.
438 By logic, in the regression model, if the independent variable can significantly predict the dependent variable, it means that the slope/coefficient would not be zero. In fact, it should be significantly different. t - test challenges such logic, as to whether the independent variables explain the dependent variables, be it partially or by itself (Field, 2009).
RESULTS AND DISCUSSION
Before conducting the analysis, the data source must be justified. There are five criterias to measure the justification of the secondary data used in this research: purpose, scope, authority, audience, and format (Cooper & Schindler, 2014).. Purpose evaluation sees whether the source has any explicit or hidden agenda. Indonesian Stock Exchange, Brand Finance, and annual reports exist based on real data and purported to give transparency to its users. Scope evaluates the depth of coverage, such as time period and geographic limitations. Indonesian Stock Exchange is the sole government institution that governs stock trading, hence the depth of coverage is unquestionable. However, Brand Finance and company annual reports data may not be available in a certain time period. Authority evaluates the level of data and its credentials.
Again, as the data is acquired from the regulator and the individual players in the market, it can be assumed that the data has a credible data. Audience factor evaluates the matter as to whom the data is presented. Indonesian Stock Exchange, Brand Finance, and the companies disseminate the aforementioned data to the market and the public audience, for the purpose of transparency. And finally, format factor evaluates how it is presented and ease of use. IDX presents the stock data in a time frame and the fluctuations of the stock data can be seen over time. As such, gathering the historical data for stock price in IDX is convenient because the author can just type in the stock code, date, and time to acquire the needed data. Annual reports are more complicated in nature, as it includes the full consolidated financial statements of the company. However, the data acquisition is doable because the explanations inside are clear and sufficient. Brand Finance releases the brand value report for banking industry, called Brand Finance Banking 500 annually, and inside it contains the exact value of every individual company featured, along with its historical brand value. The three sources used in this research can be assumed to be accurate source, as such data can only be acquired reliably only from the market authority, which is Indonesian Stock Exchange, global brand consultants like Brand Finance and the individual companies themselves. As such, the author believes that the secondary sources used in this research are justified.
Table 1. Correlations Table
Pearson Correlation StockPrc BrandVal BVAPS EPS MrkCap StockPrc 1.000 .691 .623 .747 .689 BrandVal .691 1.000 .738 .775 .789 BVAPS .623 .738 1.000 .895 .478 EPS .747 .775 .895 1.000 .604 MrkCap .689 .789 .478 .604 1.000 Sig.
(1-tailed)
StockPrc . .000 .000 .000 .000 BrandVal .000 . .000 .000 .000 BVAPS .000 .000 . .000 .003
EPS .000 .000 .000 . .000
MrkCap .000 .000 .003 .000 .
N StockPrc 32 32 32 32 32
BrandVal 32 32 32 32 32
BVAPS 32 32 32 32 32
EPS 32 32 32 32 32
MrkCap 32 32 32 32 32
In this correlation table, it is clear that no two variables has correlation value higher than 0.9. As such, it can be inferred that multicollinearity truly does not exist in the model.
The skewness and kurtosis value, as mentioned in previous chapter, needs to be changed into z – value, by dividing it with its own standard error, and if the results range from -2 to +2, it can be safely assumed that normality does not exist. After calculation, it turns out that the z – value for the skewness would be 1.207 and the z –value for the kurtosis would be -0.902 which shows that there is no normality in the data.
Table 2. Durbin – Watson Test
Model
R R Squ are
Adjusted R Square
Std. Error of the Estimate
Durbin-Watson dimension 1 .805a .649 .597 1680.56747 2.058
As stated previously, in an ideal situation Durbin – Watson value needs to be as close to 2 as possible. However, the decision rule, in the most conservative manner, is that the value should not be less than 1 and should not exceed 3. Durbin Watson value of this model is 2.058, which is very close to 2 as well as complying with decision rule. This means that there is indeed no autocorrelation.
Table 3. Park Test
Model
Unstandardized Coefficients
Standardized Coefficients
t Sig. Collinearity Statistics
B Std.
Error Beta Tolerance VIF 1 (Constant) 14.903 1.446 10.306 .000
BrandVal 2.981E-15 .000 -.010 -.017 .986 .098 10.159 EPS 003 .002 .371 1.122 .272 .300 3.335 MrkCap 2.636E-16 .000 .014 .034 .973 .193 5.175
BVPS
-.001
.001 -.515 -1.175 .250 .170 5.880
a. Dependent Variable: Lnu2i
439 multicollinearirty. In the table, it is evident that the significance values all exceed 0.05, which means that the model passed the classic assumption test.
The multiple linear regression analysis consisted of F – test, t – test, and coefficient of determination. For F – test, The decision rule for this is that the significance F must be lower than the significance level of the model (0.05) and the F value of the test must be bigger than the F value from the F table (2.732) for the variables to be simultaneously significant. The results of the F – test can be seen in the table below.
Table 4. ANOVA Table
Model Sum of
Squares df Mean Square F Sig. 1 Regression 1.408E8 4 3.520E7 12.462 .000a
Residual 7.626E7 27 2824307.032 Total 2.170E8 31
a. Predictors: (Constant), MrkCap, BVPS, EPS, BrandVal b. Dependent Variable: StockPrc
It is evident from the results that the significance F (0.00) is much lower than the significance level of 0.05, and the F – value is much higher than 2.732, which means that all variables have simultaneous and significant influence towards the dependent variable.
After finding out that the variables included in the model simultaneously and significantly influence the model, the author proceeds on to conduct the t – test, which tests whether each of the independent variables explain the dependent variable.
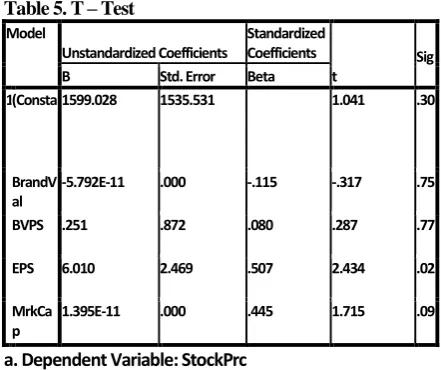
As stated previously, the decision rule is that if the significance value is lower than 0.05 and the t – value is bigger than the t – value in t – table which is 2.748, then it can be inferred that the particular independent variable signficiantly affects stock price. The results of the t – test is as follows.
Table 5. T – Test Model
Unstandardized Coefficients
Standardized Coefficients
t
Sig B Std. Error Beta
1 (Consta 1599.028 1535.531 1.041 .30
BrandV al
-5.792E-11 .000 -.115 -.317 .75
BVPS .251 .872 .080 .287 .77
EPS 6.010 2.469 .507 2.434 .02
MrkCa p
1.395E-11 .000 .445 1.715 .09
a. Dependent Variable: StockPrc
� = , ��. − . � �− ��� �� − . ���
+ . � �− �� �� + . ��� +
From the table of regression, both the t – test results and the interpretation for each variable in the form of regression can be gotten. The interpretation is as follows. From the
results, it turned out that the significance level of brand value is 0.754, and the t – value is -0.317. The results do not reach the desirable outcome. As such, it does not fulfill the decision rule completely, it can be inferred that this independent variable does not significantly affect stock price.
For book value of equity per share, as the significance t of this variable is 0.776, which is evidently much higher than 0.05, and the t – test statistic is not bigger than 2.048, indicating that this variable does not significantly affect the stock price.
With the significance t of 0.022 and t – value of 2.434, only earnings per share fulfills the two decision rules, making it the only variable that significantly affects the stock price. The unstandardized coefficient value of 6.01 indicates that every point of change in earnings per share will induce an increase in stock price for Rp. 6.01.
Market capitalization stands at the significance t of 0.098 and t value of 1.715, indicating that this variable does not significantly affect the stock price.
Lastly, the coefficient of determination must also be analyzed. The table below shows the adjusted R square for the model.
Table 6. Adjusted R Square Model
R R Square
Adjusted R Square
Std. Error of the Estimate
Durbin-Watson dimension 1 .805a .649 .597 1680.56747 2.058
In this model, it is evident that the adjusted R square value is 0.597, which simply means that 59.7% of the variations in Stock Price as the dependent variable can be explained by the four independent variables: Brand Value, Book Value of Equity per Share, Earnings per Share, and Market Capitalization, adjusted for number of independent variables.
Previously, the author has developed the following hypothesis. First, brand value and the financial performance indicators simultaneously and significantly affects stock price. And second, brand value significantly affects stock price.
The first hypothesis was tested using the F – test, in which , the decision rule is that the significance value must be below 0.05 and the F – value must be higher than the F value in the table, which in this case was found to be 2.732. Based on the test results, the brand value, along with the additional control variables possess significance value much below 0.05 and F value much higher than 2.732. This indicates that brand value, when exists in conjunction with the additional controlling variables, have simultaneous and significant impact towards the stock price.
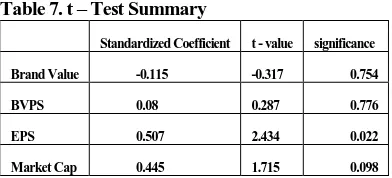
440 significantly affect stock price. The summary for the t – test is as follows.
Table 7. t – Test Summary
Standardized Coefficient t - value significance
Brand Value -0.115 -0.317 0.754
BVPS 0.08 0.287 0.776
EPS 0.507 2.434 0.022
Market Cap 0.445 1.715 0.098
The results explained above indicates that the second hypothesis which has been developed previously in chapter 2 is unproven. However, it is worth noting brand value, along with the additional controlling variables show significant and simultaneous effect towards the stock price when they are employed together (Brand Value, BVPS, EPS, and Market Cap). Yet, when these variables are separated each on its own, only EPS is found to be significantly affecting the stock price.
The reasoning behind this might be the fact that in banking industry branding alone matters less compared to the performance quality, especially when it is related to stock price performance. At that point, most market practitioners would trust financial performance indicators more to predict a company’s performance. This is a rather logical outcome, because no matter how good a bank’s brand is, if the performance delivered is not up to par, then the company might not do as well. However, if sufficient performance quality is supported by a good brand value altogether, then it will simultaneously and significantly impact the company overall performance. Recent researches supported this notion as well, by stating that the leading banks’ pillars of success in order of importance are as follows: Data & Analytics, Service Delivery, Performance Measurement, Operational Alignment, Product Innovation, and lastly Brand Management. (Deloitte, 2014).
CONCLUSION
In the starting point, it has been stated, through the statement of research problem that the author intends to scrutinize how brand value affects a company’s stock performance in the Indonesian banking industry. In answering this problem, the author has developed a hypothesis which tries to proof the significance of brand value towards stock price. In order to aid the hypothesis, the author employs four additional controlling variables along with the brand value, in the form of financial performance data (Book Value of Equity per Share, Book Value per Share, Earnings per Share, and Market Capitalization). After testing the hypothesis, it turned out that brand value does not have significant impact towards the stock price, hence the hypothesis the author developed in the beginning is rejected. However, this instance is in the case of individual impact, as brand value, along with the additional controlling variables, are found to have a simultaneous and significant impact towards the stock price.
In the end of the research, it is also revealed that, individually, the only significant influencing variable towards the stock price is the Earnings per Share. With this result, the author has delivered the interpretation in the discussion of the results section, which revolves around how in Indonesian banking industry, brand value, individually, is outweighed by company performance overall in terms of influencing the company stock price. However, this does not mean that companies in the industry must neglect the brand value due to its insignificance. This basically means that brand value alone does not give much value for banks, but when backed with a good performance, it can effectively leverage the stock price.
After concluding that individually, brand value does not significantly affect stock price, yet significantly affect stock price when working in conjunction with the additional controlling variables, which are financial performance indicators. Based on this conclusion, the author recommends that Indonesian banking industry to prioritize the improvement of overall performance as well as keeping branding activities in check.
First, Firms are advised to do Customer – Centric Approach. In the industry landscape where uncertainty is the only constant, and regulation gets stiff, it is believed that banking industry, more than ever, has to focus on customers above anything else. According to Deloitte (2013), the current customers of the banking industry are more knowledgeable, sophisticated, and very technology driven. Even just five years ago, the banking customers were not like this. As such, the customer centric approach banks need to take will revolve on utilizing technology to deliver what is called the 6Cs of customer centricity: Convenience (information availability and channel accessibility for transaction), Customization (tailored solutions), Control (data and analytics based decisions), Collaboration (ease of feedback exchange), Convergence (expanding channels everywhere), and Consistency. This kind of operational approach is believed to attract and retain customers, hence deliver the utmost performance improvement to banks worldwide.
Secondly, Even though it has been found that Brand Value does not individually affect stock price, it is not to be neglected. After taking care of performance improvement, it is appropriate to have a proper brand management. For banks, possessing a strong brand enables firms to attract and retain customers (Brand Finance, 2007 - 2015). However, a good brand management requires a great deal of investments in the designs and technicalities of the brands, which is why overall performance comes first.
In the end, the author believes that this topic of research has a tremendous potential to unravel insights on how brand value truly affect an industry, yet there are some hurdles the author faced throughout the research.
441 Finance Banking 500 of the year 2007, the same four banks used as the research sample. However, the data availability of brand value of banks in Indonesia is by no means adequate, as by comparison there are only four banks with complete brand value data opposed by the total of 36 banks listed in the stock exchange. If only the brand value data is more readily available in Indonesian Banking Industry, the insights revealed through this study would be much more solid.
Moreover, the research coverage of this study is limited. As this research only includes samples from Indonesian banking industry, the result is only relevant for the industry, and may not be relevant for the differing dynamics in banking industries of other countries. Improving this, in turn, would be a good step to make future researches in this area better. By simply expanding the coverage, such as from analyzing Indonesian banking industry to analyzing world banking industry in general would definitely expand the number of possible samples as well as improving the relevance of the research results.
REFERENCES
Aaker, D. A. (1991). Managing Brand Equity. New York: The Free Press.
Azzawi, M. A., & Anthony, M. (2012). Students Brand Preferences Between Apple and Samsung Smartphone. School of Sustainable Development of Society and Technology Malardalen University Eskilstuna-Västerås .
Bain & Company. (2014). Customer Loyalty in Retail Banking: Global Edition. Bain and Company. Bank Indonesia. (2009). Laporan Perekonomian Indonesia
Tahun 2008. Jakarta: Bank Indonesia.
Brand Finance. (2007 - 2015). Brand Finance Banking 500. Brand Finance.
Brief, R. P., & Zarowin, P. (1999). The Value Relevance of Dividends, Book Value and Earnings. New York: Leonard N. Stern School of Business, New York University.
Chu , S., & Keh, H. T. (2006). Brand value creation: Analysis of the Interbrand-Business Week brand value rankings. Market Letters, 9.
Cooper, D. R., & Schindler, P. S. (2014). Business Research Methods. McGraw - Hill.
DBS Vickers Securities. (2015). Industry Focus: Indonesian Banks and Multifinance. Jakarta: DBS.
Deloitte. (2014). Top Trends in Retail Banking.
Eryigit, C., & Eryigit, M. (2014). Impact of Brand Value towards Stock Price. Internatonal Conference of Business, Economics and Accounting, 14.
Field, A. (2009). Discovering Statistics Using SPSS. New York: Sage.
Ghozali, I. (2011). Aplikasi Analisis Multivariate Dengan Program SPSS. Semarang: Universitas Diponegoro. Hadi, D. K. (2009). Dampak Krisis Keuangan Global Bagi Indonesia. Jakarta, Indonesia: Universitas Bina Nusantara .
Hair, J. F., Black, W. C., Babin, B. J., & Anderson, R. E. (2009). Multivariate Data Analysis: Seventh Edition. Pearson.
Hall, J. (2013, Ocotber 20). 5 Business Goals Of Content Marketing. Retrieved from Forbes: http://www.forbes.com/sites/johnhall/2013/10/20/5-business-goals-of-content-marketing/
Harrison, W. T., & Horngren, C. T. (1998). Financial Accounting. Prentice Hall.
Indonesian Stock Exchange. (2014). IDX Factbook 2014. Jakarta: Research and Development IDX.
Interbrand. (2013). Brand Valuation: Financial Value of Brands.
Keller, K. L. (2003). Brand Synthesis: The Multidimensionality of Brand Knowledge. Journal of Consumer Research, 595-601.
Kirk, C. P., Ray, I., & Wilson, B. (2012). The Impact of Brand Value on Firm Valuation . Journal of Brand Management, 13.
Kothari, C. R. (2004). Research Methodology: Methods and Techniques.
Kourovskaia, A. (2013). Increasing Brand Value: A Masterclass from the World's Strongest Brands. Millward Brown.
New York Stock Exchange. (2010). What Drives Stock Price.
Otoritas Jasa Keuangan. (2014). Statistik Perbankan Indonesia. Jakarta: Bank Indonesia.
The Financial Brand. (2015). Beautiful Integrated Brand Identities from Retail Banks. Retrieved from thefinancialbrand.com: Given its importance and crucial role in Indonesian economy, justifying the impact of brand value towards stock price will enable the industry to understand the true value of branding and use it to optimize their performance.
Tiwari, M. K. (2013). Separation of Brand Equity and Brand Value. Business and International Management (Scopus®), 166.
UBS Bank. (2003). Branding for Banks. UBS Bank. University of Washington. (2007). Cross Sectional Data
Analysis and Regression.