T H E J O U R N A L O F H U M A N R E S O U R C E S • 47 • 2
Elderly Care and Intrafamily
Resource Allocation when Children
Migrate
Francisca M. Antman
A B S T R A C T
This paper considers the intrafamily allocation of elderly care in the con-text of international migration where migrant children may be able to pro-vide financial assistance to their parents but are unable to offer physical care. To investigate sibling interaction, I estimate best response functions for individual physical and financial contributions as a function of sib-lings’ contributions. After addressing the endogeneity of sibsib-lings’ contribu-tions and selection into migration, I find evidence that siblings’ financial contributions function as strategic complements while time contributions operate as strategic substitutes. This suggests that contributions may be based on both strategic bequest and public good motivations.
I. Introduction
Children are sometimes viewed as a method of insuring against dis-ability and providing income after retirement, especially in developing countries with limited markets for credit and insurance. By the time parents have reached an age where they require assistance, however, it is their children that must decide on the
Francisca M. Antman is an assistant professor of economics at the University of Colorado at Boulder. She is grateful to Doug Bernheim as well as Nick Bloom, Giacomo De Giorgi, Seema Jayachandran, Aprajit Mahajan, David McKenzie, Terra McKinnish, Luigi Pistaferri, Hillel Rapoport, Randall Walsh, participants of the labor and development reading groups at Stanford University, and two anonymous referees for helpful comments. Feedback from seminar participants at the PAA meetings, NEUDC, PAC-DEV, UNDP Conference on Migration and Remittances, as well as the economics departments at Wil-liams College, University of Virginia, Southern Methodist University, University of California Santa Cruz, and University of Colorado at Boulder are also appreciated. All errors are the responsibility of the author. This research was supported by the Leonard W. Ely and Shirley R. Ely Graduate Student Fund through a grant to the Stanford Institute for Economic Policy Research. A previous version of this paper was titled “Who Cares for the Elderly? Intrafamily Resource Allocation and Migration in Mex-ico.” The data used in this article come from the Mexican Health and Aging Study, a publicly available data set accessible online. Researchers are asked to register before downloading the data and may con-tact the author for assistance with this process at Francisca.Antman@Colorado.edu
[Submitted January 2010; accepted April 2011]
332 The Journal of Human Resources
distribution of responsibility of caring for their elderly parents. How do children decide on how much care to provide to their parents in old age, particularly in families with many children? The country of focus is Mexico, where the lure of international migration to the United States is strong given the possibility of earning a higher income and thus potentially contributing more financially to the elderly parent. At the same time, in most cases the decision to migrate substantially limits the migrant’s ability to visit his family in Mexico and thus prohibits him from acting as personal caregiver for the elderly parent. This paper provides insight into the allocation of resources within families by estimating best response functions for individual physical and financial contributions as a function of siblings’ contribu-tions. By estimating these equations conditional on a migration decision, I also consider whether motives for giving differ by migration status.
Although there is an extensive literature on migrant remittances, few papers have addressed the specific issue of migrant transfers to parents in the home country. One example is Lucas and Stark (1985), who find that migrants with wealthier parents contribute more to their parents relative to those migrants with poorer parents—a result suggestive of the possibility of intervivos transfers and/or a bequest motive. More recently, Alaimo (2006) considers whether parents of migrant children are better off in terms of time and money transfers relative to parents of nonmigrants. While she finds that parents with migrant children are better off in terms of financial assistance, because the units of analysis in her study are parents, it is not possible to fully examine the behavior of migrant and nonmigrant children within the family. This paper proposes a deeper analysis of intrafamily resource allocation by fo-cusing on children’s behavior toward their parents. I treat elderly care contributions in terms of time and money as the outcome of a noncooperative game among chil-dren. The game is made up of two stages where agents decide whether or not to migrate in the first stage and make contributions to elderly parents in terms of time and money in the second. From this perspective, I estimate best response functions for physical and financial care conditional on migration as functions of contributions made by other siblings. This analysis allows us to determine whether siblings’ con-tributions function as strategic substitutes, implying a negative relationship between siblings’ contributions, or strategic complements, in which an increase in one child’s contribution is met with an increase in that of his sibling.
Antman 333
contributions are strategic complements, then siblings would raise their financial contributions to the parents in response.
Treating siblings’ contributions as the outcome of a noncooperative two-stage game, I address the endogeneity of siblings’ contributions by using siblings’ char-acteristics as instrumental variables (IV). I check the robustness of the IV results by comparing them with results using a smaller set of instruments as well as from models including family fixed effects (FE and FEIV). I also consider the possibility of selection into migration by considering the results with a selection term, where identification is also based on siblings’ characteristics. Overall, I find evidence that individuals increase their financial contributions in response to an increase in their siblings’ financial contributions and decrease their time contributions in response to an increase in their siblings’ time contributions.
These results suggest that for both migrants and nonmigrants, financial contribu-tions function as strategic complements while siblings’ time contribucontribu-tions operate as strategic substitutes, a distinction that could indicate children’s expectation that parents will mainly consider financial contributions when they are making bequest decisions at the ends of their lives. Because the results are mixed in terms of sub-stitutes and complements, it is theoretically unclear whether the consequences of migration should be dampened or amplified by siblings remaining in the home coun-try, and instead depend on the magnitude of the effects. Antman (2010c) uses the estimates from the best-response functions estimated here to explore whether these findings point to an overall positive or negative effect of migration on contributions toward elderly parents. The results from simulating an exogenous switch in migrant status for one child show a decrease in time contributions and a more ambiguous change in financial contributions depending on family size. Consequently, policies that promote migration may have a negative impact on the overall well-being of elderly parents.
The paper proceeds as follows: Section II discusses the relevant literature and considerations underlying the use of a noncooperative model. Section III describes the data set and reviews the summary statistics. Section IV establishes the empirical strategy with a focus on challenges to identification. Section V presents and inter-prets the results. Section VI goes through various robustness checks including fixed-effects models. Section VII concludes.
II. Theory
A. Background
334 The Journal of Human Resources
of as a public good.1 If parental well-being is a pure public good, then we would expect the best response functions to indicate that siblings’ contributions are strategic substitutes. If, however, children’s only motivation to contribute is through some preference for personally caring for their parents, referred to as a “warm-glow” in Andreoni (1990), then there would be no relationship between siblings’ contributions as there is essentially no public good channel on which to free ride. Finally, if siblings are competing for their parent’s attention, perhaps due to affection or in anticipation of a bequest that may function as a form of payment as with Bernheim, Shleifer, and Summers’ (1985) strategic bequest motive, we would expect to find siblings’ contributions operating as strategic complements. Thus, the estimation of the best response functions, by indicating whether siblings’ contributions are stra-tegic complements, substitutes, or neither, can illuminate which model of family interaction is most appropriate.
Much of the literature specific to elderly care has focused on interactions between parent and child, and in particular living arrangements and care relationships in the intergenerational household (Pezzin and Schone 1997; Pezzin and Schone 1999). More recently, some attention has been paid to how siblings distribute responsibility of caring for their elderly parents but has still largely focused on siblings’ choice of co-residence with elderly parents, where only one child ultimately provides physical care (Hiedemann and Stern 1999; Engers and Stern 2002). Konrad et al. (2002) find evidence of strategic considerations in the residential choices of German children which take caregiving for elderly parents into account. Wakabayashi and Horioka (2006) examine the factors determining why eldest sons are more likely to co-reside with their parents in Japan and find evidence of a strategic bequest motive.
Pezzin, Pollak, and Schone (2006) consider a two-stage game where co-residence is determined in the first stage and transfers are determined in the second stage. They find that co-residence of one sibling reduces her bargaining power vis-a-vis her other siblings, so the equilibrium outcome may not be Pareto efficient. Most closely related to this paper, Checkovich and Stern (2002) examine the shared re-sponsibility for physical caregiving among siblings in the United States and find evidence that physical care decisions are negatively related across siblings. Financial contributions, however, are not simultaneously considered. To my knowledge, other than the current paper, Byrne et al. (2009) is the only other study to allow multiple siblings to contribute both financial and time assistance to the elderly parent. Their policy considerations, however, which include an evaluation of changes to Medicaid requirements, are better suited to the U.S. experience than the international migration context considered here in which migrant children will be unable to provide informal care.
B. Modeling Considerations
There are three main approaches to the analysis of intrafamily allocations: The uni-tary model that assumes that the family maximizes a joint utility function, cooper-ative bargaining models that assume the equilibrium outcome is always
Antman 335
efficient, and noncooperative bargaining models that focus on individuals as units of analysis and view family decision-making as a noncooperative game. This paper takes the latter approach which, it can be argued, is more appropriate for analyzing the relationship between older parents and their adult siblings that are largely in-dependent and are likely to have conflicting interests.
Given the high levels of remittances and the importance of networks in the context of migration, some might find it more appealing to position the family as unitary decision-maker rather than the individual. In light of the number of studies rejecting the unitary model of intrahousehold decision-making,2however, it seems reasonable to believe that this class of models would be even less appropriate for describing decision-making by family members who do not co-reside. By the same token, while cooperative bargaining tools have gained traction in modeling intra-household al-location within marriage and have been used to model decision-making in intergen-erational households (Pezzin and Schone 1999), they are arguably less appropriate for modeling resource allocation among adult siblings that generally live separately, and thus have generally not been used in this context in the literature.
Of course, the fact that there is motivation for strategic interaction among siblings does not necessarily imply that there is no room for at least partial cooperation among them. In a partially cooperative setting, siblings might consider the joint maximization of their utilities relative to some threat point and subject to some common resource constraint. As in intrahousehold cooperative bargaining models (Pezzin and Schone 1999; Haddad, Hoddinott, and Alderman 1997), the threat point could be determined by utilities in the noncooperative game or could incorporate environmental factors that determine each individual’s utility outside of the relation-ship. However, even if such a model were preferable theoretically, the empirical strategy used here would not be appropriate for analyzing its implications, because variables like siblings’ characteristics could affect individual contributions in a va-riety of ways, and thus fail to qualify as valid instruments for siblings’ contributions. Thus, it is important to note that the results presented below, and the noncooperative bargaining model and identification strategy on which they are based, are inextri-cably linked and would not necessarily hold under a cooperative bargaining ap-proach.
An alternative would be to use a model akin to the “collective setting” that as-sumes only that the intrahousehold allocation is Pareto-efficient.3Yet in the context of adult siblings that may free-ride off of each other’s contributions and behave strategically, assuming Pareto efficiency at the outset seems dubious, and the data set used here is very limited with regard to information on adult children (that is, no consumption, income, or price data) that might be used to test the suitability of such an approach as in Browning and Chiappori (1998).4Instead, in considering the
2. See, for example, Thomas (1990), Lundberg, Pollak, and Wales (1997), and Pezzin and Schone (1999) who reject the income-pooling hypothesis of the neoclassical or common preference model.
3. For an excellent review of intrahousehold allocation models, see Chapters 3 through 5 of Haddad, Hoddinott, and Alderman (1997), written by Pierre-Andre Chiappori, Marjorie B. McElroy, and Shelly Lundberg and Robert A. Pollak, respectively.
336 The Journal of Human Resources
voluntary contributions of adult children toward their elderly parents, one must rec-ognize that any behavior that is not incentive-compatible at the individual level is not likely to persist, so any model of cooperation must include some self-enforcing mechanism. One possibility is that siblings’ preferences could be interdependent in the sense that siblings care directly for each other so that one sibling’s utility enters into the utility function of the other sibling. In this case the interdependence of siblings’ actions would lie not only in the provision of the public good, elderly care, but also in the fact that their utility functions are interdependent. While this may be true for the nuclear family living under one roof, I find this possibility less likely among adult children who have formed separate households or at the very least to be of second-order importance.5
Another possible mechanism for sustaining cooperation is through repeated inter-action and may be appealing if siblings interact repeatedly with regard to the care of elderly parents. Repeated interaction also allows for multiple equilibria and the possibility that culture, social norms, or rules of thumb help dictate which outcome is most likely to hold. Most notably, in the repeated game agents may be able to generate a Pareto-improvement over the noncooperative, one-shot, Nash equilibrium outcome (Lundberg and Pollak 1994). This type of Folk Theorem result, however, requires the siblings to be sufficiently patient with regard to future payoffs. While estimates vary widely, the available evidence suggests that discount rates can be very high indeed (Frederick, Loewenstein, and O’Donoghue 2002), and even higher for the poor (Harrison, Lau, and Williams 2002), making the likelihood of sustaining a cooperative agreement among this population less likely. A related problem facing the repeated game approach is consideration of the end-game, since the approaching death of the elderly parent may imply that siblings discount the future at an even greater rate, and consequently further limits the scope for cooperation among them (Pezzin, Pollak, and Schone 2006).
Thus, it is unsurprising that the noncooperative approach has gained popularity among the small number of papers to model interactions among multiple adult chil-dren. For instance, Hiedemann and Stern (1999) model the long-term care arrange-ment of the elderly parent as a noncooperative game where the first stage involves children simultaneously choosing whether to offer care. Fontaine, Gramain, and Wit-twer (2009) take a noncooperative approach and assume that the outcome is a pure Nash equilibrium. Byrne et al. (2009) estimate a structural model with a Nash equi-librium solution concept where each family member takes the other family members’ behavior as given. Their goodness-of-fit tests show that the data fit their model reasonably well. While the papers in this literature generally do not provide empirical justification for their theoretical approaches, I agree that a model of conflict is more appropriate for the older family at a stage where children are likely to have families of their own and interests that may conflict with those of their siblings.
Antman 337
C. Theoretical model
I begin by specifying a two-stage game in which individuals make decisions about migration,mi
∈
{
0, 1}
, in the first stage, and subsequently decide on the amount of (private) consumption, ci and their contributions to their parents in terms of time, , and material goods, , with the objective of maximizing utility less some cost ofti gi
migration,Ci(mi,M−i).Ci(mi, M−i)is a decreasing function of the number of mi-grant siblings in the family,M−i= (m1, . . . , mi−1,mi+ 1, . . . , mn),and is equal to zero if the individual does not migrate.6 Thus, the individual maximizes a net utility function, Ui(mi, ci,gi,G−i, ti, T−iZi)−Ci(mi,M−i), subject to a resource con-straint, ci+gi+wti≤wL, where L is the total time allocation,w is the real oppor-tunity cost of time, and I abstract from a labor-leisure choice. I also assume that the time contribution must equal zero if the individual migrates, ti= 0 if mi= 1, and contributions are subject to a nonnegativity constraint.
Note the inclusion of other siblings’ goods contributions, G−i= (g1, . . . , gi−1,
, and their time contributions, , as well
gi+ 1, . . . , gn) T−i= (t1, . . . , ti−1,ti+ 1, . . . , tn)
as the individual contributions,ti andgi, in the utility function. This allows for the possibility that individuals care about the well-being of their parents in terms of how much care parents receive from all of the children as well as how much care indi-viduals personally provide to their parents. Also note that the utility function depends on some individual characteristics,Zi, which include observable and unobservable components, (Xi, εi), but siblings’ characteristics, such as wealth and its determi-nants, are explicitly excluded from both the utility function and the individual’s resource constraint.
As a simplification, we can assume the resource constraint is binding and substi-tute out for the consumption good using the budget constraint to rewrite the indi-vidual’s utility as a function of his own time and goods contributions as well as of his siblings’ contributions:U˜i(mi, gi, G−i,ti,T−iZi). Using backward recursion, I begin with an examination of the second stage in whichM, the vector of migration decisions made by all siblings in the first stage, has been fixed.7The individual then solves:
This maximization problem yields the following best response functions forgiand which are conditional on the migration decision:
ti
6. The costs of migration are likely to be decreasing in the number of migrant siblings since migrant siblings can potentially steer the individual toward cost-saving alternatives, for instance in the areas of transportation, residence, and job search.
338 The Journal of Human Resources
The theories of family interaction laid out in Section IIA have specific implications for the partial derivatives of an individual child’s contribution with respect to the contributions of his siblings. In particular, the derivative is expected to be positive under a theory of competition between siblings, such as the strategic bequest motive. In contrast, it will be negative under a public good theory of behavior and will have no expected relationship if the motive for giving is purely to confer a “warm glow” on the giver.
Solving the equations simultaneously for all siblings determines the continuation equilibrium, the vectors describing each child’s contributions in terms of goods and money as functions of the migration profile in the first stage and the vectors of characteristics for all siblings,
Z= (Z1, . . . , Zn):
* *
G (M, Z), T (M, Z).
Note that estimation of the best response functions will yield inconsistent estimates because of the simultaneity inherent in the problem, that is, siblingi’s contribution is a function of sibling j’s contribution which in turn is a function of sibling i’s contribution. Thus, other siblings’ total contributions,G−i, T−i, will be endogenous in Equations 1 and 2. Fortunately, the nature of the continuation equilibrium points to an econometric solution in the form of exogenous variables that only affect in-dividuali’s contributions through their effect on G−i,T−i. These potential instru-ments are simply the other siblings’ characteristics, Z−i= (Z1, . . . , Zi−1, , which do not enter into the best response function directly.
Empiri-Zi+ 1, . . . , Zn)
cally, the econometrician can thus take the observable component of the character-istics of other siblings and aggregate them to produce instruments for the contri-butions of these siblings:W(X1, . . . , Xi−1, Xi+ 1, . . . , Xn).
Moving to the first stage of the game, individual iwill choose to migrate if his net utility is higher as a migrant than as a nonmigrant. That is, he chooses mito solve
* ˜ * *
max Vi(M, Z) =Ui(mi, G (M,Z)T (M,Z)Zi)−Ci(mi, M−i)
mi∈{0,1}
This yields the following best response function for migration:
m =µ(M ,Z).
(3) i i −i
Solving for the fixed point among all siblings in the family yields the vector which maps characteristics of all siblings into migration outcomes. While it *
M (Z)
would be instructive to estimate the best response function in Equation 3, we would not be able to identify the parameters as we again have an endogeneity problem because of simultaneity, that is, sibling i’s migration is a function of sibling j’s migration which in turn is a function of siblingi’s migration. Unfortunately, in this case, all siblings’ characteristics enter directly into the best response function and therefore cannot be excluded from the equation to be used as instruments. Never-theless, we may still estimate the equilibrium mapping
* *
m =m (Z),
Antman 339
which is a function of all of the siblings’ characteristics. This estimation will prove useful in the robustness section below where I address the concerns arising from selection into migration, with identification based on siblings’ characteristics. While it would also be interesting to go through comparative statics exercises for this particular model, deriving predictions regarding the effects of certain exogenous characteristics is beyond the scope of the current paper and left for further research.
III. Data
A. Description
The data set used in this paper is the Mexican Health and Aging Study (MHAS) for the years 2001 and 2003, the results of a joint project between Mexico’s statistical agency, INEGI, and researchers at the Universities of Pennsylvania, Maryland, and Wisconsin.8 The MHAS is a nationally representative panel data set of Mexicans born before 1950 that began interviewing respondents in 2001 and returned to collect data from the same respondents in 2003. Respondents are asked a range of typical household survey questions regarding their expenditures, income, assets, and labor supply, as well as detailed questions on the health conditions of the sampled person. Basic information is also collected about the children of the sampled person, in-cluding those that live in and outside of the elderly parent’s home. In addition, the MHAS includes data on the migration history of the respondent and whether his children are currently in the United States
For purposes of the analysis presented here, the data set contains detailed infor-mation about financial transfers between the respondent and his children. Inforinfor-mation is also provided on the time children spend helping their parents, but these responses are conditional on the respondents reporting difficulty with “Activities of Daily Liv-ing” (ADLs) which are divided into basic ADLs and higher level “Instrumental Activities of Daily Living” (IADLs).9The basic ADLs involve getting in and out of bed, bathing oneself, using the toilet, eating, and walking across a room. The IADLs involve preparing a hot meal, shopping for groceries, taking medications if needed, and managing money. Because these are the only measures of hourly time contributions in the study, in most of what follows, I limit the sample to families where the parent reported difficulty with at least one ADL or IADL.
Since my sample is conditional on difficulties with ADLs or IADLs, and respon-dents are asked to list the amount of time individuals spend helping them with these tasks, the time contributions made by children in this analysis can be thought of as a measure of critical hourly help. While cutting the data set on this dimension limits the number of observations to around 10 percent of the usable sample, focusing on this restricted group is arguably more appropriate as families with parents with these difficulties are likely to differ considerably from families where the parent is more independent. Thus, the restricted sample can be thought of as a more flexible
spec-8. The MHAS is publicly available at http://www.mhas.pop.upenn.edu/
340 The Journal of Human Resources
ification where I have allowed all effects to vary based on the fact that the parent has difficulties with one or more activities of daily living. I take the five indicators of difficulty with the basic ADLs as particularly important indicators of the parent’s basic ability to provide for himself and also include them as controls in the regression analysis below.
The two main variables of interest provide data on time and financial contributions by children to parents. The financial variable is the result of a series of questions about how much money the child has contributed to the elderly parent over the past 2 years.10Most participants who respond make reference to a monthly allotment; for those who do not, I convert the answer into a monthly average. In addition, some participants were not sure of the amount and were allowed to respond with a pre-specified range of values. Using the continuous data as the empirical distribution, I converted these responses to the mean of the range specified. The time contribution variable is the result of asking how many days in the last month and how many hours per day the child spent helping the parent with any ADLs or IADLs. In addition, if a nonresident child’s spouse or children helped the elderly respondent, the survey records this time contribution as deriving from the child of the elderly parent, so the time contributions can be viewed more broadly as hourly help flowing from the households of the respondent’s children.11While the survey does not collect data on the earnings of children or transfers among children, it does collect basic information on a child’s education, marital status, current migration status, and the number of his children.
B. Descriptive statistics
Table 1 illustrates the summary statistics for the children (also referred to as siblings) who form the units of analysis in this paper. Since the estimation of best response functions requires more than one agent and complete records are needed for indi-viduals and their siblings, I restrict my sample to families where there are at least two siblings with nonmissing data.12Because time contribution data are only col-lected for those parents with difficulties with ADLs, I also limit the sample to fam-ilies where the sampled parent has difficulty with at least one basic or instrumental activity of daily life. This leaves a total number of observations of 5,537 child-year (932 family-year) observations, with around 11 percent currently in the United States13
I focus here on the differences in means between migrants and nonmigrants. Table 1, Panel A shows that on average, migrants are more likely to be male, less educated, slightly younger, have fewer children, and are more likely to be married compared
10. I convert financial data to 2002 Mexican pesos using the national Consumer Price Index from the Banco de Mexico.
11. This caveat actually makes the time contribution more consistent with the financial contribution that certainly stems from the child’s entire household.
12. An alternative approach would be to keep the single-child families and define their “siblings’” contri-butions and characteristics to equal zero. Since there are very few families that are made up of only one child, the IV results are very similar using this approach.
Antman 341
with their nonmigrant counterparts. Perhaps as expected, on average migrants appear to give more financially to their parents than nonmigrants (around 300 pesos relative to 150) and are also more likely to give (32 versus 16 percent). While both these differences are statistically significant, once I condition on giving money to parents, the average contributions of the two groups are very close (938 versus 932) and cannot be statistically differentiated.
In terms of hourly help, in the theoretical model above I assumed that migrants would not be able to give time. The data appear to bear this out, with only 1 percent (six observations) of U.S. migrants giving time to parents in Mexico compared with 13 percent of nonmigrants. Conditional on giving time, nonmigrants also provide many more hours of care than migrants (131 hours relative to 57), justifying the claim that migrants are indeed constrained in providing time care to their elderly parents. Table 1, Panel B shows that parents of migrants appear to receive more financial help from their children compared with parents of nonmigrants, although due to the high variances in contributions the difference is not statistically significant. At the same time, parents of nonmigrant children do receive more hours of care from each of their kids on average relative to parents of migrant children (20.6 hours of care versus 12.4), a result that is statistically significant.
These descriptive statistics point to important differences between parental con-tributions among siblings based on migrant status. While it would be instructive to estimate the best response functions separately by gender as well, due to the small sample size of each group individually, I estimate only on the pooled sample of men and women. I now turn to controlling for observed characteristics and focusing on the question of how children’s contributions respond to those made by their siblings.
IV. Empirical Strategy
A. Best Response Functions
I begin by considering the appropriate estimation of the best response functions as derived in Section II, where I interpret the goods contribution to be in the form of money—the financial contribution. The form of the best response functions derived in Equations 1 and 2 suggests that the empirical estimation should be conditional on migration status, both because (1) constraining the time contribution to be zero for migrants may affect the optimized value of financial contributions and (2) op-portunities and tradeoffs are likely to be different for migrants and nonmigrants. This can also be thought of as allowing for a more flexible functional form for the financial contribution to vary with migration status. Thus, I estimate the following linearized versions of the best response functions.14Since the siblings are assumed to care about the total value of contributions going to the elderly parent, I assume that the contributions of other siblings enter as a sum.
342
The
Journal
of
Human
Resources
Table 1
Descriptive Statistics of Primary Sample
Panel A: Comparison of Migrant and Nonmigrant Children
Combined Sample Nonmigrants Migrants
Female 0.498 0.513 0.375***
(0.500) (0.500) (0.485)
Years of schooling 7.961 8.074 7.053***
(4.414) (4.495) (3.574)
Age 39.924 40.053 38.878**
(11.515) (11.517) (11.451)
Married 0.793 0.788 0.836***
(0.405) (0.409) (0.371)
Number of kids 2.795 2.827 2.539**
(2.283) (2.312) (2.015) Financial help to parent 167.469 150.840 302.277***
(1339.355) (1351.165) (1232.246) Gives financial help = 0/1 0.180 0.162 0.322***
(0.384) (0.368) (0.468) Financial help given financial help > 0 932.874 931.695 937.675
(3047.317) (3249.597) (2031.686) Monthly hours help to parent 15.524 17.370 0.564***
(72.972) (77.098) (7.395) Gives hourly help = 0/1 0.119 0.132 0.010***
(0.324) (0.339) (0.099) Hours help given hourly help > 0 130.439 131.112 57.167**
Antman
343
Panel B: Comparison of Parents of Migrant and Nonmigrant Children
Combined Sample No Migrant Kids At Least 1 Migrant Child
Female 0.690 0.698 0.669
(0.463) (0.459) (0.471)
Years of schooling 3.250 3.503 2.636***
(3.597) (3.654) (3.383)
Age 69.832 69.927 69.599
(11.068) (11.156) (10.867)
Married 0.471 0.452 0.518*
(0.499) (0.498) (0.501) Assets (including value of housing) 268655.600 271548.000 261952.600
(488085.900) (524402.500) (392053.800) Monthly income (excluding children’s contributions) 2156.261 2406.313 1549.518* (7046.120) (7649.008) (5269.276) Total children’s financial help 994.932 886.904 1257.059
(4548.389) (4923.598) (3467.630) Total children’s time help 92.231 97.035 80.574
(196.475) (201.581) (183.330) Total children’s financial help/number of children 196.813 186.482 221.881
(845.238) (887.192) (734.458) Total children’s time help/number of children 18.250 20.642 12.445***
(43.282) (47.531) (29.902)
Number of children 5.941 5.503 7.004***
(2.752) (2.616) (2.788) Number of migrant children 0.652 0.000 2.235
(1.336) (1.606)
Number of parent-period observations 932 660 272
344 The Journal of Human Resources
wherei is the individual subscript andjdenotes the family. The vector of control variables,Xij, includes characteristics of the individual child: a female dummy, birth order, age and age squared, four categorical variables describing education level, a married indicator, and number of children. In addition, I control for variables de-scribing his parent: a parental female dummy, parental married indicator, five indi-cators for difficulties with basic ADLs, parent’s age and age squared, four categorical variables describing the parent’s education level, a year dummy for taking the survey in 2003, and an indicator for residing in a more urban area.
B. Identification
The main empirical problem is that siblings’ contributions are determined simulta-neously, and thus are necessarily endogenous. More generally, this can be thought of as an example of the classic reflection problem illustrated in Manski (1993), wherein the behavior of an individual both affects and is affected by the behavior of a reference group, in this case, his siblings. As Manski points out, it is difficult to tease out the causal effect of the group behavior on the behavior of the individual, because of the presence of endogenous, contextual, and correlated effects within the group.
In Equations 5 through 7 above, it is straightforward to show thatG−i,j will be correlated withuijsinceG−i,jis also a function ofgij. The analog is true for all the variables comprising siblings’ financial contributions as well as time contributions, . As a result, least squares (LS) estimation violates the classical assumptions
T−i,j
and will lead to biased and inconsistent estimates. An added problem is that the decision to migrate may be influenced by the same factors that affect the parental contribution. For now, I treat migration status as predetermined and consider poten-tial migration selection issues in the robustness section below.
To address the endogeneity of siblings’ contributions, I propose a set of instru-ments that are excluded from Equations 5 through 7 but that help to predict the endogenous variablesG−i,jandT−i,j. These are simply the siblings’ characteristics, , since they help to predict and but are not included directly in the
X−ij G−i,j T−i,j
equations determining gij, tij. The identification assumption is that siblings’ char-acteristics only affect individuali’s contributions through and .15
G−i,j T−i,j
In the language of Manski (1993), this requires assuming away the existence of contextual and correlated effects that reflect the exogenous characteristics of other siblings in the group, that is, these variables must correctly be excluded from the individual contribution equation. At first this may appear to be a point of contention as we might expect for an individual’s contribution decision to take his siblings’ characteristics into account. For example, one might expect a child to contribute
Antman 345
more if his brother were poorly educated and presumably less able to contribute.16 One might reason that children may expect their siblings to contribute more out of windfall rather than earned income.17 Ultimately, however, we cannot forget the context of contributing to the welfare of an elderly parent. The view here is that the actual contribution to the elderly parent trumps any reason for siblings’ giving, thus the maintained assumption that the individual’s behavior responds to the contribu-tions of his siblings, and not directly to his siblings’ characteristics. In short, when the individual decides on his parental contribution it does not matterwhyhis siblings are contributing to the extent that they are, it only matters how much they are actually contributing.
In the simple two-sibling family, it is easy to see that the instrumental variables are just the personal characteristics of the other sibling. In a many-sibling family it would be some aggregate function of the other siblings’ characteristics. In particular, I use the sum of siblings’ characteristics that can be motivated through some re-duced-form algebra (Antman 2010c). The instrumental variables I use are the ana-logues of the individual-level covariates, but as they relate to the other siblings.18 They are: (1) number of sisters, (2) number of siblings in each of four education categories, (3) sum of ages of siblings (and sum of squared ages), (4) sum of children of other siblings, (5) number of married siblings, (6) total number of siblings, and (7) sum of birth orders of other siblings.
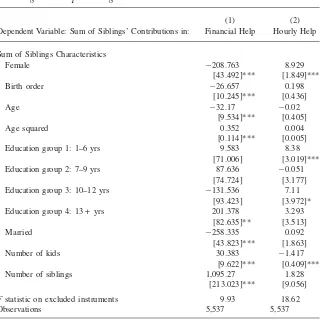
Since the IV strategy relies critically on the strength and validity of the instruments used, Appendix Table A1 presents the first stage LS regression results where the dependent variables are the sums of the siblings’ contributions and the regressors of interest are the sums of the siblings’ characteristics. In general, siblings’ character-istics appear to affect siblings’ contributions in the expected ways, for example, having more sisters implies a lower sibling financial contribution and higher sibling hourly contribution. Many of the coefficient estimates are statistically significant at the 1 percent level, reflecting the predictive power of the instrumental variables individually and theFstatistic on the excluded instruments is 9.93 in the financial help regression and 18.62 in the regression predicting siblings’ hourly help.
The estimation strategy thus amounts to estimation of Equations 5 through 7 where I account for the endogeneity of siblings’ contributions by estimating:
T =Z a +ε
(8) −i,j ij 1 ij
G =Z a +ς .
(9) −i,j ij 2 ij
Due to a high fraction of zeros in both time and financial contributions, some might argue a Tobit specification would be more appropriate for estimating Equations 5 through 7. The standard maximum likelihood estimation, however, is
computa-16. A related concern, addressed in the data section above, is that children’s contributions to their parents may mask contributions among siblings directly. Unfortunately, the MHAS data has no information to bear on this question.
17. See Jakiela (2009) for experimental evidence on individuals’ willingness to transfer out of earned versus unearned income to an anonymous partner.
346 The Journal of Human Resources
tionally difficult due to the inclusion of multiple endogenous variables. Instead, I use two-step estimation inspired by Rivers and Vuong (1988) and Smith and Blun-dell (1986), as detailed in Wooldridge (2002, p.530). The first step amounts to es-timation of Equations 8 and 9 via LS and then inserting estimated residuals from those regressions into Tobit estimation of Equations 5 through 7. I bootstrap the standard errors, clustering at the family level, using 500 replications. For those read-ers who would argue that the Tobit model is not appropriate since there is no real censoring here, only true zeros, I also include LS estimates throughout.19 Finally, for those who remain skeptical of the IV approach, I include the results from fixed-effects models in Section VIB.
V. Results
A. Best Response Functions
The results from estimation of the best response functions for children’s contribu-tions can be found in Table 2. For comparison with the IV estimates, Panel A documents the results from a regression that neglects to account for the endogeneity of siblings’ contributions with each column representing estimates from Equations 5 through 7. In general, the signs of both the Tobit and LS estimates agree with the former being somewhat larger in magnitude.
The results from Table 2, Panel A suggest that not accounting for the endogeneity of siblings’ contributions would lead us to believe that siblings’ financial contribu-tions are strategic complements, but otherwise generally give mixed results. A Haus-man test of the exogeneity of the siblings’ contributions variables shows that for nonmigrants’ financial and hourly contribution equations, we can reject the null of the exogeneity of siblings’ financial and hourly contributions.
Table 2, Panel B shows the results from the analogous IV linear and IV Tobit estimations.20 Column 1 shows that a 100 peso increase in siblings’ contributions leads to a statistically significant six-peso increase in the financial contribution for the individual migrant child (Column 1) and an increase in about 12 pesos for the nonmigrant child (Column 2). While the magnitude of the response is not very large compared with the levels of financial contribution seen in the summary statistics above, the positive relationship is consistent with strategic complementarity in fi-nancial contributions for both migrants and nonmigrants.
At the same time, Table 2, Panel B shows that the cross-effects between financial and time contributions across siblings are negative. Specifically, an increase in one hour of siblings’ total time contribution leads to a decrease of almost one peso in the individual nonmigrant contribution in the IV linear specification (Column 2) and 9 pesos in the IV Tobit estimation (Column 5). Using the 2000 Mexican Census,
19. See Maddala (1983, Chapters 1 and 6) for a discussion of truncation versus censoring.
Antman 347
Hanson (2003) reports an average hourly wage close to 17 pesos per hour,21 sug-gesting that the latter estimate is on a reasonable scale relative to the prevailing opportunity cost of time. On the flip side, the IV linear estimate shows a statistically insignificant drop in hours in response to a rise in siblings’ financial contributions (Column 3), but the IV Tobit estimate is statistically significant and close in mag-nitude (−0.06 in Column 6).
Finally, the hourly contribution response estimates in Table 2, Panel B show that time contributions are strategic substitutes. Both estimation methods show a statis-tically significant drop in individual hourly help with a rise in siblings’ hourly help. The IV linear estimate suggests a rise in one hour of siblings’ help results in a fall in 0.1 hours of individual help (Column 3) and the IV Tobit estimate implies a substitution ratio that is closer to one-for-one (Column 6).
Although these estimates may seem small in terms of the degree of strategic responsiveness they imply, it is important to remember that a substantial fraction of children give nothing to their parents at all (Table 1). Consequently, inducing an exogenous change in siblings’ contributions, even with the small magnitudes of the associated coefficients observed here, could be sufficient to move an individual child into the upper tails of the distribution of individual contributions. For example, the IV estimates in Table 2, Panel B, Columns 2 and 3, imply that holding all else equal, an increase in siblings’ contributions from the 25th percentile to the 75th percentile for nonmigrants (about 630 pesos) would induce an increase in the nonmigrant individual contribution by about 72 pesos, a value that is above the 75th percentile of individual nonmigrant contributions. Similarly, increasing siblings’ hourly help from the 25th to the 75th percentiles for nonmigrants (about 60 hours) would imply a decrease in individual hourly contributions of over 6 hours, which is also beyond the 75th percentile of the distribution of individual hourly contributions for non-migrants. Thus, the estimates seen here can potentially be interpreted as speaking to the greater impact siblings’ contributions can have on inducing individuals to make any contributions toward their parents, when the majority of individuals make none. While a test of overidentifying restrictions is not straightforward in the IV Tobit estimates, in two of the three IV linear specifications we fail to reject the null of instrument validity at conventional levels. The reasonable magnitudes of the esti-mates in relation to the opportunity cost of time also support the credibility of the results. Of course, this is no guarantee that the identification strategy has worked as intended and further robustness checks will be presented below.
B. Interpretation
Overall, the results from the best response functions suggest that siblings’ financial contributions are strategic complements for both migrants and nonmigrants while time contributions appear to be strategic substitutes. In addition, the cross-effect between siblings’ financial and time contributions points to substitution across sib-lings. One notable concern is that the complementarity result is being driven simply
348
The
Journal
of
Human
Resources
Table 2
Best Response Functions
Panel A: Assuming No Endogeneity
(1) (2) (3) (4) (5) (6)
Migrants Nonmigrants Nonmigrants Migrants Nonmigrants Nonmigrants LS LS LS Tobit Tobit Tobit Financial
Help
Financial Help
Hourly Help
Financial Help
Financial Help
Hourly Help
Financial help from other siblings 0.120 0.099 −1.01E-04 0.215 0.190 −2.27E-04 [0.016]*** [0.004]*** [2.55E-04] [0.035]*** [0.013]*** [1.44E-03] Hourly help from other siblings −0.523 −0.007 −0.007 −1.691 0.909 0.018
[0.335] [0.104] [0.006] [0.933]* [0.427]** [0.030]
p-value from test of exogeneity 0.520 0.090 0.000 0.942 0.000 0.000 Number of observations 608 4,929 4,929 608 4,929 4,929
Panel B: Instrumental Variables
(1) (2) (3) (4) (5) (6)
Financial help from other siblings 0.062 0.115 −0.008 0.170 0.024 −0.057 [0.023]*** [0.032]*** [0.005] [0.210] [0.201] [0.016]*** Hourly help from other siblings 0.349 −0.92 −0.107 −1.926 −8.509 −1.149
[0.893] [0.345]*** [0.053]** [4.419] [4.420]* [0.232]*** Chi-squarep-value from overid test 0.341 0.026 0.641
Antman
349
Panel C: Smaller Instrument List
(1) (2) (3) (4) (5) (6)
Financial Help from Other Siblings 0.140 0.100 −0.005 0.709 0.215 −0.052 [0.101] [0.033]*** [0.004] [0.795] [0.291] [0.019]*** Hourly Help from Other Siblings −1.007 −1.124 −0.112 −6.995 −11.076 −1.418
[2.055] [0.475]** [0.059]* [12.014] [5.587]** [0.271]*** Chi-squarep-value from overid test 0.022 0.423 0.446
Number of Observations 608 4929 4929 608 4929 4929
Standard errors in brackets. * significant at 10 percent, ** significant at 5 percent, *** significant at 1 percent.
350 The Journal of Human Resources
by unobserved family heterogeneity, for instance if all children in a given family were treated better in childhood and felt compelled to return the favor to their parent in old age. While I address family-level heterogeneity below, the results above al-ready make this simple scenario unlikely since it cannot explain why the strategic relationship between time contributions would work in the opposite direction as financial contributions.
Instead, the distinction between the complementarity of financial contributions across siblings and the substitutability of time contributions could point to the pos-sibility that children expect their parents will mainly consider financial contributions when they make bequest decisions at the ends of their lives. The fact that the mag-nitude of complementarity is generally higher for nonmigrants may reflect the fact that some fraction of migrants do not plan to return home, and thus inherently have a weaker bequest motive. While limited information is available regarding bequest intentions from only a small sample of elderly respondents, those who report their children will benefit upon their death are asked to specify which child will benefit the most. Compared with their siblings, the children who are reported to benefit the most are reported to give more in financial contributions toward their elderly parents, although the difference (around 185 pesos) is not statistically significant.
Some may question whether it makes sense for a bequest motive to operate in relatively poor populations where parents are observed to receive financial assistance from their children. If parents are planning on leaving bequests to their children, couldn’t they use the bequest for financing current consumption, and thus eliminate the need for financial help? The illiquidity of the assets available to parents provides a logical solution to this seeming paradox. Although more than 40 percent of parents report zero nonhousing related assets, almost 84 percent report that the housing unit in which they reside is their own property that they either own outright or are paying off. At the same time, about 10 percent of respondents report that there is no title for the property, underscoring the likelihood that the main asset is illiquid. While the survey does not ask explicitly how respondents came to acquire their home, they do ask whether the property was inherited. Almost 20 percent of the respondents answering this question report that either they, their spouse, or both of them jointly inherited the property, thus alluding to the possibility that their children will poten-tially inherit property as well.
Of course, the value of the land is still open to question, and a bequest motive would certainly be a more convincing explanation if the potential inheritance were more valuable. A related concern is that land that is illiquid may be of even less value to migrants if they do not plan to return home and make use of it. Thus, while there is empirical support for the proposition that a bequest motive could hold even among a poor population, I cannot rule out the possibility that children compete for some other reward, such as affection or admiration from their parents, who may more readily acknowledge financial contributions if they are especially poor.
VI. Robustness
A. Instrument Validity
Antman 351
not be valid instruments if the individual takes them directly into account when making decisions about his own parental contribution. Because the equations being estimated are actually overidentified in terms of the number of instruments, one way to address this critique is to limit the set of instrumental variables to an arguably more exogenous set. The results from the IV linear and IV Tobit estimates using the smaller IV set (number of sisters, sum of siblings’ birth orders, sum of siblings’ ages and squared ages, and the number of siblings) can be found in Table 2, Panel C.
Overall, both the signs and magnitudes of the estimates are very similar, sug-gesting that the use of the additional instrumental variables does not dramatically affect the results. For instance, the IV Tobit specification with the smaller IV set shows statistically significant results for the hourly contribution equation correspond-ing to a drop in 5.2 hours of individual time help in response to an increase in siblings’ contributions of 100 pesos compared with a drop of 5.7 hours in the spec-ification with the full IV set. Similarly, the results from the IV Tobit specspec-ification using the smaller IV set show a drop in 1.4 hours in response to an increase of one hour in siblings’ time help relative to a drop in 1.1 hours using the larger instrument set. As with the full IV set, in two of the IV linear specifications for the smaller instrument set, the results of the overidentification test suggest that we can fail to reject the null of instrument validity. Nevertheless, one might argue that the test is less informative in this case since the instruments are all capturing features of fertility and birth spacing.
A related concern with the smaller set of instruments is that in larger families age differences between siblings may be so dramatic that parents may actually observe the earnings potential of older children and adjust their fertility accordingly. Unsur-prisingly, the age difference between the oldest and youngest siblings in these large families is considerable and close to 17 years on average. It is important to note, however, that although some children may even reach their early twenties before a parent is no longer fertile, this is likely to be well before the age at which a parent must rely on his children for support. Thus, as Ray (1998, p.314) points out, un-certainty may remain regarding whether children will support parents in old-age. Consequently, fertility choices are not likely to be conditional on the current per-formance of older children.
B. Intrafamily Correlation and Family-level Heterogeneity
Another possibility that may cast doubt on instrument validity is the possibility that since the instruments are based on siblings’ characteristics, they may in fact be capturing some heterogeneity at the family level in the disturbance term of the equation determining individuali’s contribution. For example, the education of in-dividuali’s siblings may be correlated with some unobserved family effect that could be correlated with individuali’s contribution. A related possibility is that an unob-served family effect, such as a good parent, or a positive childhood experience, drives all children to behave in a similar manner, biasing the estimates toward a finding of strategic complementarity.
352 The Journal of Human Resources
component that might be correlated across siblings and with siblings’ contributions.22 Although this would not generally address concerns that siblings’ characteristics influence individual contributions directly, the family fixed effect would be allowed to capture some of the positive correlation in siblings’ contributions due to house-hold-level norms that we might mistakenly have interpreted as strategic comple-mentarity. Once contributions have been differenced from the average level of con-tribution in a given family using the fixed effects estimator, we can then more readily interpret the association between the remainder of one sibling’s contribution and the remainder of his sibling’s contribution as a strategic response. With purely cross-sectional data, however, introducing family fixed effects in reaction functions of one individual’s contribution as a function of his siblings’ contributions would effectively amount to introducing perfect multicollinearity into the estimation.23 Instead, one must have panel data to estimate the best response functions with family fixed effects and, importantly, identification rests on variation in the instrumental variables over time. This amounts to relying on a subset of the instrumental variables that poten-tially vary over time including age, education, marital status, and the number of children.
Although panel estimation is possible because the MHAS was designed to observe families at two points in time, rather critically, the elderly parent must suffer from an ADL in both periods to obtain data on time contributions, thus the number of observations drops dramatically when moving to panel analysis. Since children’s financial contributions are collected for the full sample of elderly parents, one al-ternative is to focus on the panel sample and define time contributions to equal zero if the parent reports no difficulty with any activities of daily living. This is akin to interpreting the time help as critical hourly help, where parents who have no critical needs by definition receive no critical hourly assistance.
The results from the fixed-effects estimation can be found in Table 3. A Tobit model with fixed effects is computationally difficult, so I focus on the linear esti-mates here. Panel A provides LS-FE and LS estiesti-mates using the panel sample for comparison purposes, while the FEIV and IV linear results for the panel sample appear in Panel B.24Comparing the results with and without fixed effects, we see that for the most part the estimates are similar in sign and magnitude. This suggests that unobserved family-level heterogeneity is not a major factor confounding the results and thus casts doubt on the view that the instrumental variables are simply picking up a family-specific component in the error term.
Although the FEIV results are not statistically significant, all of the statistically significant coefficients from the LS-FE model (Table 3, Panel A) are very close to the estimates from the IV model in Table 2, Panel B. These results add credence to the IV estimates from above and suggest that the IV and FE models may be
alter-22. The instrumental variables-fixed effects strategy is employed a great deal in the spatial regression literature to estimate strategic interaction among governments. Anselin (2002) and Brueckner (2003) pro-vide overviews of the empirical issues and literature. Fredriksson and Millimet (2002) consider an appli-cation with regard to environmental policy.
23. To see this, difference each variable on both sides of Equation 5 from the mean of each variable over all siblings.
Antman 353
native methods of estimating the best response functions. This interpretation is bol-stered by the fact that in the LS-FE model, we easily reject the null that the family fixed effects are all equal to zero, while in the FEIV regressions on nonmigrants, we fail to reject the null that the family fixed effects are equal to zero. Thus, it may be that the family fixed-effects may not be useful once the IV strategy is imple-mented. In addition, the fact that the results are similar on a broader sample which is not conditional on ADL difficulties suggests that the strategic behaviors observed above are not limited to families with particularly vulnerable parents.
C. Attrition
One concern in relying on the estimates from above may be nonrandom attrition from the survey. To check the extent to which this may be a problem, Table 4, Panel A reports estimates based solely on the 2001 sample, the initial year of the MHAS, for both the IV linear and IV Tobit specifications on the sample of parents with ADL difficulties. Overall, the statistically significant results from the 2001 sample match up closely with the results from the initial sample (Table 2, Panel B) in both sign and magnitude. These robustness checks support the findings that financial contributions are strategic complements across siblings and time contributions are strategic substitutes while providing suggestive evidence that the best response es-timates stand up well to critiques of instrument exogeneity, family-level heteroge-neity, and nonrandom attrition.
D. Selection into Migration
Thus far, I have been operating under the assumption that migration is predetermined and ignoring any possible selection issues. However, if migration status and the unobservable component of contributions were somehow correlated, dividing the sample by migration status would introduce a selection term into the best response functions. For instance, we might be concerned that migrants emerge from a group of people who are not close to their families, so they are more likely to migrate and give less to their parents.
As with the Heckman two-step procedure, to address the omitted selection term I use estimated inverse Mills’ ratios which are found from probit estimation on .25From the theoretical section above, a suitable equation predicting migration is
mij
the equilibrium mapping in Equation 4, m*=m*(Z), where migration status is a
i i
function of all siblings’ characteristics. Thus, the inverse Mills’ ratios can be derived from the migration equation estimated via probit:
m =1(Zδ+ε > 0),
(10) ij ij
where1is the indicator function.
Although migration does not affect the observability of financial contributions, estimating Equations 5 and 6 separately for migrants and nonmigrants also requires the inclusion of a selection term to account for the split sample. Thus, to address
354
The
Journal
of
Human
Resources
Table 3
Robustness to Intra-Family Correlation & Family-Level Heterogeneity
Panel A: Least Squares with and without Family Fixed Effects on Panel Sample
(1) (2) (3) (4) (5) (6)
Migrants Nonmigrants Nonmigrants Migrants Nonmigrants Nonmigrants LS FE LS FE LS FE LS LS LS Financial
Help
Financial Help
Hourly Help
Financial Help
Financial Help
Hourly Help
Financial help from other siblings 0.022 0.170 5.25E–06 0.025 0.218 −3.68E–06 [0.006]*** [0.004]*** [5.72E–05] [0.032] [0.053]*** [8.97E–06] Hourly help from other siblings 0.544 −0.005 −0.162 −1.200 0.047 0.038
[2.161] [0.598] [0.008]*** [1.190] [0.096] [0.022]* Family fixed effects YES YES YES NO NO NO Number of families 284 863 863
p-value from test that FE = 0 0.000 0.000 0.000
Antman
355
Panel B: Instrumental Variables with and without Family Fixed Effects on Panel Sample
(1) (2) (3) (4) (5) (6)
Migrants Nonmigrants Nonmigrants Migrants Nonmigrants Nonmigrants FEIV FEIV FEIV IV Linear IV Linear IV Linear Financial
Help
Financial Help
Hourly Help
Financial Help
Financial Help
Hourly Help
Financial help from other siblings −0.06 0.183 −0.002 0.014 0.136 −0.002 [0.112] [0.196] [0.003] [0.028] [0.098] [0.002] Hourly help from other siblings 12.565 −1.451 0.359 −4.019 −3.08 0.038
[19.016] [12.457] [0.218] [4.478] [2.377] [0.092] Family fixed effects YES YES YES NO NO NO Number of families 284 863 863
p-value from test that FE = 0 0.000 0.927 1.000
Number of observations 1,198 7,626 7,626 1,198 7,626 7,626
Standard errors in brackets. * significant at 10 percent, ** significant at 5 percent, *** significant at 1 percent. Robust standard errors clustered at family level reported in Panel A, Columns 4–6 and Panel B, Columns 4–6.
356
The
Journal
of
Human
Resources
Table 4
Additional Robustness Checks
Panel A: Robustness to Attrition—2001 Sample only
(1) (2) (3) (4) (5) (6)
Migrants Nonmigrants Nonmigrants Migrants Nonmigrants Nonmigrants IV Linear IV Linear IV Linear IV Tobit IV Tobit IV Tobit
Financial Help
Financial Help
Hourly Help
Financial Help
Financial Help
Hourly Help
Financial help from other siblings 0.078 0.136 −0.005 0.191 0.201 −0.042 [0.023]*** [0.027]*** [0.004] [0.258] [0.224] [0.018]** Hourly help from other siblings 0.729 −0.968 −0.128 −1.182 −7.998 −1.31
[0.816] [0.453]** [0.068]*** [4.107] [5.524] [0.358]*** Year of sample 2001 2001 2001 2001 2001 2001
Antman
357
Panel B: Robustness to Migrant Selection
(1) (2) (3) (4) (5) (6)
Migrants Nonmigrants Nonmigrants Migrants Nonmigrants Nonmigrants IV Linear IV Linear IV Linear IV Tobit IV Tobit IV Tobit
Financial Help
Financial Help
Hourly Help
Financial Help
Financial Help
Hourly Help
Financial help from other siblings 0.059 0.122 −0.008 0.097 0.026 −0.058 [0.134] [0.027]*** [0.003]*** [0.213] [0.202] [0.016]*** Hourly help from other siblings 0.281 −0.921 −0.107 −7.465 −8.509 −1.15
[2.086] [0.392]** [0.040]*** [6.098] [4.421]*** [0.233]*** Inverse Mills’ Ratio for migrants −85.653 −2,640.03
[446.203] [2,067.988] Inverse Mills’ Ratio for
nonmigrants
−113.747 30.223 −301.221 167.33
[159.408] [28.206] [1,774.258] [150.394] Selection corrected YES YES YES YES YES YES Number of observations 608 4,929 4,929 608 4,929 4,929
Standard errors in brackets. * significant at 10 percent, ** significant at 5 percent, *** significant at 1 percent.
358 The Journal of Human Resources
the possibility of a correlation between selection into migration and the child’s con-tribution, I include the selection term for migration or nonmigration into each best response function as appropriate. Because of the nonlinear Tobit estimation, the most appropriate way to account for selection into migration would be via maximum likelihood. The selection problem coupled with the multiple endogenous variables, however, makes maximum likelihood estimation intractable. Instead, I present the results from the IV linear regressions of best response functions with selection terms. This amounts to Equations 5 through 7 withλˆ included as a regressor in equation1
ij
5 and λˆ0 included as a regressor in Equations 6 and 7, where λˆ1=ϕ(Z) is the
ij ij
Φ(Z) estimated inverse Mills’ ratio term associated with migration from probit estimation of Equation 10 andλˆ is the inverse Mills’ ratio term associated with selection into0
ij
nonmigration from an analogous probit equation predicting nonmigration. Because the inverse Mills’ ratios are generated regressors, I bootstrap standard errors clus-tered at the family level using 500 replications. Note that this strategy does not rely simply on functional form for identification. Rather, the variables that identify mi-gration independently of individual contributions are the same set of instrumental variables used to identify siblings’ contributions, but as we have more than three instruments, we are still overidentified. For reference, the results from probit esti-mation of Equation 10 can be found in Table A2 of the Appendix where it can be seen that the signs of the coefficients are generally as expected.
The results from the IV linear regressions accounting for selection and endoge-neity of contributions can be found in Table 4, Panel B. While the point estimates are not all statistically significant, the signs of the coefficient estimates are consistent with previous findings of strategic complementarity in siblings’ financial contribu-tions and strategic substitution in hourly contribucontribu-tions. Comparing these sets of linear results with those from above, we also see very little change in the magnitude of the estimates after including the selection terms. This is relatively unsurprising given that the selection terms fail to be statistically significant in any specification. These results provide suggestive evidence that if selection into migration exists, it is of second-order importance in determining parental contributions and does not affect the findings of strategic complementarity for siblings’ monetary contributions and strategic substitution for siblings’ time contributions.
VII. Conclusion
The results from estimating the best response functions for children’s contributions toward their elderly parents suggest that for both migrants and non-migrants, financial contributions function as strategic complements while siblings’ time contributions operate as strategic substitutes. At the same time, it appears chil-dren substitute for their siblings’ time contributions with their own financial contri-butions and vice versa. This mixture of results provides a blended picture of the model which best describes family interaction.