Full Terms & Conditions of access and use can be found at
http://www.tandfonline.com/action/journalInformation?journalCode=vjeb20
Download by: [Universitas Maritim Raja Ali Haji] Date: 12 January 2016, At: 23:50
Journal of Education for Business
ISSN: 0883-2323 (Print) 1940-3356 (Online) Journal homepage: http://www.tandfonline.com/loi/vjeb20
Benchmarking Financial Assessment in the
Strategy Course: A Qualitative and Quantitative
Template
Kenneth E. Aupperle & Steve Dunphy
To cite this article: Kenneth E. Aupperle & Steve Dunphy (2003) Benchmarking Financial Assessment in the Strategy Course: A Qualitative and Quantitative Template, Journal of Education for Business, 78:4, 205-212, DOI: 10.1080/08832320309598602
To link to this article: http://dx.doi.org/10.1080/08832320309598602
Published online: 31 Mar 2010.
Submit your article to this journal
Article views: 21
Benchmarking Financial
Assessment in the Strateav Course:
~ ~~zyxwvutsrqponmlkjihgfedcbaZYXWVUTSRQPONMLKJIHGFEDCBA
U #
A
Qualitative and Quantitative
Template
KENNETH E. AUPPERLE
zyxwvutsrqponmlkjihgfedcbaZYXWVUTSRQPONMLKJIHGFEDCBA
The
Universityof Akron
Akron, Ohio valuating performance, whether of
E
publicly traded firms or the employees working in them, is never easy. Even evaluation of the perfor- mance of various products as pervasive as PCs, sports cars, cell phones, and low-tech washing machines entails many variables that must be factored in and controlled. Assessing a given indi- vidual’s performance is even more com- plicated, given all the human qualities of both the assessor and assessee. It is an annual rite of nonunion employees and professionals to complain about their performance evaluations and the associated merit raises. Yet the motiva- tion theory that addresses the issue of equity is alive and well despite manage- rial implementation hurdles.At the level of the firm, assessing cor- porate performance is even more prob- lematic. Though business schools typi- cally portray corporate financial assessment as a straightforward matter, the reality hardly could be more differ- ent. Attempting to assess firm perfor- mance through a maze of quantitative statistics is likely to leave the evaluator far short of the basic objective that Ezra Solomon laid down in 1963.
In his seminal 1963 text, Solomon argued that the financial analyst’s task is to evaluate the change in a firm’s health and wealth from one year to the next. He emphasized that reliance on quanti-
STEVEDUNPHY
Shippensburg
Universityof Pennsylvania
Shippensburg, PennsylvaniaABSTRACT. In this article, the authors present a financial assessment template for Strategic Management and Finance courses. The template is par- ticularly useful in capstone Strategic Management courses that rely on finan- cial analysis for strategic analysis, strategy evaluation, discussion, and debate. The template facilitates a quali- tative and quantitative assessment of multiple performance criteria through a multistage benchmarking process and
significantly extends the framework of
zyxwvutsrqponmlkjihgfedcbaZYXWVUTSRQPONMLKJIHGFEDCBA
an earlier benchmarking template pub-lished in the
zyxwvutsrqponmlkjihgfedcbaZYXWVUTSRQPONMLKJIHGFEDCBA
Journal of Education forzyxwvutsrqponmlkjihgfedcbaZYXWVUTSRQPONMLKJIHGFEDCBA
Business a few years ago.tative indices alone cannot produce a reasonably sound and thorough portrait of organizational health and perfor- mance. Hard numbers may suggest one thing, but the more important intangi- bles can reveal something very differ- ent. Certainly, the recent Enron case highlighted the need for analysts to look more closely at the intangibles. If finan- cial analysts had spent more time deal- ing with qualitative issues at Enron, Wall Street might have better managed the fallout and disruptions caused by Enron’s demise.
Despite those observations, our focus in this study was both academic and pragmatic. Our particular concern was the frequent frustration that Strategic Management and Business Policy facul- ty members have in teaching business students to provide good financial
analyses in their comprehensive case studies. Consequently, we sought to describe a practical tool, a financial template, that would help faculty mem- bers upgrade their students’ financial acumen in conjunction with their case- work. The article updates an earlier study, “Assessing Financial Perfor- mance in the Capstone, Strategic Man- agement Course: A Proposed Template” (Aupperle & Sarhan, 1995), published in the Journal of Education for Busi- ness. We present a financial benchmark- ing template designed to be comprehen- sive and holistic: It is comprehensive in that it combines quantitative and quali- tative measures of financial perfor- mance, and it is holistic because it takes into account multiple criteria within the context of several stages of benchmark- ing. In this article, we significantly extend the logic and usefulness of the earlier template.
Financial analysis is not the straight- forward process that it is often assumed to be; in fact, it can be very complicated and perplexing. Sometimes the financial analyst can feel that he or she has entered a world reminiscent of Alice in
Wonderland or a Franz Kafka novel. In addition to accounting for the typical problem of performance “lag effects,” he or she must be able to recognize many accounting oddities intuitively.
For instance, different accounting
MarcWApril2003 205
procedures can apply in a comparison of
two firms in the same industry. One
zyxwvutsrqponmlkjihgfedcbaZYXWVUTSRQPONMLKJIHGFEDCBA
firm
may be using “last in first out” (LIFO) accounting, whereas the other may be using “first in first out” (FIFO). One firm might choose to use accelerated depreci- ation, whereas the other might not; and one firm might close its books at year’s end, whereas the other may close at midyear. The balance sheets can also pose difficulties because human resources typically are not reported as accounting assets. Income statements can be misleading because management is allowed considerable flexibility for recording when revenue is generated. This flexibility can result in revenue being reported later (a quarter later) or sooner (a quarter sooner), depending on the organization’s need to smooth out its performance for investors on Wall Street. Furthermore, the comparative process can be complicated by the diversifica- tion of competing firms. For example, Coke and Pepsi compete with each other, but the former is tightly focused on beverages and the latter embraces snack foods. It is difficult to find two f m s that can be compared in an “apple- to-apple’’ manner; rather, such compar- isons are usually “apple-to-orange’’ or even “grape-to-grapefruit.” In other words, the analytical process is fraught with many demons that can produce a
phantasmagoric experience.
zyxwvutsrqponmlkjihgfedcbaZYXWVUTSRQPONMLKJIHGFEDCBA
A Template for Assessing Total Corporate Financial Performance
In this article, we sought to offer a pragmatic and reasonably comprehen- sive approach for the strategic manage- ment student attempting to assess cor- porate financial performance while taking advantage of the explosion of free, financial information now avail- able over the Internet. In addition, we made an effort to link the philosophical arguments of Solomon to the compre- hensive and holistic perspective repre- sented by our benchmarking template. Solomon (1 963) suggested that profit maximization is, by itself, a limited
means for assessing performance.
zyxwvutsrqponmlkjihgfedcbaZYXWVUTSRQPONMLKJIHGFEDCBA
As analternative, he proposed assessment of the process of wealth maximization- an approach that “reflects the most effi- cient use of society’s economic
206
zyxwvutsrqponmlkjihgfedcbaZYXWVUTSRQPONMLKJIHGFEDCBA
Journal of Education for Businessresources and thus leads to a maximiza- tion of society’s economic wealth” (p.
24). He stated that the essential question
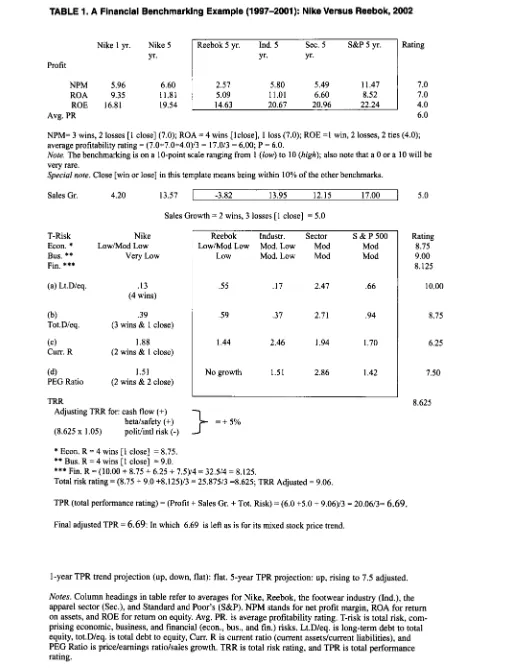
for the analyst assessing corporate financial performance is whether the firm is historically and qualitatively “wealthier” and more valuable currently than previously. The wealthier firm con- ceivably can generate relatively low profitability ratios and still be well posi- tioned for the future. He intuitively acknowledged the existence of perfor- mance “lag effects” and their ability to mask the reality of current performance. In Table 1, we present a benchmark- ing template using Nike as the example base firm. The template addresses Solomon’s concern regarding the status of “today versus yesterday” by compar- ing a company’s 5-year average with its most recent 1-year average. In other words, the column labeled “Nike 5 yr.” in Table 1 is to be compared with all
other columns. The column labeled “Nike 1 yr.” and the columns represent- ing 5-year averages of other groups besides Nike are the benchmarks for the column labeled “Nike 5 yr.” It should be observed that all of the columns dis- played in the template represent 5-year averages except for the “Nike 1 yr.” col- umn. In addition, the “Nike 1 yr.”column numbers should show an improvement over the “Nike 5 yr.” column numbers because the former represents recent (12-month) performance. The template design takes into account the emphasis that stockholders, investors, and other financial stakeholders place on recent improvements in performance, not merely on a long-term upward trend.
The next analytical step is to compare the “Nike 5 yr.” column (the base col- umn) with the “Reebock 5 yr.” column, which represents the performance of the firm’s most significant and typically most important competitor (or competi- tors) over a 5-year period. Next, the base column is compared with the “Ind. 5 yr.” column, which represents the per- formance of the firm’s industry (in Nike’s case, the footwear industry) over the 5-year period. The next column rep- resents the 5-year average of the firm’s sector (in Nike’s case, the footwear and apparel sector), and the next represents
the 500 firms from which the Standard
zyxwvutsrqponmlkjihgfedcbaZYXWVUTSRQPONMLKJIHGFEDCBA
& Poor’s 5-year average is derived.The purpose of the template is to help the analyst produce a bottom line rating for a given firm’s overall attractiveness. The 10-point performance rating scale ranges from 1-2 (very poor), 3-4
(poor), 5-6 (fair), 7-8 (good), and 9-10 (superior). Students and analysts are cautioned to refrain from awarding too many 0s or 10s because these points represent absolutes on the scale.
The reduction of a firm’s overall per- formance to a single score or number requires a consideration of multiple per- formance criteria, both quantitative and qualitative. The bottom line score reflects a complex assessment process combining profit, sales growth, and risk analysis and in which each performance variable is taken through various stages of benchmarking.
We recognize that many factors con- tribute to making financial assessment amazingly complicated and, at times, an impenetrable quagmire. However, our concern is to move as quickly as possi- ble to the template itself.
Financial Performance Criteria
To select the performance criteria for the framework depicted in Table 1, we relied in part on the classic texts of Solomon (1963) and Weston and Brigham (1975) and recent material on general financial analysis from Value- Line (2003), Forbes, Standard & Poor’s
(S&P), and the Internet. The framework is based, in particular, on Multex Investor’s (multexinvestor.com, former- ly known as marketguide.com) ratio analysis reports. That Web site presents a group of easy-to-read tables indicat- ing how a selected company measures up against itself as well as its industry, the sector, and the S&P 500. In this
manner, it simplifies the process of determining whether the firm being analyzed is a leader or a laggard. To make this determination through the enclosed template, one considers three broad types of performance criteria: (a) profitability ratios, (b) sales growth rates in terms of percentages, and (c) total risk orientation. Before explaining these broad types of criteria, the Web site provides directions for accessing the Multex Investor comparison reports on the Internet.
TABLE 1. A Financial Benchmarking Example (1997-2001): Nike Versus Reebok, 2002
zyxwvutsrqponmlkjihgfedcbaZYXWVUTSRQPONMLKJIHGFEDCBA
Nike 1 yr.
zyxwvutsrqponmlkjihgfedcbaZYXWVUTSRQPONMLKJIHGFEDCBA
NikezyxwvutsrqponmlkjihgfedcbaZYXWVUTSRQPONMLKJIHGFEDCBA
5 Reebok 5 yr. Ind. 5 Sec. 5 S&P 5 yr. Y'. Yr. YC.Profit
Rating NPM 5.96 6.60
ROA 9.35 11.81 ROE 16.81 19.54
7.0 7.0 4.0 6.0 2.57 5.80 5.49 1 1.47
5.09 11.01 6.60 8.52 14.63 20.67 20.96 22.24
NPM= 3 wins, 2 losses [l close] (7.0); ROA = 4 wins [lclose], 1 loss (7.0); ROE =1 win, 2 losses, 2 ties (4.0);
average profitability rating = (7.0+7.0+4.0)/3 = 17.0/3 = 6.00; P = 6.0.
zyxwvutsrqponmlkjihgfedcbaZYXWVUTSRQPONMLKJIHGFEDCBA
Note. The benchmarking is on a 10-point scale ranging from 1 (low)
zyxwvutsrqponmlkjihgfedcbaZYXWVUTSRQPONMLKJIHGFEDCBA
to 10 (high); also note that a 0 or a 10 will bevery rare.
Special note. Close [win or lose] in this template means being within 10% of the other benchmarks.
Sales Gr. 4.20 13.57
I
-3.82 13.95 12.15 17.00I
5.0 Sales Growth = 2 wins, 3 losses [ 1 close] = 5.0T-Risk Nike Econ. * Low/Mod Low Bus.
**
Very Low Fin.***
(a) Lt.D/eq. .13 (4 wins) (b) .39 Tot.D/eq.
( 4 1.88 Curr. R
( 4 1.51 PEG Ratio
TRR
(3 wins & 1 close) (2 wins & 1 close) (2 wins & 2 close) Adjusting TRR for: cash flow (+)
betdsafety (+)
(8.625 x 1.05) polithntl risk (-)
*
Econ. R = 4 wins [l close] = 8.75.**
Bus. R = 4 wins I1 close1 = 9.0.Reebok Industr. Sector
zyxwvutsrqponmlkjihgfedcbaZYXWVUTSRQPONMLKJIHGFEDCBA
S & P 500 Low/Mod Low Mod. Low Mod ModLow Mod.Low Mod Mod
.55 .17 2.47 .66 .59 .37 2.71 .94 1.44 2.46 1.94 1.70 No growth 1.51 2.86 1.42
=
+
5%I-
Rating 8.75 9.00 8.125
10.00 8.75 6.25 7.50 8.625
***
Fin. R = (10.00; 8.75Total risk rating = (8.75 + 9.0 +8.125)/3 = 25.875/3 =8.625; TRR Adjusted = 9.06.
6.25 + 7.5)/4 = 32.5/4 = 8.125.
TPR (total performance rating) = (Profit
+
Sales Gr. + Tot. Risk) = (6.0 +5.0 + 9.06)/3 = 20.06/3= 6.69.Final adjusted TPR = 6.69: In which 6.69 is left as is for its mixed stock price trend.
1-year TPR trend projection (up. down, flat): flat. 5-year TPR projection: up, rising to 7.5 adjusted.
Notes. Column headings in table refer to averages for Nike, Reebok, the footwear industry (Ind.), the apparel sector (Sec.), and Standard and Poor's (S&P). NPM stands for net profit margin, ROA for return
on assets, and ROE for return on equity. Avg. PR.
zyxwvutsrqponmlkjihgfedcbaZYXWVUTSRQPONMLKJIHGFEDCBA
is average profitability rating. T-risk is total risk, com- prising economic, business, and financial (econ., bus., and fin.) risks. Lt.D/eq. is long-term debt to totalequity, tot.D/eq. is total debt to equity,
zyxwvutsrqponmlkjihgfedcbaZYXWVUTSRQPONMLKJIHGFEDCBA
Curr. R is current ratio (current assets/current liabilities), and PEG Ratio is price/eamings ratiohales growth. TRR is total risk rating, and TPR is total performancerating.
MarcWApril2003 207
Directions for Accessing the
Comparison Reports
zyxwvutsrqponmlkjihgfedcbaZYXWVUTSRQPONMLKJIHGFEDCBA
Multex Investor provides a number of useful and timely investment reports on various securities. Most important, the reports are free, and it is not necessary to register with Multex Investor to access many of them.
On the Internet, Multex Investor can be accessed through either of the follow-
ing two
zyxwvutsrqponmlkjihgfedcbaZYXWVUTSRQPONMLKJIHGFEDCBA
URL‘s: <www.marketguide.com> or <www.multexinvestor.com>. Upon reaching the opening Multex Investor page, students merely need to enter either the stock symbol or the name of the company that they are studying and then click on “go” or press “enter.” The next screen offers a list of options in the far left column. The choice that students need to access is “ratio comparison,” which is located under “company information.” These ratio comparison reports generate a sig- nificant amount of financial information and include comparisons with the indus- try, the sector, and the S&P 500. At the
end of the report, a list of competitors is provided in order of descending market capitalization. The analyst selecting a competitor for benchmarking purposes is generally advised to choose the 1st or 2nd company on the list. However, he or she will need to exercise some qualita- tive judgment at this point. In addition, the analyst may be facing a situation in which a given firm is so highly diversi- fied that there is no appropriate competi- tor with which to benchmark it. In such a case, the benchmarking process can be simplified through reliance on only four benchmark tests in the profitability and sales growth areas and only three bench- marks in the risk area.
Using the Comparison Reports
The Multex Investor report provides a wealth of information for analysis, com- parison, and assessment. We rely on three broad types of criteria for analysis and comparison: (a) profitability bench- marks, (b) sales growth benchmarks, and (c) comprehensive risk benchmarks. Profitability and sales growth bench- marks are self-explanatory. Risk bench- marks can be more difficult to construct and comprehend.
208
zyxwvutsrqponmlkjihgfedcbaZYXWVUTSRQPONMLKJIHGFEDCBA
Journal of Education for BusinessRisk Analysis
The final dimension considered in Table 1 addresses the issue of risk. One type of approach is to consider risk from three perspectives: economic (perhaps most critical to fm success), business, and financial.
Economic risk. To assess economic risk, the analyst identifies a given firm’s products and services in terms of demand characteristics and elasticity of
demand (consistency in demand) asso- ciated with a firm’s product. Of course, highly diversified firms such as General Electric are likely to find that demand elasticities may differ sharply from one product group or SBU to another. The analyst should consider the following relevant factors:
1. Whether the products/services are necessities or durables and how expen- sive they might be for consumers and buyers; this is generally the most critical factor
2. The rate of technological change in products/services or production processes
3. The industry’s profile, which
includes its maturity and structure as
well as its overall attractiveness
zyxwvutsrqponmlkjihgfedcbaZYXWVUTSRQPONMLKJIHGFEDCBA
4.
Major competitors’ capabilities, including size, market share, profits, image, and resources (financial, produc- tion, distribution, and human resources)5. The firm’s own capabilities
6 . Qualitative aspects of economic
risk such as the customer loyalty factor associated with a given firm’s products and services as well as their perceived value relative to price
The first of these factors is by far the most significant.
Business risk. To assess this factor, the analyst assesses the firm’s ability to cover fixed operating expenses. Fixed costs are contractual costs that must be paid out regardless of varying levels of output or sales. Fixed costs typically include items such as debt financing; physical plant realities regarding main- tenance, rendleasing, utilities, insurance premiums, and managerial and profes- sional staff salaries (where the firm must operate with at least a skeleton crew); property taxes; and licenses. In
particular, nonfincancial assets such as plant and equipment cannot be disposed of quickly and, in the short term, typi- cally represent a significant cost from which there is little escape.
For example, a steel producer faces a higher business risk than most other manufacturers because the foundry uses a continuous production process, which results in fixed operating expenses incurred 24 hours a day. In contrast, marketing-oriented firms typically have lower levels of business risk than do manufacturing-type firms because both people (employees) and inventory can be reduced in the short term.
High-tech manufacturing at Intel results in very high business risk because factories cannot be closed down effectively on a temporary basis; a minimal crew is already a reality and cannot be reduced much, if at all; and the facilities and technologies involved are relatively permanent, high-tech expenses.
Our concern is the assessment of the resource structure of the firm and of the relationship of fixed costs to variable costs. Variable costs generally vary directly with the f m ’ s production and sales operations. Common variable costs include costs of production such as labor, material, and supplies as well as sales commissions and product deliv- ery expenses and warehousing. The pri- mary focus of business risk is generally associated with the concept known as the degree ofoperating leverage (DOL). When assessing business risk, the analyst also may wish to look at the ratio produced by dividing sales by
assets (sales
zyxwvutsrqponmlkjihgfedcbaZYXWVUTSRQPONMLKJIHGFEDCBA
+
assets). This ratio would be low for a steel mill with a large assetbase in terms of plant, equipment, and inventory (higher ratios would generally indicate lower levels of business risk). An athletic shoe manufacturer that con- tracts out nearly all of its production line (e.g., Nike) has a significantly lower asset base and, compared with a steel mill, will have a very high ratio (very low business risk). In a sales downturn, the steel mill may be espe- cially vulnerable to business risk, but an athletic shoe firm such as Nike may have a comparatively greater ability to survive a downturn. The DOL and busi- ness risk factor also help to explain why
stock values for domestic automobile firms tend to rise significantly in an eco- nomic expansion and to drop sharply in an economic recession (contraction).
Such business risks often are masked by a purely quantitative analysis. For example, at Enron, an excessively risk- tolerant and inept management was able to hide much of the firm’s risk. Although some of the financial mea- sures hinted at the existence of signifi- cant risk, top management’s ability and desire to mask this risk apparently played a part in the firm’s eventual
bankruptcy. A qualitative assessment of
zyxwvutsrqponmlkjihgfedcbaZYXWVUTSRQPONMLKJIHGFEDCBA
management’s willingness to speculate in futures markets and its willingness to engage in “off the books” deal-making might have revealed this heightened risk (Nussbaum, 2002) to interested and vul- nerable stakeholders.
It is important to note that, to a large
degree, the template described in this article assesses business risk on a relative basis (relative to major competitors, industry, sector, and S&P 500). Some industries and business sectors are inclined to have higher levels of business risk (such as airlines, which have fixed costs associated with the ownership of a fleet of planes) than industries such as
apparel firms that outsource production.
zyxwvutsrqponmlkjihgfedcbaZYXWVUTSRQPONMLKJIHGFEDCBA
Financial risk. To assess financial risk, the analyst examines the firm’s ability to cover fixed financial expenses. Although balance sheet strength and cash flow are important, the major con- cern is the firm’s degree of financial
leverage (DFL). The analyst focuses on the relationship of debt to equity and, to a lesser extent, the current ratio and quick ratio. The key measures are defined as follows:
1. Long-term debt to total equity
(most recent quarter) =
zyxwvutsrqponmlkjihgfedcbaZYXWVUTSRQPONMLKJIHGFEDCBA
long term debt+
total stockholders’ equity.2. Total debt to equity (most recent
quarter) = total debt
zyxwvutsrqponmlkjihgfedcbaZYXWVUTSRQPONMLKJIHGFEDCBA
i total stockholders ’equity. This ratio is total debt for the most recent fiscal quarter divided by total shareholder equity for the same period.
3. Current ratio = current assets i
current liabilities. This is the ratio of total current assets for the most recent quarter divided by total current liabili-
ties for the same period.
zyxwvutsrqponmlkjihgfedcbaZYXWVUTSRQPONMLKJIHGFEDCBA
4.
PEG ratio = price/eamings ratio +sales growth. The pricelearnings (PE) ratio is the stock price divided by the “primary” earnings per share (excluding extraordinary items paid to common stockholders in the form of cash divi- dends during the trailing 12 months); this ratio comprises the numerator. Sales growth comprises the denominator (typ- ically sales growth, occasionally earn- ingshhare growth). The analyst deter- mines the overall PEG ratio by dividing the current PE ratio by the firm’s 1-year sales growth percentage. The ratio should yield a small number; the small- er the number, the better. A given firm’s PEG ratio should be compared with those of competitors, industry averages, the sector, and the S&P 500.
It is important to note that the first two aspects of risk-economic and business-pose problems for the exter- nal analyst, who generally does not have explicit internal and quantitative data with which to work. As a result, this part of the assessment becomes fairly qualitative compared with the kind of assessment possible in the area of financial risk. Financial risk assess- ment is typically more straightforward because of the significant amount of quantitative data available to external analysts. We recommend using the PEG ratio because of its ability to shed light on a firm’s overall financial risk. Still, for the purposes of the template depicted in this article, this measure is optional.
Adjusting the total risk rating. As a complement or a crosscheck for the three aspects of risk discussed above, adjustments in the total risk rating (TRR) are made for cash flow and betdsafety as well as political and inter- national risk.
Price to free cash flow
zyxwvutsrqponmlkjihgfedcbaZYXWVUTSRQPONMLKJIHGFEDCBA
per share iscalculated by taking the current price of the stock and dividing it by the trailing 12-month free cash flow per share. Free cash flow is calculated from the state- ment of cashflows as cash from opera- tions minus capital expenditures and dividends paid. Cash flow is then a mea- sure of the available funds over and above expenses that are available for discretionary use by the firm.
Beta is a measure of a company’s common stock price volatility relative to the market. Beta values equal to 1 mimic the price volatility of the market. Values less than 1 are less volatile than the overall market. Values greater than 1 indicate higher volatility than that of the overall market. High volatility is gener- ally less desirable.
The safety index is used as an addi- tional overall measure of a given firm’s total risk exposure. This index is con- sidered by ValueLine to be a total cor- porate risk instrument and broadly incorporates economic, business, and financial risk as well as risk represented by a firm’s beta. ValueLine (2003) points out that the safety index is
a measurement of potential risk with individual common stocks. The Safety Rank is computed by averaging two other Value Line indexes-the Price Sta- bility Index and the Financial Strength Rating. Safety Ranks range from 1 (Highest) to 5 (Lowest). Conservative investors should try to limit their pur- chases to equities ranked l (Highest) and 2 (Above Average).
ValueLine uses a proprietary formula that might need to be viewed with some caution. Though the safety index is use- ful for obtaining a broad perspective regarding a given firm’s overall risk orientation, ValueLine does seem to be a bit biased in its safety index. For instance, traditional companies that possess a significant asset base often appear to be rated a bit more favorably than one might expect. Such a bias in recent years could conceivably be a problem as large asset-based organiza- tions struggle to downsize and shed material assets that are declining signif- icantly in value.
PoliticaWinternational risk. An assessment should be made of this risk. Getty Oil, for example, faced consider- able threats of expropriation of its major land holdings in Libya in the 1950s and 1960s. Eventually, Getty Oil’s Libyan oil fields were expropriated. A downward adjustment may need to be made for (a) companies facing considerable interna- tional risk from expropriation or exces- sive exposure to unfavorable currency fluctuations and (b) companies facing greater political or legal risks; for exam- ple, those in the tabacco industry.
MarcWApril2003
zyxwvutsrqponmlkjihgfedcbaZYXWVUTSRQPONMLKJIHGFEDCBA
209Five Stages of Benchmarking
zyxwvutsrqponmlkjihgfedcbaZYXWVUTSRQPONMLKJIHGFEDCBA
The framework depicted in Table 1 uses 5 stages of benchmarking for both profitability and sales growth assess- ment. No single stage is capable of pro- viding enough information to enable an analyst to make an informed judgment as to how well a given firm is perform- ing overall. As a result, the template facilitates a holistic assessment by requiring the analyst to proceed through five stages or steps by first comparing the base firm’s 5-year performance (“Nike 5 yr.”) with its 1-year numbers on the left (“Nike 1 yr.”) and then mov- ing to the ever-widening 5-year bench- mark perspectives to the right. Such a systematic process recognizes the unique validating portrait of each indi- vidual stage. Collectively, these stages can provide a comprehensive, overall view of a given firm’s financial health. Perhaps the most important benchmark test is the first, in which a given firm is assessed on whether its most recent yearly performance shows improvement over that of the 5-year period.
An emphasis on excellence, quality, and continual improvement requires that multiple comparisons be made. We can compare this process with the way a competitive runner might assess his or her performance. The runner must benchmark his or her current yearly per- formance against (a) his or her perfor- mance over time, (b) the performance of a major competitor or competitors, (c) that of other runners in his or her own age group (an industry-like compari- son), (d) all runners in his or her gender (a sector-like comparison), and (e) all
runners in general (the S&P
zyxwvutsrqponmlkjihgfedcbaZYXWVUTSRQPONMLKJIHGFEDCBA
500).To fail to make such comparisons could create a false illusion that a firm is becoming stronger financially. Although its performance over time may have risen, the firm’s rivals and the respective industry may conceivably be showing even better results and more improvements. In the long run, this sit- uation is likely to produce a major com- petitive disadvantage. Though it is not always easy to identify the “right” spe- cific competitor, it is useful to note that a given firm also competes with itself over time, as well as with its industry, its sector, and the S&P 500.
Once the analyst possesses the rele- vant and generally quantitative informa- tion for each benchmarking stage, he or she must assess each test of perfor- mance qualitatively. Is the base firm in question performing better over the last year (in comparison with its 5-year average) and better relative to its major direct competitor, the industry, the sec- tor, and the S&P 500? Each of the per- formance criteria that are posed verti- cally in the template is individually assessed horizontally through the vari- ous benchmark stages.
The analyst tracks both the number of victories or the success rate of each cri- terion and the margin of victory or defeat for a given firm when he or she goes down the row of benchmarks. Benchmarking is done on a scale rang- ing from 0 to 10. Taking the number 10 and dividing it by the number of bench- marks determines point totals that are available per benchmark test. For the profitability and sales growth sections of the template, five benchmarks tests are performed, and as a result each test is worth as much as two points (10 divided by 5).
For the comprehensive risk portion of the template, the analyst uses only four benchmarks, which results in each benchmark test being worth as much as 2.5 points. Ties are defined as being within 10% to 15% of a comparison
benchmark
zyxwvutsrqponmlkjihgfedcbaZYXWVUTSRQPONMLKJIHGFEDCBA
(+ or -) and are typically awarded half of the benchmark pointsfor that particular test. In the case in which 5 benchmarks are used, a close call for a given benchmark test equals 1 point. In the case of four benchmarks, this equals 1.25 points or half of 2.5.
For example, benchmarking through four stages could reveal that a fm is winning two small battles and losing two small battles. In such a scenario, the firm could be performing slightly above competitor and industry averages while performing slightly below the sector and S&P 500 averages. As a result, if the four benchmarks were all within 10% of the base performance, the ana- lyst would award 4 ties and score the
firm a 5
zyxwvutsrqponmlkjihgfedcbaZYXWVUTSRQPONMLKJIHGFEDCBA
(4
x 1.25 = 5). A performancezyxwvutsrqponmlkjihgfedcbaZYXWVUTSRQPONMLKJIHGFEDCBA
rating of 5, which depicts a fair perfor- mance, would be registered in the appropriate space in the far right-hand column titled “Rating.” However, if the
two victories were substantial and the two defeats minimal, a performance rat- ing of 7.5 would be warranted.
After each component (i.e., net profit margin [NPM]; return on assets [ROA], return on equity [ROE]) is taken through this benchmarking process, the analysis generates an average score to produce a final performance rating for that criterion (i.e., profitability). It should be noted that each of the prof- itability ratios is weighted equally here. However, an analyst may wish to use an unbalanced weighting. For instance, because the ROA is less vulnerable to management’s manipulation, it could be accorded a much higher weighting (50% instead of 33.3%).
The analysis of
zyxwvutsrqponmlkjihgfedcbaZYXWVUTSRQPONMLKJIHGFEDCBA
sales growth is a straightforward, horizontal comparison.However, total risk, like profitability, is made up of multiple criteria that include the following components: economic, business, and financial. It is important to note that the total risk rating (TRR) is adjusted up or down depending on a number of additional factors such as cash flow, beta, safety, and political and international risk.
The next step is to compute an over- all average or total peg5ormance rating (TPR), derived from the three broad cri- teria assessed through the benchmark- ing process. Again it is useful for the analyst to observe that the three compo- nents (profitability, sales growth, and total risk) are equally weighted. Howev- er, he or she may prefer to use an unbal- anced weighting that gives profitability more emphasis and, in return, reduce the emphasis on risk and sales growth.
The template also provides for a real- world adjustment of the bottom-line score. For instance, an adjustment of up to 10% to 15% can be made on the TPR for its stock price trend over the past 12- month period (relative to the overall market trend). If, however, the 5-year outlook for the firm looks promising (or bleak), additional adjustments up (or down) can be made. The point is that the process of benchmarking is an art, not an exact science, and it is based on quantitative and qualitative factors. A certain amount of room for judgment is reserved for the analyst to make adjust- ments in the total performance rating depending on relative and absolute
21 0 Journal of Education for Business
stock price trends over the past year
and, to a lesser extent, long-term
zyxwvutsrqponmlkjihgfedcbaZYXWVUTSRQPONMLKJIHGFEDCBA
(5-year) trends in the industry.
zyxwvutsrqponmlkjihgfedcbaZYXWVUTSRQPONMLKJIHGFEDCBA
The Financial Assessment of Nike: An Applied Example
The assessment process displayed in Table 1 shows the most currently avail- able financial data representing the benchmark figures for Nike, Inc. in com- parison with its major domestic com- petitor, Reebok. Nike designs and devel- ops a variety of footwear, apparel, and accessory products targeted toward the athletic and leisure market. The compa- ny sells to approximately 19,000 retail accounts in the United States and approximately 140 other countries (Val- ueLine, 2003). ValueLine analysts believe that the company has taken advantage of the growing trend in fash- ionable athletic footwear for young women. Continued support exists for the company’s performance running shoes, men’s basketball shoes, crosstraining footwear, and children’s shoes.
The first benchmark, “Profit,” is made up of three components: net prof- it margin, return on assets, and return on equity. Nike’s most recent 1-year NPM was less than its 5-year average but close enough to be within a 10% to 15% range (a close lose). The 5-year average beat Reebok’s 5-year average as well as those of the industry and sector. Howev- er, Nike’s NPM was not as strong as the
S&P
zyxwvutsrqponmlkjihgfedcbaZYXWVUTSRQPONMLKJIHGFEDCBA
500’s 5-year average. This meansthat on the row “NPM” Nike scores 3 wins and 1 tie (a close call) and earns 7
points ([3 x 21
zyxwvutsrqponmlkjihgfedcbaZYXWVUTSRQPONMLKJIHGFEDCBA
+
[ l x I] = 7). The row “ROA” shows the same trend,but here the tie is with the industry benchmark. Again, 7 points are awarded. Finally, the ROE row shows only 1 win over Reebok. Still, ROE figures came within 10% to 15% of the industry 5-year average and the sector 5-year average. But they lost to the S&P 5-year average, and the 1-year performance is below the 5-year. This means that 1 win and 2 ties are noted, and 4 points are
added to Nike’s total in this category
zyxwvutsrqponmlkjihgfedcbaZYXWVUTSRQPONMLKJIHGFEDCBA
([l x 21
+
[2 x 11 = 4).Overall, the
zyxwvutsrqponmlkjihgfedcbaZYXWVUTSRQPONMLKJIHGFEDCBA
average profit ratingcame to 6 {(7
+
7+
4)+
3)}.The second major benchmark is sales
growth. Although Nike’s recent 1-year
sales growth has not been as strong as its 5-year number (a loss), the 5-year aver- age sales growth exceeds Reebok’s 5-
year growth and the sector’s 5-year growth. Two wins and 1 tie with the industry are noted. Sales growth points came to 5 ([2 x 21
+
[ l x 11) = 5.The third benchmark, total risk, has three equally weighted components: economic risk, business risk, and finan- cial risk. Financial risk has four subcom-
ponents: (a) long-term debt
zyxwvutsrqponmlkjihgfedcbaZYXWVUTSRQPONMLKJIHGFEDCBA
t equity (Lt.D/eq.), (b) total debt+
equity(Tot.D/eq.), (c) current assets
+
current liabilities, or current ratio(Curr.
R), and (d) price/earnings ratio t sales growth(PEG ratio). Though we intuitively sus- pect that the economic risk factor is the most important, we decided to leave all four equally balanced in order to keep the analytical process presented in this article less cluttered.
Looking at the first component of total risk-that is, economic risk-we found that Nike faces low economic risk. A case can readily be made that footwear, even athletic footwear, is a necessity for most consumers. Nike has positioned its products in such a manner as to be the shoe of choice for a majori- ty of consumers, particularly among fashion-conscious teenagers, fitness- oriented adults, and mall-walking senior citizens. As a result, demand is not like- ly to drop much during an economic recession. High-end shoes may tem- porarily decline in demand, but Nike has a significant array of moderately priced shoes for its various market seg- ments and thus ensures that demand will be relatively inelastic. In addition, Nike appears to have lowered its economic risk by employing improved technolo- gies in its production and marketing processes. Furthermore, the company has an automatic replenishment pro- gram in place with its retail accounts (ValueLine, 2003).
We also believe that Nike has excep- tionally low business risk, the second component of total risk. The company’s products sell at prices that provide a sig- nificant cushion for covering fixed costs. Furthermore, the degree of oper- ating leverage has been historically low because the company outsources nearly all (98%) of its production.
Because economic and business risk
are highly qualitative, it is perfectly acceptable to assess risk unilaterally. In other words, we assessed economic and business risks primarily from Nike’s vantage point, employing little or no benchmarking.
We then looked at the third compo- nent of total risk, financial risk, and found that Nike’s financial risk ratios show a relatively secure position. It has drastically reduced its long-term debt.
Long-term debt
+
equity ratio gives Nike four wins across the board(4
x 2.5), producing 10.0 benchmarking points.Total debt
+
equity ratio yields 3 wins and 1 close loss for a total of 8.75 benchmarking points { (3 x 2.5)+
1.25 = 8.75)}.The current ratio yields 2 wins and 1 close score {(2 x 2.5)
+
1.25) for a score of 6.25.The PEG ratio (in which lower numbers are more attractive) shows 2 wins and 2 close losses { (2 x 2.5)
+
(2 x 1.25)) for a score of 7.5.The financial risk composite score is calculated by averaging Lt.D/eq.
+
Tot.D/eq.+
Curr.R+
PEG Ratio. This yields a financial risk rating of 8.125, which is a composite of { (10.00+
8.75 +6.25 +7.5)+
4 ) .The total risk rating of 8.625 is a composite of economic, business, and financial risk of I(8.75
+
9.0+
8.125)+
31.An overall 5% upward adjustment is made for the total risk rating, which is
on the conservative side. Nike is adjust-
zyxwvutsrqponmlkjihgfedcbaZYXWVUTSRQPONMLKJIHGFEDCBA
ed positively for its strong cash flow (+), reasonable beta value (0), and a very reasonable safety rating indexed by ValueLine at a positive 2 (+) (on a scale of 1 to 5 in which 1 = very attractive). Politicalhnternational risks remain neg- ative (-) with Nike’s overseas manufac- turing facilities, but these risks seem to have lessened as Nike responded to the charge that some of its offshore subcon- tractors engaged in unethical and illegal labor practices and facilitated the exis- tence of predatory sweatshops. Still, we see too many negatives to discount risk totally as a relevant factor in the inter- national arena.
Multiplying the total risk rating of 8.625 x 1.05 yields an adjusted total risk rating of 9.06. Adding this, the third
MarcWApril2003 21 1
benchmark, to the other profit rating benchmark of 6.0 and sales growth rat- ing of 5.0 yields a total performance rat-
ing of 6.69 I(6.0
+
zyxwvutsrqponmlkjihgfedcbaZYXWVUTSRQPONMLKJIHGFEDCBA
5.0zyxwvutsrqponmlkjihgfedcbaZYXWVUTSRQPONMLKJIHGFEDCBA
+
9.06)zyxwvutsrqponmlkjihgfedcbaZYXWVUTSRQPONMLKJIHGFEDCBA
f 3).The analyst must not stop here, how- ever. Questions remain. What is the stock price trend over the past 6 to 12 months? What are the growth prospects for the company? How will things look 5 years from now? Can growth be sustained?
Nike’s stock price has been trending downward over the past year, but so has the market in general. We conceivably could take a conservative approach and adjust Nike downward bylO%, given its yearlong trend. However, it would prob- ably be wiser to leave Nike’s final per- formance rating alone because its stock price decline corresponds very closely to stock price trends in both its industry
and Wall Street in general.
zyxwvutsrqponmlkjihgfedcbaZYXWVUTSRQPONMLKJIHGFEDCBA
By using a10% deduction, one would arrive at a final adjusted total performance rating of 6.0. Subsequently, we chose to make no adjustment up or down given Nike’s relative stock market performance.
It is also useful to note that Nike has shown improvement since September 1 1, 2001 and continued to show further improvement early in 2002. In light of Nike’s long-term (5-year) prospects for
increased sales, improved margins and healthy profits, we chose not to penalize Nike and leave its total performance rat- ing at 6.69. A more liberal analysis could even result by adjusting the TPR upward to 7.5. However, our final adjusted rating for Nike is 6.69 and is likely to rise in the very near future because the firm appears to be healthier and wealthier relative to last year and perhaps the last several years. Still, it is also worthy to observe that a new powerful European competi-
tor has reawakened: Adidas.
zyxwvutsrqponmlkjihgfedcbaZYXWVUTSRQPONMLKJIHGFEDCBA
Conclusion
The benchmarking process described in this article offers a comprehensive approach that uses multiple criteria applied through a multistage analysis. This approach pulls together many inter- connected accounting and financial strands to produce a rich financial tapes- try. We believe that the new template rep- resents a higher level of analysis and leads to improved decision-making. Unlike the broad focus of Kaplan and Norton’s “balanced scorecard” (1993, 1996), the template that we have described in this article facilitates a bal- anced financial portrait that effectively
integrates the varied realities of prof- itability, sales growth, and risk orienta- tion. It makes no effort at factoring in or even assessing corporate social responsi- bility; nor does it attempt to assess vari- ous stakeholder factors or determine whether organizational goals and perfor- mance actually match. Instead, the analy- sis uses a basic benchmarlung approach
to holistically determine a firm’s bottom line relative to its various benchmarks, its recent past, and its near-term future.
REFERENCES
Aupperle, K. E, & Sarhan, M. H. (1995). Assessing financial performance in the capstone Strategic
Management course: A proposed template. Jour-
zyxwvutsrqponmlkjihgfedcbaZYXWVUTSRQPONMLKJIHGFEDCBA
nal ofEducarion for Business, 71(2), 72-17.
Kaplan, R., & Norton, D. (1993). Putting the bal-
anced scorecard to work. Harvard Business
Review, 71 ( 5 ) ,
zyxwvutsrqponmlkjihgfedcbaZYXWVUTSRQPONMLKJIHGFEDCBA
134-142.Kaplan, R., & Norton, D. (1996). The balanced
scorecard: Translaring strategy into action.
Boston, MA: Harvard University Press. Nussbaum, B. (2002, January 28). Can you trust
anybody anymore? The scope of the Enron debacle. Business Week, 3 1 4 8 .
Solomon, E. (1963). The theory of jnancial man-
agement. New York Columbia University Press. ValueLine. (2003). The Valueline Investment Sur-
vey. Retrieved from www.valueline.com Multex Investor [Web site]. (n.d.). Available:
www.marketguide.com and www.multexin- vestor.com
Weston, J. F., & Brigham, E. F. (1975). Manager- ialpnance. Hinsdale, IL: Dryden Press.
21 2 Journal