1
PT Bank Tabungan Negara (Persero), Tbk.
Pengungkapan
Leverage Ratio
Posisi 30 Juni 2016
(Dasar : Surat OJK No. S-196/PB-11/2014)
I. Informasi Leverage Ratio Utama
a. Modal Inti
Modal Inti (Tier I) Bank posisi 30 Juni 2016 sebesar Rp 15,43 Triliun (atau 16,82% dari ATMR), telah sesuai dengan Peraturan Otoritas Jasa Keuangan yang tertuang dalam POJK No.11/POJK.03/2016 tanggal 29 Januari 2016 tentang Kewajiban Penyediaan Modal Minimum Bank Umum, yang mensyaratkan modal inti paling rendah sebesar 6%.
b. Exposure Measure
Jumlah Exposure Measure Bank posisi 30 Juni 2016 sebesar Rp.191,59 Triliun yang terdiri dari eksposur aset di neraca, transaksi derivatif, SFT dan eksposur transaksi rekening administratif.
c. Leverage Ratio
Leverage Ratio posisi 30 Juni 2016 dibandingkan dengan angka 3 (tiga) triwulan terakhir, sebagaimana Tabel 1 berikut ini :
Tabel 1 Leverage Ratio
Keterangan 30 Juni 2016 31 Maret 2016 31 Desember 2015 30 September 2015
Leverage Ratio 8,05% 6,92% 6,88% 6,58%
II. Summary Information Table
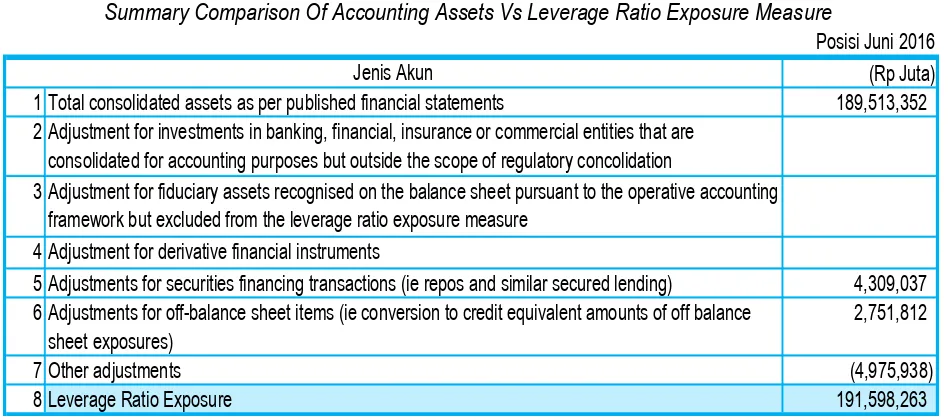
Tabel Perbandingan antara total aset di neraca (accounting asset) dengan perhitungan eksposur Leverage Ratio (leverage ratio exposure measure) sebagaimanaTabel 2 berikut ini :
Tabel 2
Summary Comparison Of Accounting Assets Vs Leverage Ratio Exposure Measure
Posisi Juni 2016 (Rp Juta) 1 Total consolidated assets as per published financial statements 189,513,352 2 Adjustment for investments in banking, financial, insurance or commercial entities that are
consolidated for accounting purposes but outside the scope of regulatory concolidation
3 Adjustment for fiduciary assets recognised on the balance sheet pursuant to the operative accounting framework but excluded from the leverage ratio exposure measure
4 Adjustment for derivative financial instruments
5 Adjustments for securities financing transactions (ie repos and similar secured lending) 4,309,037 6 Adjustments for off-balance sheet items (ie conversion to credit equivalent amounts of off balance
sheet exposures)
2,751,812
7 Other adjustments (4,975,938)
8 Leverage Ratio Exposure 191,598,263
2 III. Common Disclosure Template
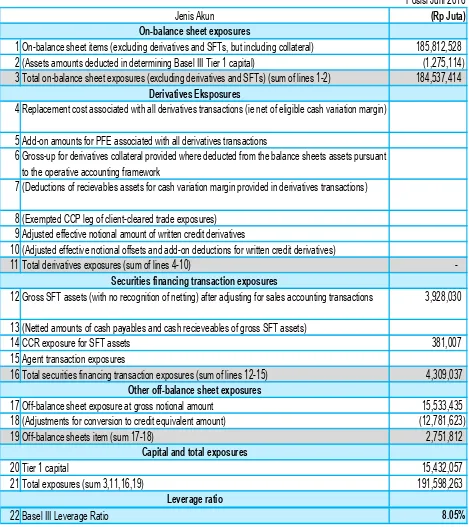
Tabel 3 berikut ini adalah template Leverage Ratio Common Disclosure Bank posisi 30 Juni 2016. Tabel 3
Leverage Ratio Common Disclosure
IV. Informasi Kualitatif Pendukung
Mengacu pada POJK No.11/POJK.03/2016 tanggal 29 Januari 2016 tentang Kewajiban Penyediaan Modal Minimum Bank Umum, Bank telah melakukan penyesuaian terhadap perhitungan Modal Inti (Tier 1) yang digunakan dalam perhitungan Leverage Ratio posisi 30 Juni 2016.
Posisi Juni 2016
(Rp Juta)
1 On-balance sheet items (excluding derivatives and SFTs, but including collateral) 185,812,528 2 (Assets amounts deducted in determining Basel III Tier 1 capital) (1,275,114) 3 Total on-balance sheet exposures (excluding derivatives and SFTs) (sum of lines 1-2) 184,537,414
4 Replacement cost associated with all derivatives transactions (ie net of eligible cash variation margin)
5 Add-on amounts for PFE associated with all derivatives transactions
6 Gross-up for derivatives collateral provided where deducted from the balance sheets assets pursuant to the operative accounting framework
7 (Deductions of recievables assets for cash variation margin provided in derivatives transactions)
8 (Exempted CCP leg of client-cleared trade exposures) 9 Adjusted effective notional amount of written credit derivatives
10 (Adjusted effective notional offsets and add-on deductions for written credit derivatives)
11 Total derivatives exposures (sum of lines 4-10) -
12 Gross SFT assets (with no recognition of netting) after adjusting for sales accounting transactions 3,928,030
13 (Netted amounts of cash payables and cash recieveables of gross SFT assets)
14 CCR exposure for SFT assets 381,007 15 Agent transaction exposures
16 Total securities financing transaction exposures (sum of lines 12-15) 4,309,037
17 Off-balance sheet exposure at gross notional amount 15,533,435 18 (Adjustments for conversion to credit equivalent amount) (12,781,623) 19 Off-balance sheets item (sum 17-18) 2,751,812
20 Tier 1 capital 15,432,057 21 Total exposures (sum 3,11,16,19) 191,598,263
22 Basel III Leverage Ratio 8.05%
Capital and total exposures
Jenis Akun
On-balance sheet exposures
Derivatives Eksposures
Securities financing transaction exposures
Other off-balance sheet exposures