Rainfall Prediction in Tengger Region Indonesia
using Tsukamoto Fuzzy Inference System
Ida Wahyuni Faculty of Computer Science
Brawijaya University Malang, Indonesia [email protected]
Wayan Firdaus Mahmudy Faculty of Computer Science
Brawijaya University Malang, Indonesia [email protected]
Atiek Iriany
Faculty of Mathematics and Natural Sciences, Brawijaya University,
Malang, Indonesia [email protected]
Abstract - Rainfall Prediction in Indonesia is very important for agricultural sector. However, obtaining an accurate prediction is difficult as there are too many input parameters including the world climate change that affect the accuracy. An accurate prediction is required to arrange a good schedule for planting agricultural commodities. A good approach is required to obtain a good model as well as the accurate prediction. This paper proposes Tsukamoto fuzzy inference system (FIS) to solve the problem. An intensive effort is put in building fuzzy membership function based on rainfall data in Tengger region from ten years ago. A series of numerical experiments prove that the proposed approach produces better results comparable to those achieved by other approach. In Tutur region Tsukamoto fuzzy inference system obtain Root Mean Square Error (RMSE) of 8.64, it is better than GSTAR-SUR method that obtain RMSE of 10.89.
Keywords – Prediction, Rainfall, Tsukamoto Fuzzy Inference Systems, Tengger
I. INTRODUCTION
Indonesia is a country with two seasons, there are dry season and rainy season. Today, the rainfall in the rainy season it increasingly difficult to predicted. This is because of the world climate change that also affect for climate in Indonesia. Prediction of rainfall in Indonesia becomes very important for many sectors that use rainfall as an input parameter for decision making process. The sectors include the agricultural sector, the transportation sector such as maritime transportation and air transportation [1]. An accurate prediction in early can give farmers more time to take decision regarding water supply for their land. However, rainfall prediction is still a challenging task as there are too many input parameters that increase the difficulty level of building a mathematical model of the problem.
The importance of rainfall prediction in an unarguable as Indonesia is an archipelago with a lot of people working in agriculture sector. One of the agricultural area in Indonesia is Tengger, East Java. In Tengger area there are many farms of potato where potato agriculture is a sector who received the direct impact of changes in rainfall patterns [2]. This happens because the process of planting potatoes is highly dependent on rainfall so that crops could be at a maximum. Currently the
potato is one of the agricultural products that can be used as a substitute for the main staple food in Indonesia [3]. However, due to the uncertain climate conditions, the productivity of potato in recent years become less than the maximum [4]. Therefore, predictions about rainfall to be one important factor in this sector.
The importance of rainfall prediction is showed in several researchs. For example, Charaniya and Dudul [5] implemented Artificial Neural Network (ANN) to predict rainfall based on preceding six days rainfall. ANN also was used in a study by Vamsidhar et al. [6]. Whilst the studies reported promising results, a series of experiments were required to get the best architecture for their ANN. A simpler approach may be developed using fuzzy inference systems (FIS), one of them is Tsukamoto FIS. Tsukamoto FIS describe the relationship between inputs and outputs of the system using a set of fuzzy if-then rules. The main strength of fuzzy inference systems (FIS) are in their ability to conclude a complex issue purely from the data. Additionally, fuzzy inference systems (FIS) represent knowledge in a way that can be easily interpreted by humans. Fuzzy is a very flexible tool for architectural modeling and inference mechanism can be adapted to the given problem [7].
Fuzzy method has also been used to predict rainfall with the combination of Artificial Neural Network (ANN) which is used for prediction of rainfall in Brazil [8]. Besides other methods such as Sugeno fuzzy inference system has also been used as a method for modeling forecasting precipitation [7]. In addition, rainfall in the area Tengger, East Java has also been predicted using algorithms GSTAR-SUR Model with rainfall data in the previous year, but the RMSE from the prediction result is still large [4].
II. MATERIAL AND METHOD
A. Problem Formulation
Before calculating the fuzzy inference system, the data necessary to determine in advance the range of values that will be the criteria for rainfall prediction data. Based on the data obtained, each rainfall made the range of values shown in Table 1.
TABLEI
THE RANGE OF CRITERIA VALUES FOR RAINFALL PREDICTION
Criteria Range of Values
Z t-1 0.00 - 40.00 Z t-2 0.00 - 40.00 Z t-17 0.00 - 40.00 Z t-34 0.00 - 40.00 Z t 0.00 - 40.00
Table 2 below presents data taken from observation stations in the Tutur region, Tengger, East Java which will be used as input values for each criteria. Predictions will be made with 326 test data.
TABLEII
DATA EXAMPLES FOR INPUT TSUKAMOTO FIS IN TUTUR REGION
Number of Data Variable Input Value of Variable Input
1 Z t-1 10.900
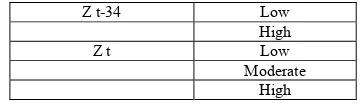
Fuzzy sets can be defined as an entity that represents a certain situation in a fuzzy variable [9]. In this study, use of fuzzy sets with two linguistic values, low and high. Formation of fuzzy set is adapted to input the data of rainfall. Linguistic values combined with fuzzy sets, each of which has a membership function that has been defined [10]. Data fuzzy sets and linguistic values are presented in Table 3.
TABLEIII FUZZY ASSOCIATION
Fuzzy Association
Variable Input value Linguistics
Z t-1 Low
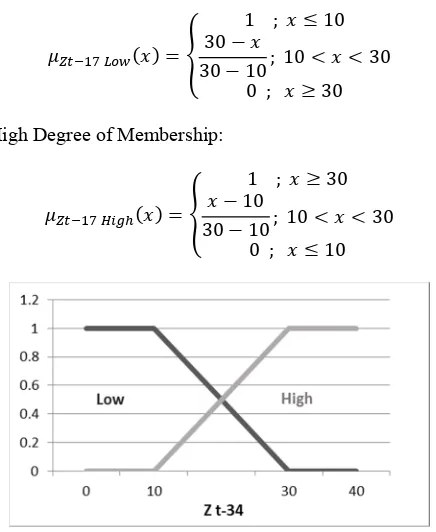
Fuzzification process is a crisp value calculations or input values into degrees of membership. Fuzzification calculation process based on the boundaries of the membership functions [11]. The membership function of fuzzy sets with 4 input criteria was show in Fig. 1 to Fig 5.
Fig. 1. Membership Function Boundaries for Zt-1
Low degree of membership:
=
; −
− ;
;
High Degree of Membership:
=
; −
− ;
;
Low degree of membership:
=
; −
− ;
;
High Degree of Membership:
=
; −
− ;
;
Fig. 3. Membership Function Boundaries for Zt-17
Low degree of membership:
=
; −
− ;
;
High Degree of Membership:
=
; −
− ;
;
Fig. 4. Membership Function Boundaries for Zt-34
Low degree of membership:
=
; −
− ;
;
High Degree of Membership:
=
; −
− ;
;
Fig. 5. Membership Function Boundaries for Zt
Low degree of membership:
=
; 5 −
5 − ; 5
; Moderate Degree of Membership:
=
; 5 5
−
5 − ; 5
; High Degree of Membership:
=
; − 5
− 5 ; 5
; 5
D. Fuzzy Inference System
Fuzzy Inference System (FIS) is a system that performs a calculation based on the concept of fuzzy set theory, fuzzy rules, and the concept of fuzzy logic. In the fuzzy inference systems (FIS) are fuzzy input in the form of crisp values. The crisp value will be calculated based on the rules that have been made to produce the amount of fuzzy-called Fuzzification process.
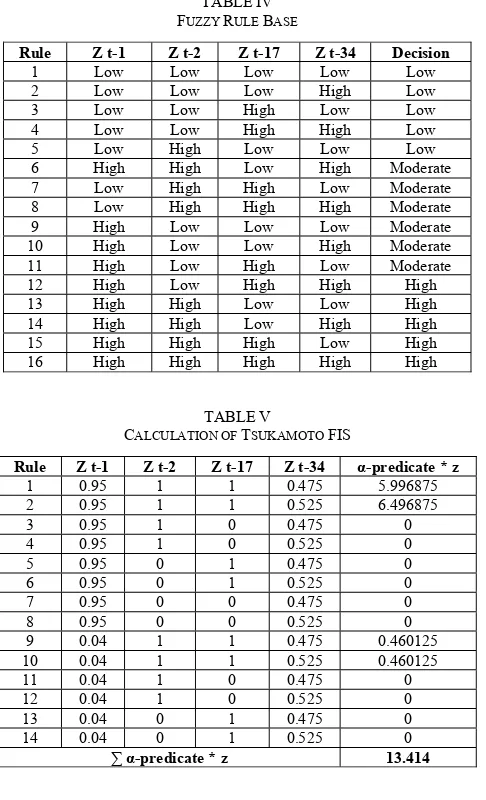
The next step, calculated degree of membership in accordance with the rules that have been made. Once known the value of the degree of membership of each fuzzy rule, the value of alpha predicate can be determined by using fuzzy set operations [11]. Fuzzy rule base was shown in Table 4 and calculation of Tsukamoto fuzzy inference system was shown in Table 5.
10 High Low Low High Moderate
11 High Low High Low Moderate
12 High Low High High High
The final step is the process of defuzzification where to find the value of output in the form of crisp values (z). The method used in this process is a method Center Average Defuzzyfier. The method described in Equation 1 [11]. The result from defuzzification calculation process using Center Average Defuzzyfier method for data in Table V is 12.30642202.
=∑ _ ∗∑ _
Description:
Z = the average defuzzification centralized
α_p = alpha predicate value (minimum value of the degree of membership)
Zi = crisp values obtained from the results of inference
i = number of fuzzy rules
F. System Accuracy
To determine the level of accuracy of the prediction, the accuracy of the system were calculated using the formula RMSE (Root Mean Squared Error) expressed in Equation 2 [12].
= −
Description:
RMSE = Root Mean Squared Error
y' = data from prediction
y = the actual data
n = number of data
G. Deviation Formula
To calculate the degree of difference between the prediction results using Tsukamoto FIS and previous studies, we use deviation calculation formula. Deviation means the level of difference, where the formula is often used to evaluate the results of calculation [13]. Deviations in this study will be used to evaluate the results of rainfall prediction. The formula for calculating the deviation is shown in Equation 3.
=Max e , e |e − e |
Description:
d = deviation
e = error value
III. RESULT AND DISCUSSION
In this research will be shown the results predicted in the four regions in Tengger, they are Puspo, Sumber, Tosari, and Tutur. Previous year rainfall data taken from four observation stations and will be used as input data for each criteria. From the input data will be obtained the results predicted rainfall in the next ten days or Zt using calculation with Tsukamoto fuzzy inference system. The prediction results shown are predicted results 326 rainfall data in areas Tutur presented in Table 6.
TABLEVI
PREDICTION RESULT WITH TSUKAMOTO FIS IN TUTUR REGION
Result Prediction in Tutur Region
Number of Data Actual Rainfall
Data (y) Prediction Results (y')
1 12.600 12.30642202
2 10.900 12.39608578
3 9.364 13.51135135
4 14.500 10.86645833
5 12.000 12.20143082
6 5.875 11.83566434
... ... ...
317 1.000 10
318 3.091 11.6
319 2.400 14.20982143
320 14.000 14.00073529
321 20.500 13.40916667
322 12.000 15.04323088
323 20.600 14.07660299
324 14.727 12.05380795
325 15.100 11.85845839
326 5.200 14.77813016
Results of prediction using the Tsukamoto fuzzy inference system is better when compared with the prediction results in previous studies that predict with GSTAR method [4]. It can be seen from the RMSE is smaller than previous. The following Table 7 displays a comparison RMSE from prediction results using Tsukamoto FIS and GSTAR in the four areas.
TABLEVII
COMPARISON OF PREDICTION RESULTS USING TSUKAMOTO FIS AND GSTAR
No. Location RMSE Fuzzy RMSE GSTAR
1 Puspo 8.95 4.9
2 Sumber 9.64 6.69
3 Tosari 8.81 7.92
4 Tutur 8.64 10.89
From the comparison data results of rainfall prediction using Tsukamoto fuzzy inference system with GSTAR method can be calculated level of deviation or the degree of difference from the results predicted by the two methods. The level of deviation can be seen in Table 8.
TABLEVIII
The deviation from the rate table can be seen that after the comparison at the level of deviation Puspo area is large enough. However, the prediction results in the area Sumber, Tosari and Tutur shows the level of deviation is small enough. This shows that the results predicted by Tsukamoto Fuzzy inference system has better accuracy. From Table 9 it can be seen that the RMSE results predicted in the area Puspo, Sumber, and Tosari with Tsukamoto fuzzy inference system have a worse result, but the difference is not too significant. In contrast to the results predicted in the Tutur area that shows RMSE is better than the last research. The difference of RMSE from Tsukamoto fuzzy inference system also not too far. This shows that the results predicted by Tsukamoto fuzzy inference system has better accuracy, although the error value obtained is greater than previous research. This result indicates that the Tsukamoto fuzzy inference system can predict rainfall and to overcome the greater error still needed optimization of
fuzzy membership functions for next research. This research provide benefits in the agriculture sector for determine the rainfall, in particular determining the timing of planting potatoes in Tengger.
IV. CONCLUSION
This study proves that the Tsukamoto FIS can be used to forecast seasonal rainfall in the Tengger, East Java. By using rainfall data 10 days ago 1), rainfall data 20 days ago (Zt-2), rainfall data of 170 days ago (Zt-17), and the rainfall data of 340 days ago (Zt-34) obtained more accurate forecasting results. To calculate the accuracy rate formula used RMSE (Root Mean Squared Error). In this study, the largest RMSE is 9.64, and the smallest RMSE is 8.64. This study can be followed by an optimization of the fuzzy membership functions to obtain the prediction results with fewer errors. The optimization can be done by using meta-heuristics algorithms that have been proven successfully implemented for complex problems [14].
ACKNOWLEDGMENT
This research was supported by the local Meteorological and Geophysics Agency Tengger, East Java and Faculty of Computer Science, Brawijaya University.
REFERENCES
[1] S. S. Kashid and R. Maity, “Prediction of monthly rainfall on homogeneous monsoon regions of India based on large scale circulation patterns using Genetic Programming,” J. Hydrol., vol. 454–455, pp. 26–41, 2012.
[2] L. Prabaningrum, T. K. Moekasan, I. Sulastrini, T. Handayani, J. P. Sahat, E. Sofiari, and N. Gunadi, Teknologi Budidaya Kentang di Dataran Medium, 34th ed. Bandung: Balai Penelitian Tanaman Sayuran, 2014.
[3] A. Rosyidah, T. Wardiyati, A. L. Abadi, and M. D. Maghfoer, “Enhancement In Effectiveness Of Antagonistic Microbes By Means Of Microbial Combination To Control Ralstonia solanacearum On Potato Planted In Middle Latitude,” AGRIVITA, vol. 35, no. 2, pp. 174–183, 2013.
[4] A. Iriany, W. F. Mahmudy, AD, and S. Nisak, “GSTAR-SUR Model for Rainfall Forecasting in Tengger Region , East Java,” 1st Int. Conf. Pure Appl. Res. Univ. Muhammadiyah Malang, 21-22 August, no. 1, pp. 1–8, 2015.
[5] N. A. Charaniya and S.V.Dudul, “Design of Neural Network Models for Daily Rainfall Prediction,” Int. J. Comput. Appl., vol. 61, no. 14, pp. 23–27, 2013.
[6] E. Vamsidhar, K.V.S.R.P.Varma, P. S. Rao, and R. Satapati, “Prediction of Rainfall Using Backpropagation Neural Network Model,” Int. J. Comput. Sci. Eng., vol. 02, no. 04, pp. 1119–1121, 2010.
[7] A. P. Jacquin and A. Y. Shamseldin, “Development of rainfall – runoff models using Takagi – Sugeno fuzzy inference systems,” J. Hydrol., vol. 329, pp. 154–173, 2006.
[8] M. C. Valverde, E. Araujo, and H. C. Velho, “Neural network and fuzzy logic statistical downscaling of atmospheric circulation-type specific weather pattern for rainfall forecasting,” Appl. Soft Comput. J., vol. 22, pp. 681–694, 2014.
[9] G. Mazenda, A. A. Soebroto, and C. Dewi, “Implementasi Fuzzy Inference System (FIS) Metode Tsukamoto pada Sistem Pendukung Keputusan Penentuan Kualitas Air Sungai,” DORO Repos. J. Mhs. PTIIK Univ. Brawijaya, pp. 1–11, 2015.
[11] B. A. Restuputri, W. F. Mahmudy, and I. Cholissodin, “Optimasi Fungsi Keanggotaan Fuzzy Tsukamoto Dua Tahap Menggunakan Algoritma Genetika Pada Pemilihan Calon Penerima Beasiswa dan BBP-PPA ( Studi Kasus : PTIIK Universitas Brawijaya Malang ),”
DORO Repos. J. Mhs. PTIIK Univ. Brawijaya, no. 15, pp. 1–10, 2015.
[12] A. Rahmi, W. F. Mahmudy, and B. D. Setiawan, “Prediksi Harga Saham Berdasarkan Data Historis Menggunakan Model Regresi,”
DORO Repos. J. Mhs. PTIIK Univ. Brawijaya, no. 12, pp. 1–9, 2015.
[13] X. Xu, X. Zhao, and Y. Liu, “Deviation Methods via Social Review Graph In Evaluation Systems of Online Store,” 2014 Int. Conf. Serv.
Sci. Deviat., pp. 229–232, 2014.