MATLAB™ Implementation of Merletti’s SEMG Model
Nemuel Daniel Pah
Jurusan Teknik Elektro, Universitas Surabaya Jl. Raya Kalirungkut, Surabaya 60292
Email: nemuelpah@ ubaya.ac.id
Abstract
Surface Electromyography (SEMG), the recording of skeletal muscle’s electrical activity detected on skin surface, contains useful information about muscle condition. The researches on SEMG needs a large samples of SEMG signal with various conditions. This requirement often barriers the development of SEMG signal analysis. Some SEMG model was introduced to solve this problem. This paper reports the work to implement SEMG model introduced by Merletti in 1999 with Matlab 6.5. The aim of this work was to provide simple computer tool to create simulated SEMG signals. This paper also presents some simulated signals as well as showing some disadvantage of the model.
Keywords: SEMG, Electromyography, Matlab, Simulation
1. Introduction
Surface electromyography (SEMG) [1] is the recording of skeletal muscle’s electrical activity detected on skin surface. The signal contains useful information for muscle diagnosis as well as SEMG-based human machines interface. The usefulness of the signal has attracted many research activities and has been used in a large number of applications.
One of the difficulties in SEMG research, as well as other biosignal research, is the availability of suitable SEMG signals. The difficulties are due to the ethical, moral, safety, and practical issues regarding the use and extraction of human signals, the availability of proper equipments, the limitation of controlling or manipulating human performance, and the problem if a research involves a large number of population. The main problem is the safety issue since most researches include procedures or devices that are still not completely developed and tested.
Simulated SEMG signal has been introduced to solve the above problem. Besides eliminating the ethical, moral, safety, and practical issues, the use of simulated SEMG also gives two major advantages in SEMG researches. Firstly, the properties of simulated SEMG signal are mathematically identified, therefore, provide known expectation that can be used to measure the performance of the system, developed in a research. Secondly, the properties of simulated SEMG are controllable. It provides the flexibility of creating SEMG signals under controlled conditions which is not always possible with actual SEMG recording due to the anatomy, physiology, and practical limitations.
The ultimate measure of simulated SEMG signals is its similarity to the actual signal. This requirement forms the basic issue in the development of simulated SEMG. Many techniques to simulate SEMG have been developed. Rosenfalck [2] was the first to introduce the mathematical model of muscle’s action potential, the basic form of SEMG signal. Merletti [3] in 1999, extended the work of Rosenfalck by introducing the complete model of surface electromyography.
The paper is organized into several sections covers the basic theory of SEMG, the description of the model, the detail of the Matlab implementation, the simulation, and conclusion.
2. SEMG Signal
Before discussing the model to create simulated SEMG, the following paragraphs will introduce the basic concept of natural SEMG signal. The understanding of this concept is necessary to the understanding of the SEMG model.
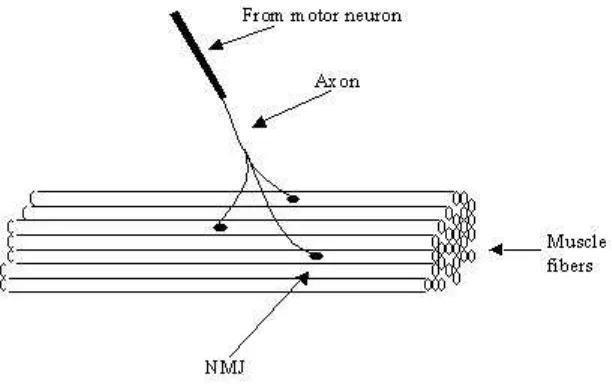
A muscle consists of a large number of muscle fibers that are grouped into several motor units. All the muscle fibers in a motor unit are controlled by a single motor neuron. Depending on the type and the function of the muscle, a motor unit may have different number of muscle fibers. Each fiber is connected to one axon branch of the associated motor neuron at a point called neuromuscular junction (NMJ). NMJ is located in a region (innervation region) approximately in the middle of muscle length. Muscle fibers belonging to one motor unit are distributed pseudo-randomly in the cross-section of the muscle to ensure the equal distribution of the force created by each motor unit as illustrated in Figure 1.
Muscle contraction is a result of the fiber stimulations from motor neurons at the NMJ point. It creates two action potentials on the fiber that propagate from NMJ point to both tendons (muscle’s end point). Although all muscle fibers of a motor unit are stimulated by the same motor neuron, there is a small time-difference (jitter) between the stimulation of each fiber in a motor unit due to the difference in the length of the axon branch. Motor unit action potential (MUAP) is the superposition of all action potentials generated by all fibers in a motor unit as shown in Figure 2. To sustain the force created by a contraction, motor units must be activated repeatedly. The frequency of motor unit stimulation (firing rate) is around 8 – 50 Hz.
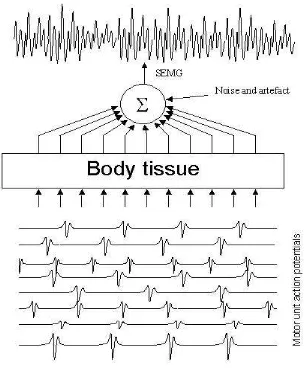
SEMG signal is the accumulation of electrical potentials that appear on the surface of the skin due to the existence of MUAP generated in the muscle fiber. The shape and the amplitude of SEMG signal are also affected by the properties of the body tissue between the muscle fibers and the recording electrodes. The body tissue behaves as an imperfect insulator that tends to attenuate the high frequency components of the signal. Figure 3 illustrates the superposition of the MUAPs trains that results in SEMG signal.
3. Merletti’s SEMG Model
Merletti’s SEMG [3] model was adopted from the action potential model introduced by Rosenfalck [2]. It is based on mathematical model of muscle fiber’s anatomy. The model consists of four parts: model of fibers action potential, model of surface potential, model of motor unit action potential and the simulation of SEMG.
Model of Fiber’s Action Potential
The fiber’s action potential, Vm(z), caused by depolarization of a segment of muscle fiber is mathematically expressed as:
B z z
A z
Vm( )= (λ )3exp(−λ )− (1)
)
where A = 96mV is the amplitude of action potential, B = -90mV is the resting membrane potential, λ is a scale factor in mm-1, C = 1 is a proportionality constant, and z (mm) is the distance from the depolarization front along the fiber’s length. Figure 4 shows the action potential current distribution Im.
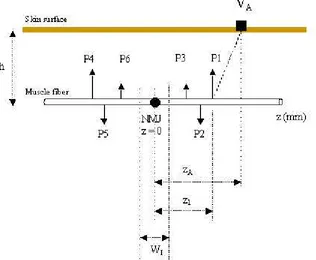
The current distribution (Equation 2) is then represented by three current poles (tripoles) P1, P2 and P3. Each pole is located on the centroid of the current phase while its magnitude is equal to the area under the curve of each phase. The sum and the total moment of the three current poles are zeros. Each time a muscle fiber is stimulated, two tripoles (6 poles) are traveling with a constant conduction velocity (CV) in the opposite directions starting from the NMJ towards both tendons as shown in Figure 5.
Model of Surface Potential
The depolarization poles results in the potential change appears on the skin surface. The potential recorded by a surface electrode located at zA is:
∑
σz/σr is the ratio between the conduction velocity along the fiber and the radial conductivity (Figure 5). The poles are created at the NMJ point at t = 0. If a fiber has a conduction velocity of
An action potential recorded by a surface electrode is shown in Figure 4.
Model of Motor Unit Action Potential
A motor unit consists of N muscle fibers that are stimulated almost synchronously at a rate ranging between 8 and 50 times per second. The NMJ of each fiber in a motor unit is located randomly inside the innervations zone WI, which is located in the middle of the muscle longitude length. The motor unit action potential is simulated by the superposition of N surface potentials V(h,z,t) that originate from all muscle fibers of the motor unit.
Simulation of SEMG
The SEMG signal recorded by a monopolar (single) electrode is the superposition of M motor unit action potentials, located at different depth below the skin and activated semi-randomly.
∑
The SEMG recorded by bipolar electrodes is the difference between SEMG recorded by two monopolar electrodes recorded at two different positions zA and zB.
)
4. MATLAB™ Implementation
MatlabTM as a numerical mathematic tool, is a powerful media to implement the above SEMG model. It has the capability of high-speed mathematic programming language with a large number of ready-used mathematical functions. The following paragraphs detailed the implementation of Merletti’s SEMG model using Matlab 6.5.
STEP 1: Creating a muscle fiber current distribution Im (Equation 2) along 20mm from NMJ with
λ and C both 1. The current distribution is plotted in Figure 4. The following are the Matlab’s command for the process:
z=0:0.05:20; A=96e-3;L=1;C=1;
Im=C*A*L^2*(L*z).*(6-6*L*z+L^2*z.^2).*exp(-L*z);
STEP 2: Calculating P1, P2, and P3 by firstly detecting the zero-crossing points (ZC) followed by the integration of samples in each phase. ZC points are calculated by discretizing all Im values above zero to 1 and below zero to –1, calculating the absolute difference (ImD) between each sample of discretized Im, and locating the absolute differences that are greater than zero as follows:
ImD=abs(diff(Im./abs(Im))); ZC=find(ImD>0);
The poles are calculated with the following instruction:
located at the weight-center of each phase and calculated by locating z value that half the cumulative sum of each phase (zP1, zP2 and zP3) as shown in Figure 4.
K=find(cumsum(Im(1:ZC(1)))>0.5*sum(Im(1:ZC(1)))); zP1=K(1)*dz;
K=ZC(1)+find(cumsum(Im(ZC(1)+1:ZC(2)))<0.5*sum(Im(ZC(1)+1:ZC(2)))); zP2=K(1)*dz;
K=ZC(2)+find(cumsum(Im(ZC(2)+1:length(Im)))>0.5*sum(Im(ZC(2)+1:length(Im)))); zP3=K(1)*dz;
a=zP2-zP1; b=zP3-zP1;
The calculated values are a = 2.05mm and b = -6.60.
STEP 4: Defining the right tripoles (PR1, PR2, and PR3) and the left tripoles (PL4, PL5, and PL6) as shown in Figure 5. The right tripoles is defined by changing the value of samples 1, round((b-a)/CV), and round(b/CV) with P3, P2, and P1 respectively, while the left tripoles is the mirror (flip left-right) version of the right tripoles.
SegRightPot=zeros(1,SegmentLength); SegRightPot(1)=P3;
SegRightPot(round((b-a)/cv))=P2; SegRightPot(round(b/cv))=P1;
FibLeftPot=circshift(fliplr(SegRightPot)',NMJ)';
STEP 5: Using Equation (3) and (4) to generate surface potential VA recorded by a surface electrode located at zA (see Figure 5). The following codes calculate T samples of surface potential (SAP):
HDistRight2ZA=FibRightZ-ZA; for n=1:T,
SAP1(n)=(1/(2*pi*tr))*sum(SegRightPot./sqrt(h^2*Ka+HDistRight2ZA.^2)); FibRightPot=circshift(FibRightPot',1)';
end
HDistLeft2ZA=FibLeftZ-ZA; for n=1:T,
SAP2(n)=(1/(2*pi*tr))*sum(FibLeftPot./sqrt(h^2*Ka+HDistLeft2ZA.^2)); FibLeftPot=circshift(FibLeftPot',-1)';
end
SAP=SAP1+SAP2;
STEP 6: Generating a MUAP of a motor unit with M fibers by repeating the above step M times and accumulate the results.
MUAP=zeros(1,T); for m=1:M,
STEP 7: Generating a SEMG of a muscle with N motor unit by repeating the above step 100 times and accumulate the results.
SEMG=zeros(1,T); for n=1:N,
SEMG=SEMG+MUAP; end
STEP 8: A dipole SEMG is generated by simulating SEMG at two different recording point (A and B) and subtract the resulting signals.
SEMGA=SEMG(ZA=10); SEMGB=SEMG(ZB=20); SEMGDipole=SEMGA-SEMGB;
5. Simulation
The above Matlab’s implementation of Merletti SEMG model was used to simulate SEMG signals with the following parameters:
Muscle length: 200 mm Muscle depth: 10 mm Firing Rate: 10 Hz Conduction Velocity: 4 m/s Innervation Region: 10 mm
Ka: 6
σr: 0.33 S/mm
Recording Point A: 40 mm from the muscle’s center Recording Point B: 50 mm from the muscle’s center Length of simulation: 50 ms
Sampling Rate: 5 kHz
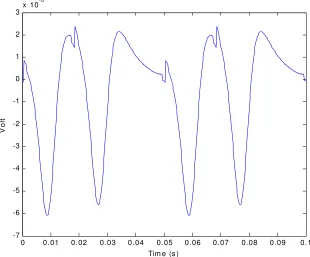
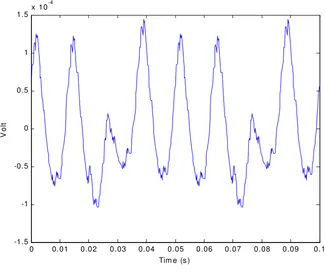
Figure 6 shows a surface potential at recording point A (VA). Figure 7 shows MUAP of a motor unit in the muscle with 5 muscle fiber. Figure 8 shows the monopolar SEMG recorded at point A, while Figure 9 shows a bipolar SEMG recorded at point A and B.
The simulation results shows the similarity to the signal simulated by Merletti. The simulation also shows the weakness of the model in the generation process of action potential. It can be seen from the discontinuity in the signal.
6. Conclusion
References
1. Cram, J.R., G.S. Kasman, and J. Holtz, (1998) Introduction to Surface Electromyography, Aspen Publishers, Inc., Gaithersburg, Maryland.
2. Rosenfalck, P., (1969) Intra- and Extracellular Potential Fields of Active Nerve and Muscle Fibres. Acta Physiologica Scandinavica, Suplementum 321: p. 1-166.
Figure 1. The structure of human muscle. The three muscle fibers connected to a single motor neuron belong to a motor unit.
0 2 4 6 8 10 12 14 16 18 20 -0.15
-0.1 -0.05 0 0.05 0.1
z (m m )
Im (
A
)
P 1
P 2
P 3
Figure 4. Action potential current distribution with the tripoles
P1
,
P2
, and
P3
.
0 0.005 0.01 0.015 0.02 0.025 0.03 0.035 0.04 0.045 0.05 -14
-12 -10 -8 -6 -4 -2 0 2 4 6x 10
-6
Tim e (s )
V
o
lt
Figure 6. The surface action potential recorded at zA.
0 0.01 0.02 0.03 0.04 0.05 0.06 0.07 0.08 0.09 0.1
-7 -6 -5 -4 -3 -2 -1 0 1 2 3x 10
-5
Tim e (s )
V
o
lt
0 0.01 0.02 0.03 0.04 0.05 0.06 0.07 0.08 0.09 0.1 -1.5
-1 -0.5 0 0.5 1 1.5x 10
-4
Tim e (s )
V
o
lt
Figure 8. SEMG recorded at zA..
0 0.01 0.02 0.03 0.04 0.05 0.06 0.07 0.08 0.09 0.1 -2.5
-2 -1.5 -1 -0.5 0 0.5 1 1.5
2x 10
-4
Tim e (s )
V
o
lt