ii
CONTENTS
PAGE
Welcome Speech from Dean, Faculty of Engineering, Mahidol University x
Conference Committee xii
Conference Sponsor xv
Keynote Speaker xvi
Program Overview xvii
Session 1 – Rail Transportation
Using Innovative Solutions in Rail Network Planning and Evaluation
Nate Chanchareon 1
The Establishment and Location Analysis of Dry Port: A Case of Southern Thailand
Kraisee Komchornrit and Waressara Weerawat 2
Statistical Analyses of Motivations to Participate in A Rail Focused Extra-Curricular Activity and Its Short Terms Personal Impacts
Anna Fraszczyk, Dmytro Drobisher and Marin Marinov 14
Session 2 – Current Supply Chain Focus
Impact of Climate Change on Supply Chain Network: A Systematic Literature Review
Hendrik Wurtmann and Abhijeet Ghadge 32
Development of a Disaster Relief Logistics Model Minimizing the Range of Delivery Time
Kei Kokaji and Yasutaka Kainuma 40
Cars Evacuation Plan in the Event of Flooding: A Case Study of Urban Hat YaiSongkhla Province
Jirasuk Panitchkul, Sakesun Suthummanon, Wanatchapong Kongkaew
and Sirirat Suwatcharachaitiwong 49
Demand and Supply Integration: A Case Study of Marché International De Rungis – France
Juan Marcelo Gomez, Jennyfer Kuanji, Ahmed Kaouachi and Andreas Ioannides 57
A Distance and Population-Based Location for Thailand’s Logistics Hub
iii
Impacts of ASEAN Open Skies Policy On Air Cargo Industry in Thailand
Araya Sakburanapech 78
Understanding Tourist Movement Pattern: Value Chain Approach
Putu Giri Artha Kusuma, Senator Nur Bahagia, Lucia Diawati and Myra P. Gunawan 86
Lean Six Sigma Guideline for Made-to-Order Production Industry
Yutthaphon Khayankit and Jirapan Liangrokapart 98
The Impact of Culture on Mobile Phone Purchasing: A Comparison between Thai and British Consumers
Monthathip Srikes 110
Session 4 – Industry
Business Process Management Practice for Micro Enterprise in Indonesia
Mahendrawathi Er, Nyoman Pujawan and Umi Chotijah 115
Preventive Maintenance Strategies: Literature Review and Directions
Ade Supriatna, Moses L. Singgih, Nani Kurniati and Erwin Widodo 127
A Conceptual Model for Supplier Integration and Development in the Thai Automotive Industry
Porpan Vachajitpan and Nichakorn Thongplew 140
Building in Quality Through Equipment Maintenance: A New Approach for Managing Production System
Nani Kurniati and Yulia Hening 152
Reshaping Business Models for Digital Era in Manufacturing Industries Supply Chains
Jukka Hemilä 160
The Estimation of the Cost of Service and Repair of Spare Parts to Support the Warranty Period
Valeriana Lukitosari, Suparno, I Nyoman Pujawan, and Basuki Widodo 169
Facility Location Model for Oil and Gas Industry: A Case Study of an Oil and Gas Company in Indonesia
Dody Hartanto and Muhammad Fazlurrahman Arief 178
Defect Reduction from Copper in Hole in Printed Circuit Board
Wanwisa Duantrakoonsil and Assadej Vanichchinchai 188
The Role of Change Agent in Lean Manufacturing Implementation
iv Session 5 – Supply Chain Risk and Uncertainty
Risk Mitigation Strategy for Dairy Products in Indonesia
Dewanti Anggrahini and Putu Dana Karningsih 205
A Social Network Analysis (SNA) Approach to Manage Supply Chain Information Risks
Leon Kok Yang Teo, Duy Dang-Pham, and Mathews Nkhoma. 213
Return and Risk Equivalence among Different Supply Chain Contracts
Shirsendu Nandi 225
Risk Management for Local Logistics Service Provider Focusing on Outbound Road Freight Transportation
Thutchanan Sangwan and Jirapan Liangrokapart 236
Two Risk Assessment and Evaluation Approaches for Critical Logistical Infrastructures
Sascha Düerkop and Michael Huth 248
Supply Chain Risk Management and Stakeholder Analysis in Supply Chain: A Conceptual Model
Syarifuddin Mabe Parenreng , Nyoman Pujawan and Putu Dana Karningsih 256
Risks and Trust Identification for SMEs Assessment
Tawinan Simajaruk and Jirapan Liangrokapart 260
Impact of Pricing Policies on Profit and Revenue of Consumer Product Supply Chain with Uncertain Costs
Chatdanai Kaorapapong and Pisal Yenradee 274
Session 6 – Port and Maritime Logistics
A Simulation Study for Maritime Inventory Routing Problem with Supply and Transportation Disruptions
Nurhadi Siswanto 286
The Latest Seven Years of Maritime Policy: Literature Review and Opportunity for Future Research
Pratomo Setyohadi, Ketut Buda Artana, Djauhar Manfaatand,
and Raja OloanSaut Gurning 296
Prospects of Nearshoring European Manufacturing Located in China to Russia
Yulia Panova and Per Hilletofth 308
Berth Allocation Problem Under Uncertainty: Preliminary Study at Koja Container Terminal
v Session 7 – Transport Management
Vehicle Routing Problem for Optimizing Multi Temperature Joint Distribution On Distribution of Perishable Product
Luki Trihardani 331
Balancing Vehicle Utilization on Capacitated Vehicle Routing Problem with Time Windows8sing Simulated Annealing Algorithm
David T. Liputra, Victor Suhandi and Rifki Ramdani 344
Freight Forwarder's Capacity Booking: A Conceptual Model
Alain Widjanarka, BudisantosoWirjodirdjo, Nyoman Pujawan and Imam Baihaqi 352
Developing Model of Closed Loop Supply Chain Network for Subsidized LPG 3-kgs in East Java-Indonesia
Amelia Santoso, JoniartoParung and Dina N. Prayogo 365
The Practice of Business and IT Integration in the Transport Company Using Enterprise Architecture Framework
Valeriy Kurganov and Aleksey Dorofeev 377
Session 8 – Green Supply Chain
Using the Quantitative and Qualitative Methods for the Modelling of the Green Supply Chain
Blanka Tundys 392
Perception and Adaptation of Sugar Industry Toward Green Logistics in Eastern Area, Thailand
Oranicha Buthphorm 415
Carbon Pricing System for Vehicles Used in Freight Transport
Sattra Vuthy, Ronnachai Tiyarattanachai and Jaruwit Prabnasak 429
Toward Green Library Building Based on Energy Conservation
Putu Karningsih, Udisubakti Ciptomulyono, Arrifah Sari and Bima Sofhananda 441
Session 9 – Simulation Modelling
A Simulation Model for Facility Allocation of New Built Outpatient Department
Soriya Hoeur and Duangpun Kritchanchai 452
Duration of Collaboration from A Market Perspective: An Agent-Based Modeling Approach
Niniet I. Arvitrida, Antuela A. Tako, Duncan Robertson and Stewart Robinson 468
Research on Selecting Logistics Network Considered with Omni-Channel
vi
Drug Inventory Modelling for Internal Supply Chain in the Hospital
Prita Meilanitasari, IwanVanany and Erwin Widodo 490
A Literature Review on Different Models and Solution Approaches on Order Picking Problem
Shirsendu Nandi and Patanjal Kumar 502
Session 10 – Sustainability Logistics & Supply Chain
Sustainability Indicators for Third Party Logistics Providers
Yurawan Nitisaroj and Jirapan Liangrokapart 515
Pursuing Sustainability Via Reverse Logistics: The Symbiosis Effect Between the Local Authorities and Householders
Emy Ezura A Jalil 525
Integrating Life Cycle and Value Stream Mapping to Enhance Total Sustainability
Sri Hartini, Udisubakti Ciptomulyono and Maria Anityasari 539
Cost of Quality, ISO 9001 and its Impact on Corporate Performance: A Literature Review
Muhammad Rosiawan, Moses L. Singgih and Erwin Widodo 554
The Role of Stakeholder Engagement in External Assurance of Sustainability Reporting
Yahaya Yusuf, Emmanuel Olasanmoye, Louise Mc Ardle, Wendy Auchterlounie
and Masha Menhat 565
Designing a Sustainable and Resilient Supply Chain: An Empirical Case Study
Behnam Fahimnia and Armin Jabbarzadeh 566
Session 11 – Healthcare Supply Chain
An Exploratory Study of Healthcare Supply Chain
Duangpun Kritchanchai and Sineenart Krichanchai 567
Identification of Key Factors for Healthcare Group Purchasing Development: A Literature Review
Bundid Kungwannarongkun and Jirapan Liangrokapart 582
Factors Affecting IT Projects Success: Case of Healthcare Flows
Smaïl Benzidia, Omar Bentahar, Meriam Karaa and Blandine Ageron 596
Towards A Process Reference Model for Healthcare Supply Chain
Wirachchaya Chanpuypetch and Duangpun Kritchanchai 608
A Conceptual Framework of Internal Flexibility in Healthcare Service Operations: Role of Advanced Medical Technologies and Operations Improvement Practices
vii
Process Analysis for Blood Supply Chain Using Event Log
Iwan Vanany, Anny Maryani, Prita Meilanitasari, Erma Suryani and Bilqis Amaliah 628
Block Appointment Scheduling at a Specialty Clinic: A Case Study
Rajesh Piplani 636
Building sustainable service supply in primary care unit
Phallapa Petison 637
Session 12 – Apparel Supply Chains and Corporate Social Responsibility
Supply Chains and Products: A Marketing Production-Perspective
George Hadjinicola 638
Value Co-Creation in Services Flow for the Competitiveness of Supply Chain: Conceptual Framework
Umer Mukhtar, Sarwar M. Azhar and Tashfeen M. Azhar 645
The Future of Customer Value-Multi-Industry Insights of Value Determinants in Service Networks
JyriVilko, Nina Helander and Marko Seppänen 646
Implementation of Social Compliance of the Apparel Industry: A Challenging Road Ahead
Suraiyah Akbar and Kamrul Ahsan 657
Imbalancing Between Demand and Supply of Manpower for Textile Industry in Thailand
Walailak Atthirawong, Ronnachai Sirovetnukul, Kanogkan Leerojanaprapa,
Wariya Panprung and Tanawat Ruangteprat 680
Creating Market Responsiveness through Cross-Functional Integration
Ana Beatriz Murillo Oviedo, MarcioLopes Pimenta and Per Hilletofth 691
Session 13 – Food Supply and Distribution
Network Constraints of Reallocating Seafood Freight from Road to Sea Transport
Per Engelseth, Irina V. Karlsen, Shulin Huang and Arild Hoff 703
Food Security is None of Your Business? Food Supply Chain Management in Support of Sustainable Food System
Ari Paloviita 715
Design for Mass Customization in Food Industry: Literature Review and Research Agenda
viii
Contracts in Supply Chain of Fishery Product Considering Traceability and Regulatory Compliance
Winda Narulidea, Oki Anita Candra Dewi and Luki Trihardani 738
Model Development of Supply Chain Network for Fresh Agricultural Products in East Java by Considering the Levels of Product Quality
Joniarto Parung, Amelia Santoso and Dina N. Prayogo 752
Integrated Analysis of Short Food Supply Chain Solution In Order To Design a Suitable Logistics Solution
Alexis Nsamzinshuti and Alassane BalléNdiaye 764
Session 14 – Logistics Management
Supplier Selection Model Considering Truckload Shipping
Purnawan Adi Wicaksono, Bambang Purwanggono,I Nyoman Pujawan,
and Erwin Widodo 781
The Impact of Customer Orientation of Service Employees on Customer Satisfaction, Commitment and Retention in Logistics Service Providers
Imam Baihaqi and Berto Mulia Wibawa 792
Delivery Planning of Last Mile Logistics Considering Absence Probability on Each Term
Yuki Shigeta, Kazuho Yoshimoto and Shunichi Ohmori 799
The Estimating Transportation Time for Item Picking in Warehouse Considered with Item Characteristics and External Factors
Taisuke Kasuga, Kazuho Yoshimoto and Shunichi Ohmori 811
The Mix-Method Pallet Loading Problem With a Variety of Box Sizes Under Weight and Height Limitation: A Case Study of Indoor and Outdoor Lighting Products
Phatcharee Toghaw Thongrattana and Kajornnat Deonphen 822
Vehicle Routing Problem with Pickup and Delivery by Considering Time
Window, Last-In First-Out, /RDGLQJDnd Maximum Route Duration Constraints
Suprayogi and Andriansyah Andriansyah 830
A Time-Dependent Vehicle Routing Algorithms for Medical Supplies Distribution Under Emergency
Tsai-Yun Liao, Ta-Yin Hu and Yu-Wen Wu 840
Session 15 – Information Technology and Supply Chain Management
Industry 4.0: What Does It Mean to Supply Chain Management?
ix
Enterprise Resource Planning System Implementation: An End-User Perspective
Ewout Reitsma, David Wewering and Per Hilletofth 865
Can Improved Transparency Reduce Supply Chain Risks in Cloud Computing?
Olusola Akinrolabu and Steve New 877
A review of the Efficiencies of Big Data Analytics in Supply Chain Janya Chanchaichujit, Albert Tan, Wuigee Tan
and Sandhya Cheramparampil Surendran 893
ICT Use in Higher Education: Satisfaction with MOODLE as A Learning Management System
Aleksander Aristovnik, Nina Tomazevic, Lan Umek and Damjana Kerzic 902
Computerized Maintenance Management System: Literature Review
Donladit Mueangman 913
Influence of Cognitive Aspect and Affective Aspects on The Usability Performance of E-Commerce
Heru Prastawa, Udisubakti Ciptomulyono, Moses Laksono Singgih
and Markus Hartono 923
Session16 – Optimization and Operation Research
Optimization of Cambering Process by Determination of Process Parameter to Improve of Parabolic Leaf Spring
Evelyn DwiLavinia, Ig. Jaka Mulyana, and Ivan Gunawan 935
Optimizing Mean and Variance Simultaneously in Multiple Response Optimization Problems
Sasadhar Bera and Indrajit Mukherjee 946
Application of Optimization Modeling to Derive an Engineering Characteristic in QFD
Dian Retno Sari Dewi and Elisa Yuanita 955
Decision on Optimal Display Space Following Demand Fluctuation
Kazuki Ishichi, Kazuho Yoshimoto and Shunichi Ohmori 962
The Adopting of Markov Analysis to Forecast the Operations Competitive Advantages of Mobile Phone Service Providers: The Case of Jordan
Yazan Khalid Abed-Allah Migdadi 973
Capacity Reservation and Utilization for A Manufacturer with Uncertain Capacity and Demand
x
Critical Operations Capabilities in A High Cost Environment: A Focus Group Study
xviii
x ReportbyAssoc.Prof.Dr.DuangpunKritchanchai,OSCMGeneralCoChair,MahidolUniversity,Thailandand
Prof.NyomanPujawan,OSCMGeneralCoChair,InstitutTeknologiSepuluhNopember(ITS),Indonesia
x WelcomeaddressbyAssist.Prof.Dr.YodchananWongsawat,ViceDeanforGraduateStudiesandInternationalRelationsoftheFacultyofEngineering,MahidolUniversity
x OpeningaddressbyMr.TeeraAnantaseriwidhya,ViceGovernorofPhuketProvince
xix
xxii
OSCM 2016– PROGRAMOVERVIEW
Paper170:AreviewoftheEfficienciesofBigData AnalyticsinSupplyChain
JanyaChanchaichujit,AlbertTan,WuigeeTanand SandhyaCheramparampilSurendran
Paper121:Decisionon OptimalDisplaySpace FollowingDemandFluctuation
KazukiIshichi,KazuhoYoshimotoand ShunichiOhmori
Paper130:ICTUseinHigherEducation: SatisfactionwithMOODLEasALearning ManagementSystem
AleksanderAristovnik,NinaTomazevic,LanUmek andDamjanaKerzic
Paper86:TheAdoptingofMarkovAnalysisto ForecasttheOperationsCompetitive
AdvantagesofMobilePhoneServiceProviders: TheCaseofJordan
YazanKhalidAbedAllahMigdadi
Paper148:ComputerizedMaintenance ManagementSystem:LiteratureReview
DonladitMueangman
Paper156:CapacityReservationandUtilization forAManufacturerwithUncertainCapacityand Demand
YoussefBoulaksil Paper50:InfluenceofCognitiveAspectand
AffectiveAspectsonTheUsabilityPerformanceof ECommerce
HeruPrastawa,UdisubaktiCiptomulyono, MosesLaksonoSinggihandMarkusHartono
Paper91:CriticalOperationsCapabilitiesinA HighCostEnvironment:AFocusGroupStudy
CinziaSansone,PerHilletofthandDavidEriksson
15:30–15:45 CoffeeBreak
15:45–17:30
SCHOLARDEVELOPMENTPROGRAM PartI:CriticalAspectsofSuccessfulAcademics
PartII:ResearchandPublishing
17:45–20:30
GalaDinner&Awards
x18:30–18:45ClosingRemarksbyAssist.Prof.Dr.YodchananWongsawat,ViceDeanforGraduateStudiesandInternationalRelationsoftheFacultyofEngineering,MahidolUniversity
x18:45–19:00BestPaperAwardsAnnouncementbyProf.Dr.NyomanPujawan,OSCMGeneralCoChair,InstitutTeknologiSepuluhNopember(ITS),Indonesia
MODEL DEVELOPMENT OF SUPPLY CHAIN NETWORK FOR
FRESH AGRICULTURAL PRODUCTS IN EAST JAVA BY
CONSIDERING THE LEVELS OF PRODUCT QUALITY
Joniarto Parung
Department of Industrial Engineering, University of Surabaya, Surabaya 60293 Indonesia, E-mail: [email protected]
Amelia Santoso
Department of Industrial Engineering, University of Surabaya, Surabaya 60293 Indonesia, E-mail: [email protected]
Dina Natalia Prayogo
Department of Industrial Engineering, University of Surabaya, Surabaya 60293 Indonesia, E-mail: [email protected]
ABSTRACT
East Java is one of the contributing provinces, the largest in Indonesia, for fresh agricultural products, such as fruits and vegetables. Fresh agricultural products are category of perishable product. Perishable products will decrease the level of quality and value of products in line with increasing time. In order for fresh agricultural products produced by farmers can be consumed by consumers in the right quantity, right quality, right place, right time and right price, it is necessary to design a supply chain network model for fresh agricultural products by taking into account the level of product quality. This paper discussed the model development of supply chain network for fresh agricultural products in East Java by considering the level of product quality. Supply chain of fresh agricultural products consists of farmers, wholesalers, distributors and retailers. Supply chain network optimization model has an objective of maximizing the total supply chain profits. A numerical example is presented as the application of supply chain network optimization model for fresh agricultural products. The optimal result of supply chain network can be a recommendation to the East Java provincial government in the regulation of the distribution system of fresh agricultural products.
Keywords: supply chain network design, fresh agricultural products, the level of product quality
1. INTRODUCTION
Logistics is part of a supply chain that is associated with the movement and storage of goods at the same time with regard to the flow of money and information. Based on this insight, it is known that the logistics are much related to the ease of supply of goods in the region. It also indicates that, logistics plays a key role in the growth of industry and the economy of a region. A key role is also occur because logistics is a major cost component for businesses and intertwined with many other economic activities.
The key success factors in a holistic logistics management become an important requirement which directly or indirectly have an impact on economic growth in the region. Indicators of success of logistics management in general can be viewed from the aspect of
availability, flexibility and cost efficiency. The indicators related to the availability of goods and services at the right time and place while still having the flexibility amount and timing of the distribution in a region of the logical price. However, these three indicators of the success of the logistics often becomes irrelevant for fresh agricultural products due to the following factors: a. availability of goods is influenced by the short time gap between the time supply of the product by the producers to the time of consumption; b. Total supply is inconsistent because of the influence of the season; c. Prices fluctuate according to the season and d. Local government policy towards fresh agricultural products.
Fresh agricultural products are products that should be consumed immediately to prevent damage without the need for advanced preservation process, because the logistics system including distribution and transportation are the factors that need to holistically design to increase the range of the location of demand for agricultural products fresh while increasing the benefits for consumers and producers. Fresh agricultural products can be categorized into groups of vegetables and fruits.
In general, fresh agricultural products produced in East Java province, including the largest in the country. The products come from centers of different manufacturers, such as fruits of Batu, Pasuruan, Probolinggo and Blitar while the vegetables come from producers in Batu Sentra, Lumajang, and Bondowoso. That means handling of fresh agricultural products need special attention. Special attention is that its impact can be felt by the actors in the supply chain is the improvement of logistics systems able to provide mutual benefit to the parties involved in the supply chain of fresh agricultural products. Based on the above background can be expected, there are several factors that affect the availability of fresh agricultural products in East Java. That means the main issues addressed in this study is to design a supply chain network model for fresh agricultural products that can improve the welfare of society and the economy of the region.
The remainder of this paper is organized as follows. Section 2 will discuss the literature review related to supply chain network of fresh agriculture product as perishable products. Section 3 presents problem statements to be solved. In section 4 we develop the optimization model for supply chain network design for fresh agriculture products by considering the product quality level. A numerical example is provided in Section 5, to illustrate the application of the models, and discuss the results. In Section 6, we present our concluding remarks.
2. LITERATURE REVIEW
Some research has been done by Parung associated with the discovery models to improve the contribution of the perpetrators of the supply chain (supply chain) and increase added value as a consequence of cooperation in the supply chain. Various studies have been published in the journal Parung International and national journals as well as in international and national seminars. The topics supply chain including how to create added value within a supply chain (Bititci et al., 2004), how to manage synergies in a supply chain to increase the value (Bititci et al., 2007), to assess the role of intellectual capital in a business cooperation to improve value (Parung, 2008), then design the measurement model to determine the contribution of supply chain actors and factors affecting the sustainability of cooperation in the supply chain (Parung and Bititci, 2006). Furthermore Parung to study future trends in supply chain (Parung, 2013) which shows that the logistics and supply chain food supply chain is the main trend of the present and the future that it becomes a priority concern for humans until 2050. This is supported by data from the FAO said, that the world requires a 70% increase in global food production to the needs of a growing population of 2.4 billion. But at the same time a lot of the land has been converted into housing and infrastructure facilities.
Currently the world population reached 6.7 billion people. This population is expected to grow 30% to reach a total population 9 billion in 2050. But it is regrettable that 15% of the world population still difficulties in meeting their basic needs despite the global production amount are still insufficient. Factors that cause food products are not well distributed logistics system that is not well ordered. Studies conducted Parung in 2013 need to be developed specifically to understand fresh agricultural products.
Ahumada and Villabolos have studied a major contribution in the areas of production and distribution planning for agricultural products. They focus primarily on models which had been successfully implemented. Models are classified in according to relevant features, such as optimization approach used, the type of plants modeled and planning scope. Through their analysis of the state of current research, they diagnose some future needs for modeling the supply chain of agricultural products. (Ahumada and Villalobos, 2009)
Research conducted by Yu and Nagurney focus on the quality of perishable products between production and consumption locations that pose unique challenges for supply chain management. In particular, they developed a network-based agriculture supply chain model in oligopolistic competition with a concentration in fresh agricultural products, such as vegetables and fruits. Every company involved in the agriculture supply chain activities such as the production, processing, storage, distribution, and even the disposal of food products, will attempt to determine the optimal amount of product flow along the supply chain, to maximize the total profit (Yu and Nagurney, 2013). Borodin et al. has mastered the latest advances and developments in the application of operations research methodology to deal with the uncertainty that occurs in the agricultural supply chain management issues. (Borodin et al., 2016). In addition, An and Ouyang have developed a bi-level robust optimization model, where a food company to maximize profits and minimize post- harvest losses by deploying processing yields / storage facility and determine the purchase price, while a group of spatially distributed farmers' non-cooperative determine the time of harvest, shipping, storage, and market-decisions under yield uncertainty and market equilibrium (An and Ouyang, 2016).
3. PROBLEM STATEMENT
Supply chain network for fresh agriculture products consist of several entities, i.e.: all of farmers, wholesalers, distributors and retailers. The wholesalers will contact farmers to negotiate the price and the number of crops that will be purchased for any time period. Fresh agriculture product which harvested by each farmer is a product with the highest quality level (the first quality level). Farmers will harvest a certain number of products according to the order quantity resulting from the negotiations with the wholesalers, which do not exceed the maximum amount of product that can be harvested by each farmer, so no crop is left at the farm level in each time period.
After negotiating the price and order quantity to be purchased, the wholesalers do the retrieval yields in some farmer locations using a vehicle owned. Each farmer will be visited by a maximum of one vehicle from several vehicles owned by the wholesaler. Each vehicle is used as efficiently as to some farmer locations and brought back to the wholesaler location to be inspected, cleaned and packed according to the capacity of the wholesaler in each time period.
Furthermore the wholesaler will make deliveries of fresh agricultural products to several distributors according to the price and the order quantity for each product quality level. Unsold products will be stored and decreased the level of product quality at the next time period. Decreased levels of product quality will be followed by a decrease in the sales value of the product. At each time period, the retailer will be supplied by a maximum of single distributor.
Retailers will go to the distributor to purchase products for selling in traditional markets. While demand for fresh agricultural products at the retailer level unfulfilled will be considered as lost sales. At the level of wholesalers, distributors and retailers, there are a limitation of warehouse storage capacity for products that have not been distributed to the next downstream level. The distribution mechanism in a supply chain network for fresh agriculture products is shown in Figure 1.
Wholesaler Farmer
Farmer Farmer
Farmer
Distributor
Distributor
Distributor
Retailer
Retailer ROUTE
ROUTE Collect harvest result
Deliver agriculture product
Come and buy product
Come and buy product
Figure 1. Supply chain network for fresh agriculture products
4. MODEL DEVELOPMENT
The model development of supply chain network for fresh agriculture products in East Java is based on the mechanism of the yields distribution system of farmers through wholesalers, distributors and retailers, as described in the above problem statements. The notation of mathematical model consists of the indices, model parameters, decision variables, objective function and the constraints that need to be considered in the supply chain network model for fresh agricultural products.
Indexes:
F : sets of farmers W : sets of wholesalers D : sets of distributors R : sets of retailers
V : sets of wholesaler’s vehicles
T : sets of time period
Q : sets of product quality levels
Model Parameters:
: Product demands at retailer rin time period t
: Selling price of products with the quality level q at retailer rin the time period t.
q= 1 for the best of product quality levels
: Lost sales cost at retailrin the time period t
: Ordering cost from wholesaler wto farmer f
: Ordering cost from distributor dto wholesaler w
: Fixed costs occurred at farmer f for harvesting in a time period
: Variable cost at farmer ffor harvesting in a time period
: The inspection, sorting, cleaning and packaging costs per ton for each level of product quality qat wholesaler w
: The inspection and re-packaging costs per ton for each level of product quality q at distributor d
: Carrying inventory cost for each level of product quality qat retailer r
: Carrying inventory cost for each level of product quality qat distributor d
: Carrying inventory cost for each level of product quality qat wholesaler w
: Fixed transportation cost of using vehicle vthat owned by wholesaler w
: Transportation cost from wholesaler wto farmer f by using vehicle v
: Transportation cost from wholesaler wto distributor dby using vehiclev
: Transportation cost from retailer rto distributor d
: Initial inventory of product quality level qat retailer r
: Initial inventory of product quality level qat distributor d
: Initial inventory of product quality level qat wholesaler w
: Warehouse storage capacity at retailer r
: Warehouse storage capacity at distributor d
: Warehouse storage capacity at wholesaler w
: Re-packaging capacity for each product quality level qat distributor d
: Inspection, sorting, and packaging capacity for each product quality level q at wholesaler w
: Harvesting capacity of farmer f in time period t
: Capacity of vehicle vthat owned by wholesaler w
Decision variables:
: Number of satisfied demands for product quality level qat retailer rin time period t
: Number of satisfied demands at retailer rin time period t
: Number of lost sales units at retailer rin time period t
: Inventory level of product quality level qat retailer rin time period t
: Inventory level of product quality level qat distributor din time period t
: Inventory level of product quality level qat wholesaler win time period t
: Binary decision variables, equal to 1 if retailer r supplied by distributor d in the time period t
: Binary decision variables, equal to 1 if distributor d supplied by the wholesaler w in the time period t
: Binary decision variables, equal to 1 if distributor d supplied by the wholesaler w by using vehicle v in the time period t
: Binary decision variables, equal to 1if vehicle vthat owned by wholesaler wis used for delivering products to distributors in time period t
: Binary decision variables, equal to 1 if vehicle v that owned by wholesaler w is used for taking products from farmers in time period t
: Binary decision variables, equal to 1 if wholesaler w supplied by farmer f and taken products by using vehicle v in time period t
: Binary decision variables, equal to 1 if wholesaler w supplied by farmer f in time period t
: Binary decision variables, equal to 1 if farmer fharvests the products in the time period
t
: Number of products delivered from wholesaler w to distributors by using vehicle v in time period t
: Number of products taken by wholesaler w from farmers by using vehicle v in time period t
: Number of products harvested by farmer fduring the time period t
: Number of product yields from farmer f that purchased by wholesaler w and transported by using vehicle v in time period t.
: Number of products with quality level q that delivered from wholesaler wto distributor d by using vehicle vin time period t.
: Number of products delivered from wholesaler w to distributor d by using vehicle vin time period t.
: Number of products with quality level q that delivered from distributor dto retailer rin time period t.
Supply chain network optimization model for fresh agriculture product has the objective function of maximizing the total supply chain profits (TPSC) where Total supply chain profit is the difference between total sales revenues (TRSC) of all of product quality levels and total supply chain costs (TCSC).
(1)
Total sales revenue of the overall product quality levels is the total sales value of satisfied demand from each quality level of fresh agricultural products
(2)
Total supply chain costs consist of the total costs across the agriculture supply chain members, starting from the farmers (TCF), wholesalers (TCW), large market (TCD) to traditional markets (TCR)
(3)
Total farmers costs consist of total fixed costs if farmers harvest in a period and the total variable cost which depending on the number of agriculture products harvested by farmers during the entire planning horizon.
(4)
Total costs at the wholesalers consist of the total ordering cost to the farmers, the total transportation fixed costs and the total transportation variable cost from the wholesalers to the farmers, the total cost of inspection, cleaning products and packaging for each level of product quality, total holding inventory cost for all of product quality levels.
(5)
Total costs at the distributors consist of the total ordering cost to the wholesalers, the total transportation fixed costs and the total transportation variable cost from wholesalers to the distributors, the total cost of weighting and re-packaging for each level of product quality, total holding inventory cost for all of product quality levels.
(6)
Total costs at the retailers’ level consist of the total transportation costs from retailers to distributors, the total holding inventory costs of all product quality levels and total lost sales costs g y p q y
(7) Farmer stage;
Total number of harvest products of each farmer at any time period will be sold out by wholesalers so there are no excess crops stored by farmers as an inventory for the next period. The amount of products harvested by each farmer does not exceed the harvesting capacity at each time period. There are a minimum number of harvested products at each farmer which depend the harvest capacity at any time period.
(8)
(9)
(10) Wholesaler stage;
Maximum single vehicle will be used to transport products harvested from every farmer and every vehicle can be used for transporting the harvest purchased from some farmers in the capacity of the vehicle used by the wholesaler. Each wholesaler can be supplied by more than one farmer at each time period. Products purchased by wholesalers from each farmer is a product of the highest quality level, and will decrease the level of product quality if it is not sold and stored as inventory for the next period. All products purchased from farmers will be packed in accordance with the capacity limits at every wholesaler and excess unsold products will be stored in a warehouse with a certain storage capacity.
(11) (12) (13) (14) (15) (16) (17) (18) (19) (20)
(21) (22) (23) (24) Distributor stage;
The products have been packaged by the wholesaler according to each level of product quality will be shipped to distributors in according to the ordered quantities of each distributor. Delivery of products to each distributor uses only one vehicle from the wholesaler. Each vehicle is used to make deliveries to several distributors in limitation of the vehicle capacity. Each distributor can be supplied by more than one wholesaler. Products received by each distributor will do the weighing and repackaging in according to the packing capacity for each product quality level. The same case in wholesaler, any unsold products will be stored as inventories for the next period and will decrease the level of product quality. The amount of stored products does not exceed the capacity of the storage warehouse at each distributor.
(25) (26) (27) (28) (29) (30) (31) (32) (33) (34) (35) (36)
Retailer stage;
Product demands in the retailer met from various levels of product quality and shortages that occur are treat as lost sales. Each retailer will purchase products at a distributor and every retailer is only supplied by one distributor in each time period. Purchased products from distributors are used to meet a certain minimum number of total demands that occur at the retailer in any period of time. Overstocks from various levels of product quality are stored as inventory for the next time period, without exceeding the capacity of the storage warehouse at each retailer.
(37) (38) (39) (40) (41) (42) (43) (44) (45)
Binary variables and non negativity constraints
(46) (47)
5. RESULTS AND DISCUSSION
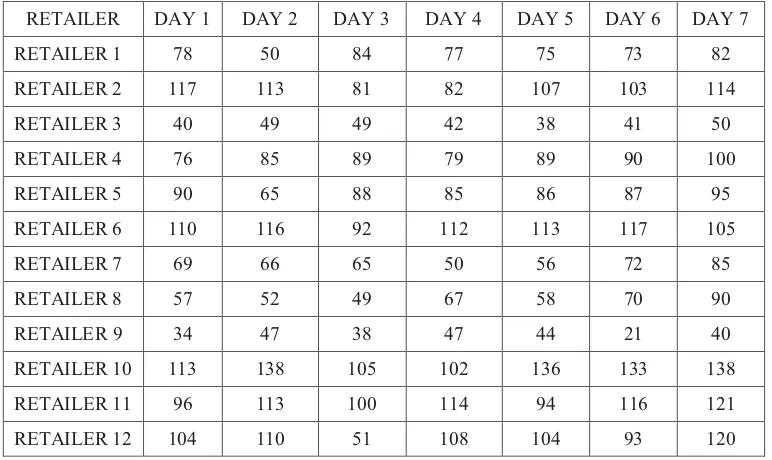
The result of model development of supply chain network model for fresh agricultural products in East Java applied to numerical illustration for product cayenne those involving five farmers, two wholesalers, four distributors and 12 traditional markets as retailers. Tables 1 until Table 16 are the data for cayenne supply chain network design in East Java.
Table 1. Product demand at each retailer for each time period (ton/day)
RETAILER DAY 1 DAY 2 DAY 3 DAY 4 DAY 5 DAY 6 DAY 7
RETAILER 1 78 50 84 77 75 73 82
RETAILER 2 117 113 81 82 107 103 114
RETAILER 3 40 49 49 42 38 41 50
RETAILER 4 76 85 89 79 89 90 100
RETAILER 5 90 65 88 85 86 87 95
RETAILER 6 110 116 92 112 113 117 105
RETAILER 7 69 66 65 50 56 72 85
RETAILER 8 57 52 49 67 58 70 90
RETAILER 9 34 47 38 47 44 21 40
RETAILER 10 113 138 105 102 136 133 138
RETAILER 11 96 113 100 114 94 116 121
RETAILER 12 104 110 51 108 104 93 120
Table 2. Fixed and variable costs while farmers planting over a time period
FARMER Fixed cost (Rp.) Variable cost (Rp./ton)
FARMER 1 1,500,000 30,000
FARMER 2 1,800,000 25,000
FARMER 3 2,000,000 28,000
FARMER 4 2,200,000 32,000
FARMER 5 2,500,000 24,000
Table 3. Cost of inspection, sorting and packing per ton for each level of product quality at each wholesaler (Rp./ton)
WHOLESALER QUALITY 1 QUALITY 2 QUALITY 3 QUALITY 4 QUALITY 5 QUALITY 6 QUALITY 7
WHOLESALER 1 200 195 190 170 155 150 135
WHOLESALER 2 250 240 230 225 215 200 190
Table 4. Cost of inspection and re-packing per ton for each level of product quality at each distributor (Rp./ton)
DISTRIBUTOR QUALITY 1 QUALITY 2 QUALITY 3 QUALITY 4 QUALITY 5 QUALITY 6 QUALITY 7
DIST 1 450 440 420 400 390 370 350
DIST 2 500 480 470 460 430 410 390
DIST 3 400 370 340 320 290 270 260
DIST 4 350 340 320 300 290 280 260
Table 5. Capacity of warehouse storage at each wholesaler and distributor (tons)
WHOLESALER WAREHOUSE
CAPACITY DISTRIBUTOR
WAREHOUSE CAPACITY
WHOLESALER 1 250 DIST 1 150
WHOLESALER 2 200 DIST 2 100
DIST 3 125
DIST 4 150
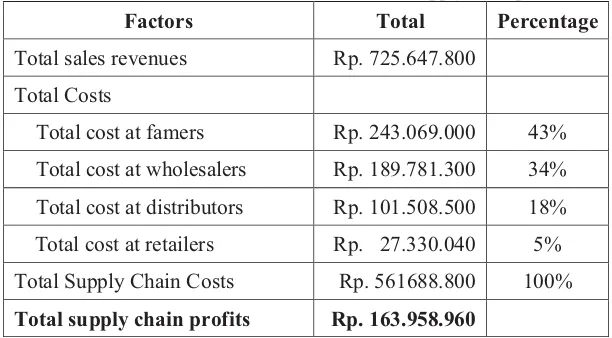
Based on the optimal solution of the supply chain networks model for cayenne product in East Java obtained the total logistics costs that occur at each supply chain member and the maximum total supply chain profits as shown in Table 6. It appears that the greatest percentage of the total cost occur at farmer stage as producers in the supply chain network. The next ranking is the main logistics activity of wholesalers with transportation to farmers and distributors and performing the processes of inspection, sorting and packing.
Table 6. Distribution of the total cost and total supply chain profits
Factors Total Percentage
Total sales revenues Rp. 725.647.800
Total Costs
Total cost at famers Rp. 243.069.000 43%
Total cost at wholesalers Rp. 189.781.300 34%
Total cost at distributors Rp. 101.508.500 18%
Total cost at retailers Rp. 27.330.040 5%
Total Supply Chain Costs Rp. 561688.800 100%
Total supply chain profits Rp. 163.958.960
Optimal decision for the number of satisfied demands at each retailer for each time period are shown in Table 7.
Table 7. Total satisfied demands at each retailer in each time period (tons)
RETAILER DAY 1 DAY 2 DAY 3 DAY 4 DAY 5 DAY 6 DAY 7
RETAILER 1 78 50 84 77 75 73 58
RETAILER 2 117 113 81 82 107 103 80
RETAILER 3 40 49 49 42 38 29 35
RETAILER DAY 1 DAY 2 DAY 3 DAY 4 DAY 5 DAY 6 DAY 7
RETAILER 4 76 85 89 79 89 63 70
RETAILER 5 90 65 88 85 86 87 67
RETAILER 6 110 116 92 112 113 85 74
RETAILER 7 69 66 65 50 40 51 60
RETAILER 8 57 52 49 67 58 70 82
RETAILER 9 34 47 38 47 44 21 28
RETAILER 10 113 138 105 102 136 133 97
RETAILER 11 96 113 100 114 94 82 85
RETAILER 12 104 110 51 108 85 93 84
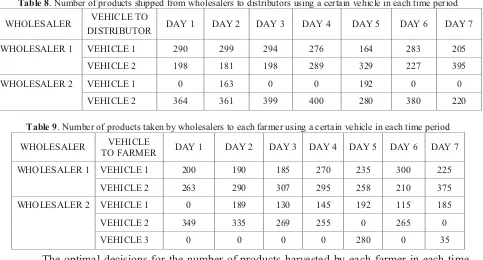
The number of products taken from farmers and delivered to the distributor by the respective wholesalers at each time period is shown in Table 8 and Table 9.
Table 8. Number of products shipped from wholesalers to distributors using a certain vehicle in each time period
WHOLESALER VEHICLE TO
DISTRIBUTOR DAY 1 DAY 2 DAY 3 DAY 4 DAY 5 DAY 6 DAY 7
WHOLESALER 1 VEHICLE 1 290 299 294 276 164 283 205
VEHICLE 2 198 181 198 289 329 227 395
WHOLESALER 2 VEHICLE 1 0 163 0 0 192 0 0
VEHICLE 2 364 361 399 400 280 380 220
Table 9. Number of products taken by wholesalers to each farmer using a certain vehicle in each time period
WHOLESALER VEHICLE
TO FARMER DAY 1 DAY 2 DAY 3 DAY 4 DAY 5 DAY 6 DAY 7
WHOLESALER 1 VEHICLE 1 200 190 185 270 235 300 225
VEHICLE 2 263 290 307 295 258 210 375
WHOLESALER 2 VEHICLE 1 0 189 130 145 192 115 185
VEHICLE 2 349 335 269 255 0 265 0
VEHICLE 3 0 0 0 0 280 0 35
The optimal decisions for the number of products harvested by each farmer in each time period are shown in Table 10.
Table 10. Number of products harvested by each farmer in each time period
FARMER DAY 1 DAY 2 DAY 3 DAY 4 DAY 5 DAY 6 DAY 7
FARMER 1 349 335 307 295 280 265 240
FARMER 2 0 0 130 110 90 70 65
FARMER 3 263 290 269 255 235 210 195
FARMER 4 0 189 0 145 205 195 185
FARMER 5 200 190 185 160 155 150 135
The optimal solution of the model supply chain network that has been developed for fresh agricultural products by taking into account the level of quality of the product can be used as a
recommendation for allocation decisions crops from each farmer to wholesaler and the distribution decision of products through distributors and retailers such that customers can obtain products with the level of product availability and good product quality with competitive price.
6. CONCLUSION
The optimal decision for the determination of the amount of products harvested by farmers and purchased by wholesalers as well as the number of products distributed through distributors to each retailer to take into account the decrease in the level of product quality over time can be obtained through supply chain network model for fresh agricultural products, that have been developed in this research. The optimization model has the objective of maximizing the total supply chain profits. The result of optimal decision could be used as a reference for policy makers related to the distribution system of fresh agricultural products in East Java, to ensure the availability of products, with superior product quality level and at a competitive price.
Further research can be done by developing the supply chain network for fresh agricultural products by taking into account the uncertainty in the number of crops at the farmers’level and the demand uncertainty at the retailers’ level. In addition, the development of stochastic optimization could be applied to obtain a powerful solution for the problem of the distribution systems of fresh agricultural products by taking into account those uncertainty factors.
ACKNOWLEDGMENT
This research was supported by the Indonesian Directorate General of Higher Education. Their support for the realization of this research is gratefully appreciated.
REFERENCES
Ahumada, O. & Villalobos, J. R. 2009. Application of planning models in the agri-food supply chain: A review. European journal of Operational research,196,1-20.
An, K. & Ouyang, Y. 2016. Robust grain supply chain design considering post-harvest loss and harvest timing equilibrium. Transportation Research Part E: Logistics and Transportation
Review,88,110-128.
Bititci, U., Turner, T., Mackay, D., Kearney, D., Parung, J. & Walters, D. 2007. Managing synergy in collaborative enterprises. Production Planning and Control,18,454-465.
Bititci, U. S., Martinez, V., Albores, P. & Parung, J. 2004. Creating and managing value in collaborative networks. International Journal of Physical Distribution & Logistics
Management,34,251-268.
Borodin, V., Bourtembourg, J., Hnaien, F. & Labadie, N. 2016. Handling uncertainty in agricultural supply chain management: a state of the art. European Journal of Operational
Research,254,348-359.
Parung, J. 2008. Peran Modal Intelektual dalam Kerjasama Bisnis untuk Penciptaan Nilai Rantai Pasok (Supply Chain Values). Journal of Technology Management.
Parung, J. 2013. Current issue and Future Trend: Food Supply Chain. Sanur Paradise Plaza Hotel Bali: 10th International Annual Symposium on Management.
Parung, J. & Bititci, U. S. 2006. A conceptual metric for managing collaborative networks.
Journal of Modelling in Management,1,116-136.
Yu, M. & Nagurney, A. 2013. Competitive food supply chain networks with application to fresh produce. European Journal of Operational Research,224,273-282.