NATIONAL RISK AND
VULNERABILITY ASSESSMENT
2011 - 2012
The National Risk and Vulnerability Assessment 2011-12 was implemented by the Central Statistics Organization (CSO) of the Government of the Islamic Republic of Afghanistan with technical assistance from ICON-Institute Public Sector Gmbh.
This publication has been produced with the assistance of the European Union. The contents of this publication is
the sole responsibility of CSO and ICON-Institute, and can in no way be taken as to relect the views of the European
Union.
For further information, please contact CSO
www.nrva.cso.gov.af
E-mail: [email protected]
ICON-Institute www.icon-institute.de
E-mail: [email protected] (Project Manager) or [email protected] (Chief Analyst/Editor)
Delegation of the European Union to Afghanistan
http://eeas.europa.eu/delegations/afghanistan/index_en.htm E-mail: [email protected]
Recommended citation:
Central Statistics Organization (2014), National Risk and Vulnerability Assessment 2011-12. Afghanistan Living Condition Survey. Kabul, CSO.
Designed by: Mohammad Ashraf Abdullah COPHEN ADVERTISING
FOREWORD
The National Risk and Vulnerability Assessment (NRVA), which is called Afghanistan Living Condition Survey (ALCS) by then is providing data about the country for almost 10 years. This publication is now the fourth release after the surveys of 2003, 2005 and 2007-08 by inancial supporting of European Commission.
This new round of the survey has brought some more innovations and more details compared to the previous surveys. The questionnaire is now designed in modules that will be ‘rotating’ from round to round to cover all the needs for data to capture the living conditions of the nation.
This survey is still the only nation-wide survey available in Afghanistan and is therefore of utmost importance for the country, its policy makers and all the Organization investing in the future of the country. It is also capturing seasonal variations to make it more accurate to the various realities that the population face throughout the year, especially in terms of labour, poverty and food security.
As the principal agency responsible for the production of national statistics, the Central Statistics Organization is proud to deliver key indicators and statistics at national and provincial level for a broad array of development sectors, including population, poverty, food security, labour market, agriculture, health, education and housing.
The life of the survey is still on-going as a new round has just been launched as we published this report and I hope to be able to address you again in about 18 months to present you with the latest changes in the living conditions of the people of Afghanistan.
I sincerely hope you will enjoy reading this publication, ind all the information you expect and use it fruitfully.
Associate Prof. Hasibullah Mowahed, Acting President General
ii
KEY INDICATORS
INDICATOR ANDS no. MDG no. Sub-groupsa National
Demography
Percentage of population under 15 U 42.0; R 50.1; K 53.0 48.4
Percentage of population 65 and over U 3.3; R 2.2; K 2.3 2.5
Sex ratio U 105; R 106; K 110 106
Dependency ratio U 83; R 110; K 124 104
Child dependency ratio U 77; R 105; K 119 99
Aged dependency ratio U 6; R 5; K 5 5
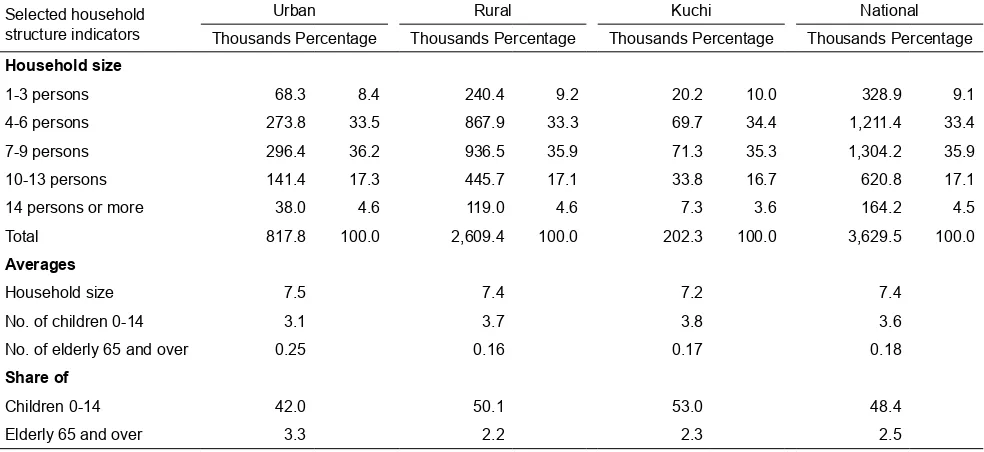
Average household size U 7.5; R 7.4; K 7.3 7.4
Percentage of women in polygamous marriage 7.6
Percentage of married women aged 15-19 whose husband is 10 or
more years older 7.9
Percentage of married women aged 20-24 whose husband is 10 or
more years older 10.6
Under-ive Mortality Rate 8.a 4.1 U 72; R 96M 89; F 92 91
Infant Mortality Rate 8.b 4.2 U (34); R (54)M (49); F (46) (48)
Labour force (national deinition)
Labour force participation rate U 43.1; R 51.3; K 64.4M 80.0; F 18.5 49.8
Employment-to-population ratio 1.5 U 39.2; R 47.1; K 61.0M 74.5; F 15.5 45.7
Percentage not-gainfully employed population U 17.6; R 26.9; K 28.7M 21.8; F 39.3 25.0
Under-employment rate U 8.6; R 18.7; K 23.3M 15.4; F 22.8 16.8
Unemployment rate U 9.0; R 8.2; K 5.4M 6.4; F 16.5 8.2
Youth unemployment rate 17.a U 13.6; R 9.9; K 4.4M 8.1; F 18.8 10.4
Youth unemployment as percentage of total unemployment U 46.3; R 37.4; K 24.9M 38.1; F 40.8 39.1
Proportion of own-account and contributing family workers in total
employment 1.7
M 79.3; F 87.0
U 59.3; R 85.6; K 95.7 80.5
Agriculture and livestock
Percentage of households owning irrigated land 37.9
Percentage of households owning rain-fed land 16.8
Percentage of households owning a garden plot 12.6
Mean size of owned irrigated land (in jeribsb) 6.0
Mean size of owned rain-fed land (in jeribsb) 16.4
Mean size of owned garden plot (in jeribsb) 2.0
Median size of owned irrigated land (in jeribsb) 3.0
Median size of owned rain-fed land (in jeribsb) 7.0
Median size of owned garden plot (in jeribsb) 1.0
Number of cattle (in thousands) 3,715
Number of goats (in thousands) 7,281
Number of sheep (in thousands) 8,772
Number of chickens (in thousands) 12,156
aUurban, R: rural, K: Kuchi, M: male, F: female bOne jerib is 0.2 hectare (2,000 m2)
( ) Indicators between brackets are considered less reliable and are indicative only.
INDICATOR ANDS no. MDG no. Sub-groupsa National
Poverty
Poverty headcount 1.a (alt) U 28.9; R 37.7; 53.8 36.5
Poverty gap 1.b 1.2 U 5.8; R 9.2; K 13.3 8.6
Squared poverty gap U 1.8; R 3.2; K 4.7 3.0
Gini Index U 29.2; R 28.1; K 22.3 31.6
Share of poorest quintile in national consumption 1.c 1.3 8.5
Food security
Percentage of population with calorie deiciency 2.b 1.9 U 34.4; R 29.1; K 25.6 30.1
Percentage of population with protein deiciency U 21.3; R 19.1; K 15.3 19.4
Percentage of population with calorie and protein deiciency U 20.3; R 18.2; K 14.5 18.5
Education
Adult literacy rate (15 years of age and over) U 53.5; R 25.0; K 7.2M 45.4; F 17.0 31.4
Youth literacy rate (15-24 years of age) 3.c 2.3 U 71.4; R 39.1; K 9.7M 61.9; F 32.1 47.0
Net attendance ratio in primary education 3.a 2.1 U 77.9; R 53.8; K 19.4M 64.4; F 48.3 56.8
Net attendance ratio in secondary education U 54.3; R 26.3; K ...M 42.0; F 23.2 32.7
Net attendance ratio in tertiary education U 13.1; R 2.4M 8.1; F 2.7 5.4
Gross attendance ratio in primary education 3.a (alt) U 99.1; R 68.7; K 24.9M 82.8; F 60.9 72.4
Gross attendance ratio in secondary education U 69.5; R 34.3; K 6.0M 55.3; F 29.0 42.3
Gross attendance ratio in tertiary education U 15.3; R 3.1M 9.1; F 3.8 6.5
Percentage of households within two kilometres distance from boys’
primary education facilities U 95.1; R 43.8; K 29.3 53.9
Percentage of households within two kilometres distance from girls’
primary education facilities U 96.5; R 36.4; K 26.8 48.1
Gender equality
Share of women in wage employment in the non-agricultural sector 3.2 11.1
Literacy gender parity index, age 15 and over U 0.55; R 0.27 0.37
Literacy gender parity index, age 15-24 4.d (10) U 0.73; R 0.40; K 0.09 0.52
Ratio of girls to boys in primary education 4.a 3.1 U 0.90; R 0.68; K 0.54 0.74
Ratio of girls to boys in secondary education 4.b 3.1 U 0.74; R 0.38 0.53
Ratio of girls to boys in tertiary education 4.c 3.1 U 0.65; R 0.17 0.42
Health
Percentage under-ives with vitamin-A supplementation U 75.8; R 56.4; K 50.5 59.8
Percentage under-ives with birth certiicate U 63.8; R 29.5; K 16.3 35.2
Women with at least two TT injections U 42.8; R 34.6; K 13.1 34.9
Antenatal care coverage (at least one visit) 9.d 5.5 U 78.4; R 46.3; K 23.2 51.2
Antenatal care coverage (at least four visits) 5.5 U 20.8; R 7.7; K 3.5 9.9
Percentage of births attended by skilled health personnel 9.b 5.2 U 75.5; R 32.6; K 13.4 39.9
iv KEY INDICATORS
INDICATOR ANDS no. MDG no. Sub-groupsa National
Housing
Percentage of households living in communities with distance to nearest drivable road of 2 or less kilometres
U 100.0; R 75.2;
K 60.4 80.0
Mean number of persons per room U 3.0; R 3.1; K 4.8 3.2
Percentage of households living in overcrowded dwellings U 33.6; R 35.5; K 69.9 37.0
Percentage of urban population living in slums 14.a (alt) 7.10 86.6
Percentage of population using improved drinking water sources 13.a 7.8 U 70.9; R 39.4; K 21.0 45.5
Percentage of population using an improved sanitation facility 13.b 7.9 U 29.1; R 2.4; K 0.0 8.3
Percentage of households with access to any source of electricity in the
last month U 95.0; R 63.8; K 30.3 69.1
Percentage of population using solid fuels 12.e (29) U 32.5; R 93.4; K 99.8 79.9
Mobile cellular subscriptions per 100 inhabitants 19.a 8.15 U 27.1; R 10.6; K 6.3 14.1
Foreword i
Key indicators ii
Table of contents v
List of tables viii
List of igures xi
List of text boxes xiii
Abbreviations xiv
Map of Afghanistan xv
Acknowledgements xvi
Executive summary xvii
1 Introduction 1
2 Survey methodology and operations 2
2.1 Introduction 2
2.2 Stakeholder involvement 2
2.3 Questionnaire design 2
2.4 Pilot training and pilot survey 3
2.5 Training and selection of ield staff 3
2.6 Sampling design and implementation 4
2.7 Field operations 5
2.8 Data processing 5
2.9 Comparability of results 6
2.10 Data limitations 7
2.11 Reporting 7
3 Population structure and change 8
3.1 Introduction 8
3.2 Population structure and distribution 9
3.3 Household composition and marriage patterns 11
3.3.1 Household structure 11
3.3.2 Marriage patterns 12
3.4 Childhood mortality 15
3.5 Migration 16
3.5.1 General migration 16
3.5.2 International migration 18
3.5.3 Internal migration 22
3.5.4 Seasonal migration 25
3.5.5 Displacement 26
4 Labour force characteristics 29
4.1 Introduction 29
4.2 Labour force participation 29
4.3 Labour force characteristics 31
4.3.1 Conceptualization of employment and unemployment 31
4.3.2 Employment, underemployment and unemployment 32
4.4 Characteristics of the employed population 34
4.4.1 Status in employment 34
4.4.2 Economic sector and occupation 35
vi TABLE OF CONTENTS
4.4.3 Working hours 36
5 Agriculture and livestock 38
5.1 Introduction 38
5.2 Farming and horticulture 39
5.2.1 Irrigated land 39
5.2.2 Rain-fed land 43
5.2.3 Horticulture 45
5.2.4 Farming input costs 46
5.4 Livestock 46
5.4.1 Livestock numbers 46
5.4.2 Sale of animals and animal products 48
5.4.3 Livestock production factors 48
6 Poverty incidence, trend and proiling 50
6.1 Introduction 50
6.2 Measuring trends in poverty 2007-2011 51
6.3 Growth and distribution 52
6.4 Poverty proile 53
6.4.1 Demographic proile 54
6.4.2 Household head characteristics 55
6.5 Conclusions 56
7 Food security 57
7.1 Introduction 57
7.2 Current food security 58
7.3 Distribution by region 59
7.4 Comparison of food security between NRVA 2011-12 and NRVA 2007-08 59
7.5 Characteristics of the food-insecure population 60
7.5.1 Characterization by main income source 60
7.5.2 Characterization by asset ownership 61
7.5.3 Characterization by demographics 61
7.6 Seasonality and food insecurity 62
7.6.1 Afghan calendar seasonal differences 62
7.6.2 Harvest and lean season’s differences 63
7.7 Food access and supply 64
7.6.1 Availability of different food items by food security status 64
7.7.2 Availability of different food items by residence 65
7.7.3 Sources of food items by population group and food security status 65
7.7.4 Sources of food items by main income source 66
7.7.5 Sources of food items by season 66
7.8 Food consumption 66
7.8.1 Dietary diversity 66
7.8.2 Food Consumption Score 67
7.8.3 Contribution of different food groups to caloric intake 68
7.9 Coping with shocks 68
8 Education 70
8.1 Introduction 70
8.2.1 Educational attendance in residential and gender perspective 71
8.2.2 Change in educational attendance 73
8.2.3 Reasons for not attending 74
8.3 Educational attainment 76
8.4 Literacy 78
8.4.1 Literacy in residential and gender perspective 78
8.4.2 Change in literacy levels 81
9 Health 83
9.1 Introduction 83
9.2 Access to health services 83
9.2.1 Distance to nearest health facility and costs to reach it 83
9.2.2 Household expenditure on health 85
9.2.3 Visits to health care facilities 87
9.2.4 Use of health care providers 89
9.3 Child health 89
9.3.1 Birth registration 89
9.3.2 Child health indicators 90
9.4 Maternal health 91
9.4.1 Ante-natal care 91
9.4.2 Skilled attendance at birth and place of delivery 92
10 Housing and household amenities 95
10.1 Introduction 95
10.2 Tenancy and dwelling characteristics 95
10.2.1 Tenancy 95
10.2.2 Dwelling characteristics 96
10.3 Household amenities 98
10.3.1 Water and sanitation 98
10.3.2 Other household amenities 101
11 Challenges and strategies 105
11.1 Introduction 105
11.2 Indebted households 105
11.3 Household shocks and coping strategies 107
11.3.1 Household shocks 107
11.3.2 Coping strategies 109
11.4 Community development priorities 111
References 113
Annexes 115
I Persons involved in NRVA 2011-12 115
II Subjects covered in NRVA 2007-08 to 2015-16 116
III NRVA 2011-12 questionnaires 117
IV Sample design and implementation 165
V Population by age and sex 169
VI Mortality estimation 170
VII Updating the poverty line using NRVA 2011-12 173
VIII Food security analysis methodology 178
IX Quality assurance and quality assessment 182
X Tables at province level 190
viii LIST OF TABLES
LIST OF TABLES
Table 2.1 NRVA 2011-12 household questionnaire modules 3
Table 2.2 NRVA 2011-12 Shura questionnaire modules 3
Table 3.1 Population, by residence, sex, and by age 10
Table 3.2 Households, by residence, and by selected household structure indicators 11
Table 3.3 Households and population, by household characteristics (in percentages) 12
Table 3.4 Population, by marital status, and by sex, age (in percentages) 13
Table 3.5 Childhood mortality indicators, by (a) residence and (b) sex 16
Table 3.6 Percentage of population living outside the district of current residence (a) at birth and (b) in October 2004, by previous place of residence, sex, and by current residence
17
Table 3.7 Immigrants (a) born abroad and (b) living abroad in October 2004, by current residence, and by country of origin (in percentages)
18
Table 3.8 Emigrants 14 years and over who emigrated in the year before the survey, by previous residence, and by country of destination (a) at birth and (b) in October 2004 (in percentages)
19
Table 3.9 In-migrants (a) born elsewhere in Afghanistan and (b) living elsewhere in Afghanistan in October 2004, by current residence, and by area of origin (in percentages)
23
Table 3.10 In-migrants (a) born elsewhere in Afghanistan and (b) living elsewhere in Afghanistan in October 2004, by current residence, and by residence of origin (in thousands)
23
Table 3.11 Percentage of population 14 years and over migrating for seasonal work in the year before the survey, by sex and by usual residence
26
Table 3.12 Households returned from displacement since 2002, by country of displacement, and by mode of return (in percentages)
28
Table 4.1 Labour force, by activity status, and by residence, sex (in thousands) 32
Table 4.2 Selected labour force indicators, by residence, sex (in percentages) 32
Table 4.3 Employed population, by residence, sex, and by status in employment (in percentages) 35
Table 5.1 Households, by ownership of irrigated land, irrigated land size (in percentages); also stating mean and median irrigated land size (in jeribs)
39
Table 5.2 Crop production from irrigated land in spring cultivation season prior to the survey 42
Table 5.3 Households, by ownership of fed land, fed land size (in percentages); also stating mean and median rain-fed land size (in jeribs)
44
Table 5.4 Crop production from rain-fed land in spring cultivation season prior to the survey 44
Table 5.5 Households, by access to garden plots, garden plot size (in percentages); also stating mean and median garden plot size (in jeribs)
45
Table 5.6 Crop production from garden plots in spring cultivation season prior to the survey 45
Table 5.7 Livestock numbers in Livestock Census 2002-02a and NRVA 2011-12, by animal type (in thousands); also stating
households with speciied animal type in NRVA 2011-12 (in thousands) 47
Table 5.8 Number of livestock and animal products sold in the year prior to the NRVA 2011-12 survey, by animal type (in thousands) and type of product (in thousands)
48
Table 5.9 Livestock owners that had vaccinated at least part of their livestock, by type of livestock owned (in percentages) 48
Table 6.1 Trends of poverty measures, by survey year 51
Table 6.2 Mean real per capita consumption (at 2011-12 prices), by poverty quintile 53
Table 6.3 Poverty headcount, by child dependency ratio (household level) 54
Table 6.4 Poverty headcount, poor- and total population shares, by selected characteristics of household head (in percentages)
55
Table 6.5 Poverty headcount, poor- and total population shares, by labor market characteristics of household head (in percentages)
56
Table 7.1 Levels of food security 57
Table 7.2 Population with types of food deiciency, by residence 58
Table 7.3 Food-insecure population, by food-security status, and by region 59
Table 7.4 Households, by livelihood group, asset holding and food insecurity (in percentages) 61
Table 7.5 Percentage of food-insecure households, by residence, and by selected household characteristics 62
Table 7.7 Average quantity of foods available for consumption, by food security status, for selected food commodities (in grams per person per day)
65
Table 7.8 Average number of days of food consumption per week, by residence, and by selected food 67
Table 7.9 Households applying coping strategies, by residence, and by use of selected coping strategies (in percentages) 69
Table 8.1 Net and gross attendance ratio, by residence, and by education level, sex; Gender parity index, by residence, and by educational level; GAR/NAR ratio, by educational level
72
Table 8.2 Population 6-24 years not attending school, by school age, sex, and by residence, reason for not attending (in percentages)
75
Table 8.3 Population 25 years over, by sex, and by educational attainment 77
Table 8.4 Adult literacy rate, by residence, and by sex; Gender equity indicators, by residence 78
Table 8.5 Youth literacy rate, by residence, and by sex; Gender equity indicators, by residence 79
Table 9.1 Access characteristics of the nearest health facility for different health facilities, by residence 84
Table 9.2 Availability of health care staff in nearest health facility, by sex of staff, residence, and by health care provider, staff type (in percentages)
85
Table 9.3 Mean and median household health-related expenditure for A. Households with speciied expenditure and B. all households, by expenditure type, residence (in Afghanis)
86
Table 9.4 In-patients (A) and out-patients (B) in the year before the survey, by sex, and by age 87
Table 9.5 Health care seekers in the year before the survey, by residence, and by health care provider 89
Table 9.6 Children under ive years of age, by residence, and by different indicators (in percentages) 90 Table 10.1 Households, by residence, and by construction material for (a) walls, (b) roofs and (c) loors (in percentages) 97 Table 10.2 Households, by residence, and by number of rooms in the dwelling (in percentages); also stating occupancy
density indicators
98
Table 10.3 Households, by location of cooking facility, and by residence (in percentages) 98
Table 10.4 Percentage of households with access to improved sources of drinking water, by residence; Time to reach drinking water source (all water sources), by residence
99
Table 10.5 Population, by use of improved sanitation, access privacy, and by residence (in percentages) 101
Table 10.6 Population using solid fuels for (a) cooking and (b) heating in winter, by residence (in percentages) 103
Table 11.1 Households, by debt status, debt amount (in percentages); also stating debt means (in Afs.) 106
x ANNEX TABLES
ANNEX TABLES
Table IV.1 Districts excluded from sample frame for the reserve sample 166
Table IV.2 Interviewed households, by year, and by season (Shamsi calendar) 167
Table V.1 Population, by residence, sex, and by ive-year age groups (in thousands) 169 Table VI.1 Sex ratio of children ever born and children dead, by age group of the mother 171
Table VI.2 Estimation of probability of dying and associated reference date, by sex 172
Table VII.1 Median of reported and predicted housing value, by residential dwelling type (in Afghanis) 175
Table VII.2 Consumption aggregate, by consumption-aggregate component, survey year, and by
wealth quintile (in percentages) 176
Table VII.3 NRVA 2007-08 basic needs basket, by main food category (in kg. per person per day) 176
Table VII.4 NRVA 2011-12 poverty indicators 177
Table VIII.1 Seasonal crop calendar, by region, province 180
Table IX.1 Quality assurance dimensions and measures in NRVA 2011-12 183
Table IX.2 Sampling errors and conidence intervals for selected indicators 186
Table IX.3 Percentage missing values for selected variables 189
Table X.1 Population, by sex, and by province, age groups (in thousands) 190
Table X.2 Population, by sex, marital status, and by province (in thousands) 196
Table X.3 Population, by immigrant status, and by province (in thousands) 197
Table X.4 Working-age population, by labour force indicators 198
Table X.5 Employed population, by status in employment, and by province (in thousands) 199
Table X.6 Households, by ownership of different types of agricultural land (in thousands) 200
Table X.7 Mean and median size of owned land, for different types of land, by province (in jeribs) 201
Table X.8 Households, by distance to nearest primary education facility for boys and girls, and by province (in thousands) 202
Table X.9 Households, by distance to nearest lower secondary education facility for boys and girls, and by province (in thousands) 203
Table X.10 Literacy rate of population aged 15 years older, by sex, and by province 204
Table X.11 Net and Gross Primary Attendance Ratios, by sex, and by province 205
Table X.12 Net and Gross Secondary Attendance Ratios, by sex, and by province 206
LIST OF FIGURES
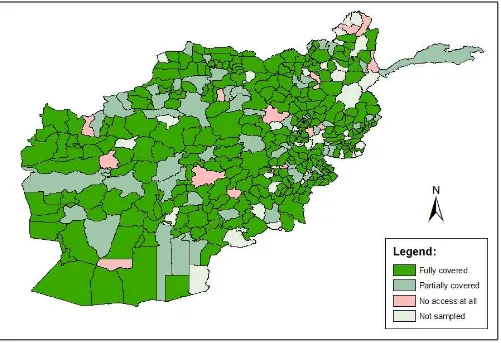
Figure 2.1 Implementation of NRVA 2011-12 sampling clusters, by district 6
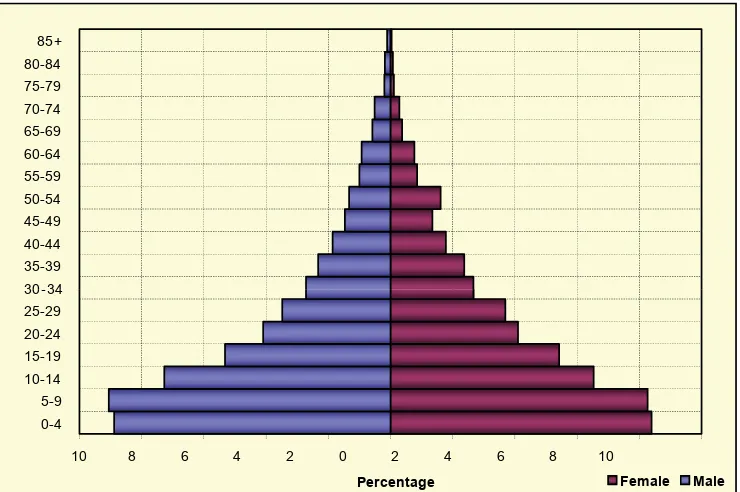
Figure 3.1 Population, by age and sex (in percentages) 9
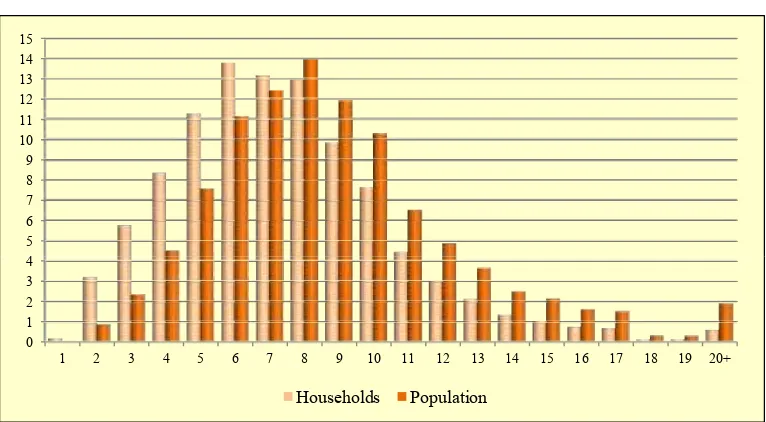
Figure 3.2 Households and population, by household size (in percentages) 12
Figure 3.3 Male and female population, by age, and by marital status (in percentages) 14
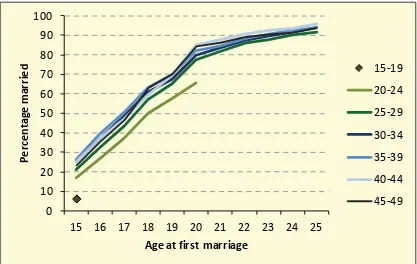
Figure 3.4 Females age 15 to 49, by current age group, and by age at irst marriage (in percentages) 14 Figure 3.5 Ever-married females, by current age, and by relative age of husband (in percentages) 15
Figure 3.6 Childhood mortality indicators, by survey 16
Figure 3.7 International migrants, by migrant type, and by age (in percentages) 20
Figure 3.8 Immigrants living abroad in October 2004, by main reason for immigration, and by country of residence in 2004 (in percentages) 21
Figure 3.9 Emigrants 14 years of age and older leaving in the past year, by main reason for emigration, and by country of destination (in percentages)
21
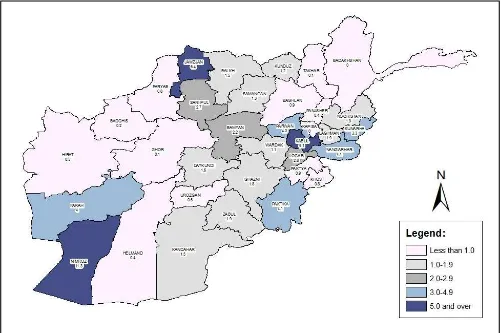
Figure 3.10 Annual immigration ratio since October 2004, by province 22
Figure 3.11 Life-time and recent in-migrants, by age (in percentages) 24
Figure 3.12 Recent in-migrants, by age, and by reason for in-migration (in percentages) 25
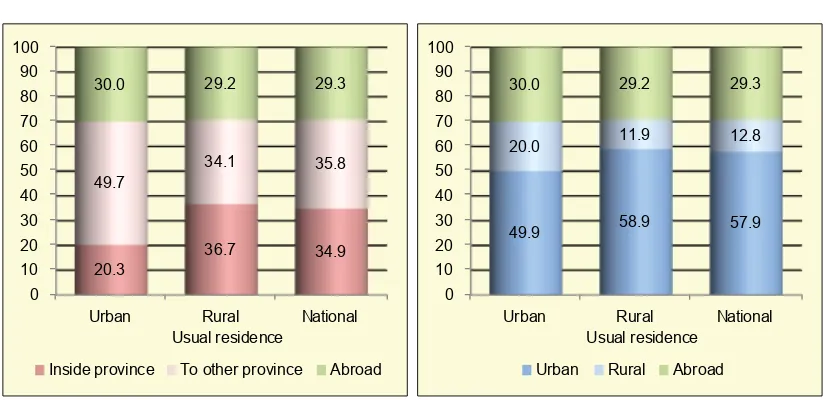
Figure 3.13 Percentage of population 14 years and over migrating for seasonal work in the year before the survey, usual residence, and by (a) provincial destination and (b) urban-rural destination
26
Figure 3.14 Households returned from displacement since 2002, by year of return, and by country of refuge (in percentages) 27
Figure 4.1 Labour force participation rate, by residence, and by sex 30
Figure 4.2 Labour force participation rate, by sex, and by age 31
Figure 4.3 Labour force not gainfully employed, by (a) residence and (b) sex, and by underemployment and unemployment (in percentages)
33
Figure 4.4 Percentage of the labour force not gainfully employed, by season, and by residence 34
Figure 4.5 Employed population 14 years and over, by sector of employment, and by sex (in percentages) 36
Figure 4.6 Working population, by sex, and by weekly working hours (in percentages) 37
Figure 5.1 Percentage of households owning irrigated farm land, by province 40
Figure 5.2 Percentage of irrigated land not cultivated, by district 41
Figure 5.3 Main source of water for irrigated land (in percentages) 42
Figure 5.4 Percentage of households owning rain-fed farm land, by province 43
Figure 5.5 National annual farming input costs, by type of production input (in million Afs.) 46
Figure 5.6 Percentage of households owning any cattle, by province 47
Figure 5.7 Main type of veterinary service provider and main reason not to use veterinary services 49
Figure 6.1 Trend of poverty headcount, by residence and region (in percentages) 52
Figure 6.2 Trend of Gini coeficient, by residence and region 53
Figure 6.3 Total population and poor population, by age (in percentages) 54
Figure 7.1 Population, by level of food security, and by residence, survey year (in percentages) 60
Figure 7.2 Population, by level of food security, and by residence, season (in percentages) 63
Figure 7.3 Households, by source of wheat lour, and by residence, food security status (in percentages) 66 Figure 7.4 Households, by Kcal intake, and by residence, Food Consumption Score (in percentages) 68
Figure 8.1 Education attendance rate, by sex, and by age 72
Figure 8.2 Net attendance ratio, by sex, and by survey for (a) primary education and (b) secondary education 73
Figure 8.3 Net attendance ratio, by educational level, and by season 74
Figure 8.4 Households within two kilometres distance from primary education facilities, by sex of student population, and by residence (in percentages)
76
Figure 8.5 Population 15 years and over, by educational attainment, and by age, for (a) males and (b) females 78
Figure 8.6 Adult literacy rate, by province, for (a) males and (b) females 80
xii LIST OF FIGURES
Figure 8.8 Literacy rate, by sex, and by age; Gender equity, by age 82
Figure 9.1 In-patients (A) and out-patients (B) in the year before the survey, by sex, and by age as percentage of the total population in the same age-sex group
88
Figure 9.2 Women age 15-49 with a live birth in the ive years preceding the survey, by residence, and by the number of TT injections received during the last pregnancy (in percentages)
91
Figure 9.3 Women with a live birth in the ive years preceding the survey who received maternal health care during their last pregnancy, by selected characteristics (in percentages)
92
Figure 9.4 Percentage of women with a live birth in the ive years preceding the survey who were assisted by skilled birth attendants at last delivery, by provincelast pregnancy, by selected characteristics (in percentages)
93
Figure 9.5 Percentage of women with a live birth in the ive years preceding the survey who received maternal health care during their last pregnancy and who delivered in institutional facilities, by survey (in percentages)
94
Figure 10.1 Households, by tenancy status, and by residence (in percentages) 96
Figure 10.2 Percentage of households with access to safe drinking water, by province 100
Figure 10.3 Households, by distance to the nearest drivable road to the community, and by residence (in percentages) 101
Figure 10.4 Households, by change in condition of the access road to the community, and by residence (in percentages) 102
Figure 10.5 Households, by source of electricity, and by survey year (in percentages) 103
Figure 11.1 Households, by assessment of their economic situation compared to one year before, and by residence 106
Figure 11.2 Percentage of households experiencing a drinking water shock in the year before the survey, by province 109
Figure 11.3 Percentage of households applying coping strategies, by residence 110
Figure 11.4 Households, by irst community development priority for (a) male Shuras and (b) female Shuras, and by residence (in percentages)
112
ANNEX FIGURES
Figure VII.1 Total food consumption aggregate, by food group, and by survey year (in percentages) 174
LIST OF TEXT BOXES
Quality of age reporting 9
Infant- and Under-ive Mortality Rate 15
MDG Indicators 4.1 and 4.2 – Under-ive Mortality Rate and Infant Mortality Rate 16
Migration concepts 17
Labour force deinitions 31
MDG Indicator 1.5 – Employment-to-population ratio 32
Labour indicators based on ILO deinitions 34
MDG Indicator 1.7 – Proportion of own-account and contributing family workers in total employment 34
MDG Indicator 3.2 – Share of women in wage employment in the non-agricultural sector 36
MDG Indicator 1.2 – Poverty gap ratio 51
MDG Indicator 1.3 – Share of poorest quintile in national consumption 52
MDG Indicator 1.9 – Percentage of population below minimum level of dietary energy consumption 58
MDG Indicator 2.1 – Net attendance in primary education, both sexes 71
MDG Indicator 3.1 – Ratio of girls to boys in primary, secondary and tertiary education 73
MDG Indicator 2.3 – Literacy rates of 15-24 years old 79
Access to health care 84
Availability of health care staff 85
MDG Indicator 5.5 – Antenatal care coverage 92
MDG Indicator 5.2 – Proportion of births attended by skilled health personnel 92
MDG Indicator 7.10 – Percentage of urban population living in slums 97
MDG Indicator 7.8 – Proportion of the population using improved drinking water sources 99
MDG Indicator 7.9 – Proportion of population using an improved sanitation facility 100
MDG Indicator 8.15 – Mobile cellular subscriptions per 100 inhabitants 104
MDG Indicator 8.16 – Internet users per 100 population 104
xiv ABBREVIATIONS
ABBREVIATIONS
ADB - Asian Development Bank
AHS - Afghanistan Health Survey
ANC - Ante-Natal Care
ANDS - Afghanistan National Development Strategy ANSP - Afghanistan National Statistical Plan
ARI - Acute Respiratory Illness
BPHS - Basic Package of Health Services
CA - Consumption Aggregate
CBN - Cost of Basic Needs
CDC - Community Development Council
CI - Conidence Interval
CSO - Central Statistics Organization
DfID - UK Department for International Development
DPS - District Price Survey
EA - Enumeration Area
FAO - Food and Agriculture Organization
FCS - Food Consumption Score
GAR - Gross Attendance Ratio
GDP - Gross Domestic Product
GIZ - German Gesellschaft für Internationale Zusammenarbeit
GoA - Government of Afghanistan
ICSE - International Classiication of Status in Employment ILO - International Labour Organization
IMR - Infant Mortality Rate
ISCED - International Standard Classiication of Education
Kcal - Kilocalorie
MAIL - Ministry of Agriculture, Irrigation and Livestock
MDG - Millennium Development Goal
MICS - Multiple Indicator Cluster Survey
MMR - Maternal Mortality Ratio
MoE - Ministry of Education
MoEc - Ministry of Economy
MoF - Ministry of Finance
MoEW - Ministry of Energy and Water
MoLSAMD - Ministry of Labour, Social Affairs, Martyrs and Disabled MoUA - Ministry of Urban Affairs
MoWA - Ministry of Women Affairs
NAR - Net Attendance Rate
NMAK - National Multi-sectoral Assessment of Kuchi MRRD - Ministry of Rural Rehabilitation and Development MoUD - Ministry of Urban Development
NRVA - National Risk and Vulnerability Assessment
NSP - National Solidarity Programme
PPS - Probability Proportional to Size PSO - Provincial Statistical Oficer
PSU - Primary Sampling Unit
REFSA - Rapid Emergency Food Security Assessment
RSO - Regional Statistical Oficer
SBA - Skilled Birth Attendance
SC - Steering Committee
TBA - Traditional Birth Attendants
TFR - Total Fertility Rate
TAC - Technical Advisory Committee
U5MR - Under-ive Mortality Rate
UNDP - United Nations Development Programme UNECE - United Nations Economic Commission for Europe UNFPA - United Nations Fund for Population Activities UNICEF - United Nations Children’s Fund
UNU - Ultimate Sampling Unit
TT - Tetanus Toxoid
WB - World Bank
xvi ACKNOWLEDGEMENTS
ACKNOWLEDGEMENTS
The National Risk and Vulnerability Assessment report has been through a long way to be reach the hands of the readers. It has been a very ambitious project in its objective and I am delighted to be able to present the result of this hard work to you dear reader.
As for all the project and publication of this scope, the list of persons who have contributed and made this publication a reality is very long and I will probably forget some persons. I pray that they will forgive me.
First of all, I would like to pay tribute to the memory of H.E. Abdul Rahman Ghafoori, President General of the Central Statistical Organization, who sadly left us before this publication could be released. He has always been a huge supporter to the NRVA and never spared his time and efforts to provide guidance, vision and support to the staff and experts working on the project. He will be dearly missed.
I would then like to thank the European Union Delegation to Afghanistan and in particular Mr. Giacomo Miserocchi, Attaché Rural Development, Mr. Wali Mohammed Farhodi, Programme Manager - Rural Development for their endless support in implementing this project as well as Mr. Kristian Orsini, Acting Head of Operation for his commitment. The EU Delegation is our main donor in this project and this publication would never have been published without their commitment.
I would also like to make a special mention to the United Nations World Food Programme for their on-going support to the NRVA. Their help was greatly appreciated, as well as its input in training and in a wide range of survey issues. In this respect, the role of Mr. Amanullah Assil, Programme Oficer VAM, has been invaluable. I would like to thank Mr. Amanullah Assil in particular, as well as Mrs. ThiVan Hoang and Mr. William Afif for their assistance and commitment throughout the survey.
Several other international organization were involved and provided assistance to the survey. I would like to thank Ms. Silvia Redaelli, Economist, and Mr. Dean Joliffe, chair of the Technical Advisory Committee, from the World Bank for their contribution to the TAC and their contribution to the Poverty chapter. I am also grateful to UNICEF and especially Mrs. Siping Wang, ILO, and more speciically Mr. Herve Berger.
A special partner for CSO in the last year has been the Senior Adviser of the UNDP Capacity Development Project, Dr. Mishra.
This also enables me to thank to other major contributors to the Steering Committee, namely Mr. Esmatullah Ramzi, adviser for CSO to the President and Prof. Hasibullah Mowahed, Deputy President General, and now Acting President General of CSO for the valuable technical input during the Steering Committee meetings as well as their knowledge of the country and its people.
This survey has beneited for a large support from the international community but could also count on the continuous commitment of the Technical Assistance experts from ICON INSTITUTE Public Sector and especially from the Team Leader Mr. Jan Bartlema who has showed a great patience in managing the team. Another person whose invaluable commitment must be acknowledged is Mr. Bart de Bruijn, the Chief Editor of this report. His assistance and work throughout the years has been a great asset to the ofice and he has performed an unbelievable work in assisting CSO in the production of this report. I also would like to thank the project managers from ICON who have never spared their efforts to make this project a success, irst of them is Mrs. Inga Korte who has initiated the project and Mr. Christophe Dietrich who has taken over from her in the later stage.
Of course, I would also like to thank the staff of CSO for the work they have done in conducting the survey and in particular Mr. Esmatullah Hakimi, Mr. Ahmad Khalid Amarkhel, Mr. Muneer Jamshid, Mr. Tamim Ahmad Shakeb from the NRVA Team, Mr. Whaheed Ibrahimi from the Database section, Mr. Zubair from the data entry section and Mrs. Shakeeba from the GIS section.
I would like to address a special thank to all the contributors to the report, Silvia Redaelli (WB), Mr. Elliot Vhurumuku and Mr. Amanullah Assil (WFP), Ahmad Khalid Amarkhel (CSO) and Bart de Bruijn (ICON).
Finally, I would like to thank the ield staff and the respondents to the survey without whom the survey would not have been possible, and of course, I would like to thank you, the readers for getting interest for the living conditions of the people of Afghanistan and the work of the Statistical organization.
Mohamed Sami Nabi
EXECUTIVE SUMMARY
The 2011-12 National Risk and Vulnerability Assessment (NRVA) is a survey, which provides national and international stakeholders with information that is required for monitoring development progress and formulate development policies and programmes. The survey was conducted by the Central Statistics Organization (CSO) of the Islamic Republic of Afghanistan and provides results that are representative at national and provincial level. It covered 20,828 households and 159,224 persons across the country, and is unique in the sense that it also includes the nomadic Kuchi population of Afghanistan. Building on previous survey rounds in 2003, 2005 and 2007-08, it has grown into Afghanistan’s most comprehensive source of statistical information. The survey covers a wide range of development themes and indicators, which were agreed upon by government departments, donors and international Organizations.
The picture that emerges from the NRVA 2011-12 is one of signiicant improvements in various areas of development, especially in education, health and access to safe drinking water. In other areas – such as food security and poverty – results indicate stagnation or even deterioration. Despite observed improvements in many areas, the living conditions of Afghanistan’s population as measured by any development indicator are among the worst in the world. Moreover, the national igures conceal dramatic differences within the population. With only very few exceptions, the situation in urban areas is much better than that in rural areas and among the Kuchi population. And invariantly, gender-speciic indicators show that men and boys are far less disadvantaged than women and girls.
The remainder of this summary recapitulates the main indings of the thematic chapters of this report. An in-depth analysis of the interaction between development indicators – and more speciically the apparent nexus between poverty, food insecurity, poor labour market performance, low levels of education, high fertility and mortality, and limited access to services – is beyond the scope of this report and will require additional efforts.
Population
The population share of children under 15 of 48 percent is among the highest in the world. Afghanistan’s very young age structure produces a situation in which a relatively small number of persons in the economically most productive age group 15-64 has to provide for a very large number of people in the dependent ages below 15. This implies a heavy burden for the working population, especially given the poor labour market opportunities in Afghanistan. The fact that the labour market to a large extent excludes women further aggravates this burden for the working population. The high fertility level underlying the young population composition also implies high risks for maternal and child mortality, especially in view of the poor access to health services in the country. In addition, the ever-increasing numbers of children and young adults exceed the absorption capacity of the education system and the labour market.
The Under-ive Mortality Rate (U5MR) of 91 deaths per thousand live births conirms a robust downward trend in the percentage of children dying before reaching age 5. It suggests that in the four years since NRVA 2007-08 (with an U5MR of 161) out of one thousand newborn children 70 more survive to age 5.
Besides fertility and mortality, migration is a very important component in population change in Afghanistan. The migration context of the country is particularly complex and is, among others, related to job opportunities, security, (nomadic) lifestyle, gender roles and policies toward Afghans in neighbouring countries. This results in an intricate interaction of gender, age, distance and reasons for migration. Around 16 percent of the population in Afghanistan is born in a district that is different from the district of current residence; 6 percent is born in another province and 3 percent in another country. The corresponding percentages of the urban population born elsewhere are signiicantly higher, respectively 36, 18 and 4 percent. Kabul is the biggest magnet of attraction by far, and for both internal and international migrants: out of 4.2 million inhabitants, some 360 thousand people were born abroad and 1.9 million elsewhere in Afghanistan. Immigration is dominated by persons arriving from Pakistan (67 percent) and Iran (32 percent). For emigrants Iran is by far the most important destination (76 percent), with smaller numbers going to Pakistan (13 percent) and the Gulf states (8 percent) alongside other countries.
Labour force characteristics
Two factors dominate the Organization of Afghanistan’s labour market: the importance of the agricultural sector – farming and livestock – and the underrepresentation of women. Afghanistan’s labour force – all persons in the working age of 14 and over who are currently active by being either employed or unemployed – shows a large gender disparity. Out of the labour force of 7.2 million persons, only 1.3 million are women. These numbers underlie the vastly different labour force participation rates for men and women – 80 and 19 percent respectively – and indicate the dificulty for women to economically add to the position of their households, as well as to the economy at large. The share of women in wage employment in the non-agricultural sector – the labour force MDG indicator for gender equality – is only 11 percent. The inding that high participation rates are found for boys 14 and over, as well as for elderly men 65 and over, indicate the dire need for many to contribute to the household income.
In the context of Afghanistan – characterized by low-paid, low-productivity employment and the absence of pensions and unemployment insurance – international deinitions of employment and unemployment are largely irrelevant as indicators of labour market performance. Therefore, the country has adopted national deinitions that are better attuned to the Afghanistan reality. In this national conceptualisation, the labour-market indicator that is considered to have most policy relevance is the percentage of the labour force that is not gainfully employed. This not-gainfully employed population includes the category of underemployed – persons who need more or other employment in order to provide for suficient and sustainable income or livelihood – besides the unemployed.
The share of the labour force that belongs to the not-gainfully employed is 25 percent, indicating that the labour market is short of 1.8 million jobs to provide people with an adequate living. Some 17 percent of these are considered underemployed and the remaining 8 percent are unemployed. The igures for the not-gainfully employed differ sharply by residence: whereas 18 percent of the urban labour force cannot ind adequate work, the igure is as high as 29 percent for the rural labour force. The corresponding igures for men and women are, respectively 22 and 39 percent, indicating that almost two in ive women who want to work cannot ind adequate employment. The share of not-gainfully employed youth aged 15-24 (26 percent) is similar to the share of the total labour force, but the component of youth unemployment is somewhat higher (10 against 8 percent).
The share of the working population that is in vulnerable employment – own-account workers, day labourers and unpaid family workers – is 81 percent, 79 percent for men and 87 for women. The sector that absorbed the largest share of the employed (40 percent) is agriculture. Compared to men, female work is much more concentrated in just a few sectors, particularly in livestock tending and food processing. Also in terms of working hours large gender differences are observed: on average men work 45 hours a week and women 30.
Agriculture and livestock
Farming – and more particularly farming irrigated land – is the economic backbone of Afghan society: some 40 percent of the labour force is engaged in farming. Around 38 percent of all households own any irrigated farm land and the corresponding igures for households owning rain-fed land and garden plots are, respectively, 17 and 13 percent.
Households owning irrigated land on average own 6 jeribs, with more than half (57 percent) owning an area of 3 jeribs or less. Those owning rain-fed land on average own 16 jeribs, with around half (51 percent) owning 7 jeribs or less. Cereals – especially wheat, the principal staple food in Afghanistan – are the main farm produce from both farmland types. Around 80 percent of wheat is produced on irrigated land. NRVA results suggest a spring cultivation production of 2.4 million tonnes of wheat in 2011 and 2.8 million tonnes in 2012, which would indicate a serious shortfall of the wheat requirements of around 5 million tonnes. Garden plots are on average 2.0 jeribs and for 53 percent of plot-owning households one jerib or less. They represent an important supplementation of households’ diet and income, as they provide high-value and nutrition-rich produce, in particular fruits and nuts.
Among the main challenges for a productive agricultural sector are water shortage and infertility of farmland. Some 20 percent of the estimated 17 thousand km2 of irrigated farmland is left fallow, primarily because of lack of water (71 percent) and land infertility (21 percent). For rain-fed land (18 thousand km2) the share that is not cultivated is even 37 percent, mainly because of lack of rain (53 percent) and land infertility (18 percent).
The national stock of cattle seems to have dropped since the Livestock census of 2002-03. The NRVA 2011-12 estimates the number at 2.9 million, compared to 3.7 million at the time of the census. On the other hand, the herds of
small ruminants show signiicant increases. The number of sheep and goats are estimated at, respectively, 10 and 18 million, compared to 7 and 9 million in the census. The share of households that own one or more cattle, goats, sheep and chickens is, respectively, 39, 29, 31 and 44 percent. Besides providing households with a range of dairy and animal products, market sales of animals or livestock products are an important income source for these households.
With regard to livestock production factors, NRVA 2011-12 shows a relatively good vaccination coverage (between 72 and 91 percent for different types of livestock), but relatively low access to feed concentrate (53 percent). Livestock owners signiicantly (67 percent) rely on private service providers for veterinary services.
Poverty incidence, trend and proiling
NRVA 2011-12 indicates that 36.5 percent of the Afghan population has a consumption pattern that is below the poverty line. The indicators that measure the depth and severity of poverty (the poverty gap and the squared poverty gap) have values of 8.6 and 3.0, respectively. These igures imply that at national level no poverty change is observed in Afghanistan since the NRVA 2007-08, although at regional level some changes are evident. The stable poverty igures also imply that, due to rapid population growth, in terms of absolute numbers the volume of poor people has increased.
Survey results also show that inequality over time has grown, with consumption of the richer quintile growing much faster than that of the poorest two quintiles. Consequently, the Gini Index increased from 29.7 to 31.6 between the latest two NRVA surveys and the share of the poorest quintile in national consumption declined from 9.1 to 8.5 percent.
The national poverty igures hide signiicant differentiation across regions and residence. Thus – and similar to 2007-08 – the urban poverty headcount is 28.9 percent, compared to 37.7 percent for rural residents and 53.8 percent for the Kuchi population. Similarly, a large gap exists between the region with the lowest share of population living under the poverty line (Southwest, 28.0 percent) and that with the highest (Northeast, 50.9 percent).
Correlates of poverty include household size and the dependency ratio, an indication that high fertility is positively associated with poverty. The NRVA also suggests that literacy and education of the household head are inversely related to poverty and that households headed by women are worse off than male-headed households. It furthermore suggests that underemployment is even more important than unemployment to make households vulnerable to poverty, thereby conirming the need to focus in labour market policy on not-gainfully employment instead of only unemployment.
Food security
NRVA 2011-12 analysis indicates that around 30.1 percent of Afghanistan’s population – 7.6 million people – had a calorie intake that is insuficient to sustain a healthy and active life. This igure implies thatfood insecurity has slightly worsened compared to the NRVA 2007-08 when the food-insecure represented 28.2 percent. Out of the total number of the food-insecure, 2.2 million (8.5 percent) are very severely food-insecure and 2.4 million (9.5 percent) severely food-insecure. In addition, 19.4 percent of the population – 4.9 million people – have insuficient protein consumption, a deiciency that particularly affects the nutrition of children under ive.
Food-security varies by residence, household characteristics, season and geographical region. Some 34.4 percent of the urban population is food-insecure, compared to 29.1 percent of the rural population and 25.6 percent of the Kuchi population. However, in terms of absolute numbers there are more food-insecure people in rural areas (5.2 million, excluding the 5 percent Kuchi population). Households with larger household size, higher ages of the household head and with a widowed or divorced household head are more likely to be food insecure. Relatively many more food-insecure people live in the North-eastern, Central and Central Highlands regions.
In a largely agricultural society like Afghanistan the annual cultivation cycle produces signiicant variation in food security across seasons. Although locally harvest and lean seasons vary considerably due to the geographic diversity of the country, a clear pattern is observed in the sense that winter and spring time tend to be dire seasons and food security increases in summer and autumn. The variation across seasons in urban areas is less pronounced because here more households rely on market purchases rather than own production of food.
Education
All education-related indicators for Afghanistan – including gender equality indicators – show improvement since NRVA 2007-08, even though at the same time it is observed that the pace of improvement has slowed down. Despite major achievements in the last decade, education performance in Afghanistan is still among the poorest in the world, and the current rate of improvement will fail to achieve the ANDS targets by 2020.
The share of the Afghan population 25 years and over who have completed any level of formal education is very small – less than 25 percent, and for women as few as 10 percent. However, major improvements in primary and secondary school completion are observed for the younger age group 15-24 years, especially for girls. This is the result of increasing school attendance in the past decade. The net primary attendance ratios for girls and boys are now 48 and 64 percent respectively, up from 29 and 43 percent in 2005, and 42 and 60 percent in 2007-08.The downside of these igures is that still some 1.2 million girls and over 900 thousand boys are missing out on the opportunity to learn basic life skills. Net secondary attendance ratios are 23 and 42 for girls and boys respectively, up from 10 and 22 percent in 2007-08.
Opportunities to attend education are few, especially for girls and women, and rural and Kuchi populations in general, even though the gender gap in education and literacy show continuous improvement, in both absolute and relative terms. Thus, the ratio of girls to boys in primary, secondary and tertiary education are 0.74, 0.53 and 0.42 respectively, compared to 0.69, 0.49 and 0.28 in 2007-08. For girls, cultural barriers are dominant among the reasons for not attending school; for boys the main reason is the need to contribute to family income. The importance of these reasons increases with age. Insecurity and distance to schools are important reasons for non-attendance in rural areas. No more than around two in ive rural households live within two kilometres of a primary school. Overall net primary school attendance in rural areas is 54 percent, while in urban areas it is 78 percent.
With regard to literacy, similar patterns and changes are recorded as for school attendance. The adult literacy rate is 45 percent for men and a low 17 percent for women. The improvements in literacy between 2005 and 2011-12 are particularly observed in the youth literacy rate, which increased from 20 to 32 percent for females aged 15-24 and from 40 to 62 percent for male youth. Consequently, the gender parity index for youth literacy has improved from 0.45 in 2007-08 to 0.52 in 2011-12. Again, the population in rural areas is at a severe disadvantage: the youth literacy rate there is only 39 percent, compared to 71 percent in urban areas.
Health
Although Afghanistan’s health indicators are poor in an international perspective and cultural barriers impede progress for many components of maternal and child health, signiicant improvement is evident from successive surveys in the ten years preceding NRVA 2011-12.
Perhaps the most consistent and impressive improvements are observed for maternal health indicators. The proportion of women served by skilled birth attendants has increased to 40 percent, compared to 24 percent in 2007-08 and only 16 in 2005. Similar improvements are found for provision of skilled ante-natal care – to 52 percent, compared to 36 percent in 2007-08 and 23 percent in 2005 – and deliveries in institutional health facilities – 36 percent, compared to 15 percent in 2007-08.
Improvements in the areas of child health seem more modest as far as indicators were measured by NRVA 2011-12. Full protection against neonatal tetanus through at least two TT injections was received by 35 percent of women during their last pregnancy, which is only a small difference with the igure for 2007-08 (33 percent). Supplementation of Vitamin A even seems to have declined in the past four years. The proportion of children oficially registered at birth is still only 35 percent.
One of the main concerns with respect to Afghanistan’s health system performance is the very unequal health care provision between urban and rural populations. Invariably, for the majority of Afghanistan’s rural population service delivery and health outcome indicators are signiicantly lower than for urban dwellers. And the situation is generally even far worse for the nomadic Kuchi population. Thus, in urban areas the percentage of deliveries assisted by skilled health personnel is 76 percent, while that in rural areas is only 33 percent and for Kuchi women even only 13 percent.
In terms of time required to reach the nearest health facility, access to these facilities has improved signiicantly with the implementation of outreach programmes of the Ministry of Public Health and the distribution of private health facilities
across the country. However, cultural responsiveness of the health sector – for instance in terms of provision of female health care providers – remains an important obstacle for the effective use of health care, especially by women. In addition, costs for health services and treatment are prohibitive for many households, in particular for poor households.
Housing and household amenities
The housing conditions of the Afghan population can be deined as poor, with large differences between urban and rural communities. However, several indicators show marked improvements.
Overall, 46 and 8 percent of the population use improved drinking water sources and improved sanitation facilities respectively. The igure for safe drinking water is a signiicant improvement compared to NRVA 2007-08, when it was only 27 percent. The situation improved in rural areas in particular, where the percentage using improved sources increased from 20 (2007-08) to 39. The situation with regard to sanitation improved slightly, but continues to be poor, with only 8 percent of the population having access to improved sanitation. The still widespread lack of basic infrastructure for water and sanitation implies high risks of potentially fatal diseases, and is especially detrimental for the health and survival chances of infants and young children.
Health conditions in the household are further impaired by the use of solid fuels for cooking (80 percent) and heating (97 percent). The lack of electricity is becoming less of an impediment for the effective spread of information to the general public through mass media, like radio, TV and the internet, as 69 percent of households had access to some source of electricity in the month preceding the survey, compared to 42 percent in 2007-08, and only 23 percent in 2005. However, use of the internet is still virtually non-existent among the population (only 0.5 percent of Afghans use the internet), while mobile phones are used by only 14 percent of the population (up from 6 percent in 2007-08).
Physical access to rural communities is often problematic, as around 14 percent of households there live in villages located more than 6 kilometres from the nearest drivable road. Only 14 percent of Afghans – 45 percent in urban areas and 5 percent in rural areas – live in a dwelling that can be considered durable. Some 37 percent live in an overcrowded dwelling, and – taking water and sanitation conditions into account – 87 percent of urban dwellers (5.3 million people) live in slum-like conditions of poverty and physical and environmental deprivation.
Challenges and strategies
Afghanistan is a country with a high-risk proile, due to a combination of climatic and natural circumstances and being a historically grown hotbed of social and political conlict and economic vulnerability. Consequently, household and community assessments depict challenging and uncertain living conditions for a large majority of the population in Afghanistan. No less than 84 percent of households reported for the year preceding the survey experiencing one or more household shocks – risk events with negative outcomes that are outside people’s direct control. Many shocks are related to food and farm prices (reported by 61 percent of households), drinking water supply (47 percent), agricultural problems (37 percent) and natural disasters (36 percent), most of which are related to the combination of a largely agricultural society, harsh climatic conditions and underdeveloped farming and veterinary support.
As the main priority both households and Shuras stress the need for further improvement of a safe drinking water supply. In addition, improvement of road, irrigation, electricity, health and education infrastructure are high on the Afghan wish list.
1 INTRODUCTION
After decades of war and political instability, Afghanistan remains one of the poorest countries in the world. In 2011 Afghanistan ranked 172nd out of 187 countries in the UNDP Human Development Index, a summary measure that is based on development dimensions of health, education and living standards (UNDP 2011). This poor ranking represents the challenges faced by large parts of the country’s population, but at the same time hides signiicant improvements in different sectors in the period since 2001.
In order to address the information needs of the Government of Afghanistan and other parties to inform and prioritise development policies and programmes, the Ministry of Rural Rehabilitation and Development (MRRD) and the Central Statistics Organization (CSO) started to conduct the National Risk and Vulnerability Assessment (NRVA). Building on two survey rounds in 2003 and 2005, the NRVA has developed into a full-blown multi-purpose survey under the sole responsibility of CSO It now captures a wide variety of development indicators in such areas as poverty, food security, labour market performance, demography, education, health, gender equality, housing and agriculture.
As such, the NRVA is the major single source of socio-economic statistics of the country. The survey is unique in the sense that – with inclusion of the nomadic Kuchi – it represents the entire population of Afghanistan, and that – since the NRVA 2007-08 survey – year-round data are collected in order to capture the seasonality of indicators like employment, food security and poverty. In order to underline the comprehensiveness of the NRVA, from the next (2013-14) survey round onwards the survey will be labelled ALCS – Afghanistan Living Conditions Survey.
This report presents the results of the latest NRVA that was conducted in 2011-2012. The primary aim is to provide the latest information about the living conditions of Afghanistan’s population and about the performance of, among others, the agricultural sector, the labour market and the education and health systems. The information presented includes 22 indicators to monitor the implementation of the Afghanistan National Development Strategy (ANDS) and 20 Millennium Development Goals (MDG) indicators. The main focus in this report is on information at national level, frequently disaggregated for residential populations (urban, rural and Kuchi). Provincial-level information is largely outside the scope of the present report, although Annex 10 provides tables for selected indicators and statistics at provincial level. The information provided in this report is also largely descriptive in nature; cross-sectoral and more in-depths analyses – especially those aiming at cause-and-effect relationships – will require additional efforts and reporting.
Chapter 2 describes the main methodological characteristics of the NRVA 2011-12, including brief descriptions of the sampling design, survey questionnaires, data collection and processing, data limitations, and comparison with the previous NRVA surveys. Several annexes provide further elaborations and technical details of the methodology.
Subsequent chapters cover the subject-matter of the survey. Population structure and change are addressed irst in chapter 3, as these factors permeate into every development aspect of the remaining report sections. Afghanistan’s population composition by age and sex is analysed, as well as some of the underlying demographic dynamics. In addition, household and marriage patterns are examined.
Chapter 4 provides an analysis of the structure of Afghanistan’s labour market and covers various labour force indicators, including employment, underemployment, unemployment, working hours, vulnerable employment, and differentiation by age and sex.
Agriculture, including farming and livestock production, is the subject of chapter 5. The chapter analyses the agricultural sector with a view on access to land, land area size, farm and garden production, type and number of livestock, and sale of animals and animal products, as well as relevant production factors in this sector.
The key chapters 6 and 7 present the results of, respectively, poverty and food-security analyses. Both chapters engage in a irst attempt to proiling the poor and the food insecure population in Afghanistan, and compare the results with those from NRVA 2007-08.
The twin chapters 8 and 9 are dedicated to the social sectors of education and health, and to the changes occurring in these sectors. The former analyses literacy rates, school attendance and educational attainment, whereas the latter’s main focus is on out-of-pocket health expenditure and maternal health, besides some indicators for access to health facilities and child health.
The housing situation is described in Chapter 10, with a view on tenancy arrangements, physical characteristics of the dwelling and housing facilities, like electricity, drinking water and sanitation. Household shocks and coping strategies, as well as community preferences for interventions are outlined and analysed in chapter 11.
The last annex to this report provides a comprehensive list of concepts and deinitions that may guide the reader in a deeper understanding of the presented materials.
2 SURVEY METHODOLOGY AND OPERATIONS
2.1 Introduction
The methodologies applied in the NRVA 2011-12 – in terms of questionnaire and sampling design, analysis, and procedures for data collection, data capture and data processing – have taken into account the speciic circumstances of Afghanistan. These refer to issues such as ieldwork challenges, stakeholder information needs, socio-cultural speciicities, the statistical infrastructure and implementation capacity at various levels of the survey hierarchy. At the same time, methodologies were designed as to comply with international survey recommendations and best practices. Experience gained from the previous rounds of NRVA and application of international standards resulted in some methodological changes, but as much as possible the rigour of previous achievements has been maintained in order to ensure comparability over time.
This chapter provides an introduction to different methodology dimensions adopted in the present round of NRVA for a better understanding of the survey results that are presented in the subject matter chapters 3 to 11. In this respect the different sections will also highlight methodological changes compared with previous rounds.
2.2 Stakeholder involvement
As the primary aim of NRVA is to serve the information needs of data users, consultation with stakeholders has been carried out in several crucial stages of the survey. The group of stakeholders that participated in the meetings organised by CSO included line ministries 1, UN and other international organizations 2, bilateral donors 3 and academic and research bodies.
At the onset of the present NRVA round (January-March 2010) a series of three meetings with stakeholders was organised to discuss and deine the information to be collected in the 2011-12 round of NRVA. These meetings also dealt with the sustainability and long-term perspective of the NRVA as Afghanistan’s most important instrument for producing socio-economic information (see Section 2.3). Further stakeholder meetings were organised to discuss the NRVA tabulation and analysis plan and the outline of this inal report (July and September 2012).
In addition to these meetings, a number of key stakeholders were present in the NRVA Steering Committee to supervise the work progress and recommend speciic actions. Similarly, relevant stakeholders participated in the Technical Advisory Committee (TAC) to scrutinise methodological and technical matters and provide input if and when required.
2.3 Questionnaire design
Since 2003, the successive NRVA surveys incorporated increasing numbers of questions. This continued even to the extent that interview burden and workloads in data processing and analysis run the risk of overreaching the capacity of ieldworkers, respondents and CSO staff. The need to pack all information needs into one survey that was conducted at irregular intervals was reduced when the Afghanistan National Statistical Plan (ANSP) (CSO, 2010) was formulated. The ANSP presented a medium-term perspective that anticipated the implementation of NRVA as the national multi-purpose survey of Afghanistan on an annual basis. This allowed the introduction of a schedule of rotating questionnaire modules: rather than including all questions and topics every year, for successive years different modules are added or expanded to provide more detailed information on speciic subjects in addition to the core questionnaire that annually covers a standard set of key indicators.
In the series of consultations with stakeholders in 2010, agreement was reached to re-design the NRVA data collection and questionnaires according to this rotation principle, which implied that meeting information needs, as well as survey implementation could be achieved in a more sustainable way. Annex II provides a summary of contents of successive survey rounds.
The core of NRVA 2011-12 is a household questionnaire consisting of 15 subject sections, 11 administered by male interviewers and answered by the male household representative (usually the head of household), and four asked by female interviewers from female respondents. In addition, the questionnaire included three modules for identiication and monitoring purposes (see Table 2.1). On average the time required to answer the household questionnaire was around one-and-a-half hour.
Table 2.1 NRVA 2011-12 household questionnaire modules (subject matter modules in bold)
Male modules Female modules
Household identiication Labour Household identiication
Process monitoring Household income Missing household members
Household roster Household expenditure General living conditions
Housing and amenities Migration Food consumption
Livestock Education Maternal and child health
Agriculture
Household assets Household shocks and
coping strategies
In addition to household information, data were collected at community level through two community questionnaires – one male and one female Shura questionnaire – addressing the topics presented in Table 2.2. Finally, the NRVA survey instrument included a questionnaire to collect data on market prices for food items and a few other commodities. Annex III provides the set of NRVA 2011-12 questionnaires.
Table 2.2 NRVA 2011-12 Shura questionnaire modules (subject matter modules in bold) Male Shura questionnaire modules Female Shura questionnaire modules Community identiication Community identiication
Process monitoring Process monitoring
Community access and access to facilities Community development priorities
Community projects
Community development priorities
Agricultural calendars
2.4 Pilot training and pilot survey
In order to validate the survey instruments, as well as training and ield procedures, these were tested prior to the start of the ieldwork. The questionnaires were translated into Dari and Pashto, and were subjected to a pre-test by CSO staff. After this, a full pilot was conducted in October 2010. To this end four surve