PPI-UTM TESIC 2013
Technology, Education, and Science International Conference (TESIC)
Services Measurement Bina Darma Career and Training Center (BDCTC)
’s
Website Using the Webqual Method
*
Febriyanti Panjaitan
Technology Information, Bina Darma University, Jl.A.Yani No.12, Palembang - 30264, Indonesia
Abstract
In the world of education website is a forum for disseminating information. Service information on a website needs to be measured to determine the level of user satisfaction and obtain feedback. Bina Darma Career and Training Center (BDCTC)’s is a training institute and job placement center at Universitas Bina Darma. In this study, website BDCTC will be measured by using the Webqual method. Webqual is one method or technique of measuring the quality of a website based on user perception. Level of satisfaction with the use of quality measurement techniques through the website 3-dimensional (Usability, Information, and Service), on the dimensions of the Usability and Service does not have a significant effect on user satisfaction; while at the Information have any impact on satisfaction. Quantitative Descriptive analysis is used to examine the relationship of the Webqual dimensions to user satisfaction.
Keywords: Webqual, user satisfaction, descriptive quantitative.
I.
IntroductionWith the development of computer technology is expected to be an effective medium for finding and disseminating information. One is the Internet, where the Internet is a medium of communication to obtain as much information from anywhere and anytime by using a computer and modem plus telephone network or connection via an ISP (internet service provider). In the world of education website is a place to promote and disseminate information. Universitas Bina Darma ( UBD ) has a website with the address is www.binadarma.ac.id , on this website there is information relating to the Universitas Bina Darma one Traning institute of information about the Job Placement Center and Bina Darma Career and Training Center ( BDCTC ) the address is www.bdctc.or.id , the institute presented with the aim to establish and maintain mutually beneficial relationships between industry and Universitas Bina Darma , especially in the field of development of quality resource students and alumni in order to meet the needs of professionals . In this study, measurement services BDCTC website located at www.bdctc.or.id with Webqual method.
II.
Materials And Method2.1. Webqual
Webqual is one method or technique of measuring the quality of a website based on user perception. This method is the development of a SERVQUAL-developed by Parasuraman, which is widely used prior to the measurement of service quality. Webqual instrument in the study were developed by the method of Quality Function Development (QFD).
Webqual been developed since 1998 and has undergone several iterations in the preparation of the dimensions and the question items. Webqual 4.0 is compiled based on research in three areas, namely:
1. Information Quality is the quality of the content contained on the site, the suitability of such information for the purpose of user accuracy, format and linkages.
Webqual can be used to analyze the quality of a website, both the company's internal website (intranet) or external websites. questionnaire. Questionnaire was used because of its shape easily provided, namely in the form of the questions that have been given answers selected by the respondent lived. In addition, the questionnaire has the advantage, among others, faster and cheaper.
Nevertheless, difficulties will arise in implementing the methods of questionnaire respondents who are not willing to give information, the respondents were unable to provide information and influence the process of inquiry (questioning process), Questionnaires will be distributed to the respondents are concerned that the alumni, students and stakeholders. Respondents were asked to fill out all the questions that exist to give a scale of 1-5. To facilitate the respondents in the study questionnaire and answer the question then is divided into 3 sections.
1.The first part is namely the demographic data of the respondents. Respondents were asked about Janis, sex, education level, location, have access to, the first access, frequency of access, and the purpose of accessing the website BDCTC.
2.The second part, respondents will ask about the important things in their opinion the scale (5) Very Satisfied, (4) satisfied, (3) Self-satisfied, (2) are satisfied and (1) Very Dissatisfied.
3.The third section, respondents are asked about their perceived according to the scale (5) Very Satisfied, (4) satisfied, (3) Self-satisfied, (2) are satisfied and (1) Very Dissatisfied.
After all questions were answered, respondents were asked to return the questionnaire and only answered all the questions which will be used as material analysis.
III.
Result and discussion3.1.Validity Test
Researchers will describe the results of a description that includes the company respondents, students and alumni. The description for the company and the students obtained information through interviews either in person or using a telephone. I n detail can be seen below:
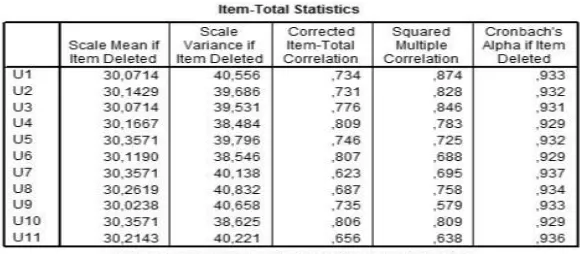
Table 1. Validity Test results of research instruments
3.2. Reliability Test
Reliability means the level of reliability of the results of a measurement. Measurement has high reliability, the measurements are able to provide a reliable measurement results (reliable). Reliability is one of the main character trait or a good measurement instrument.
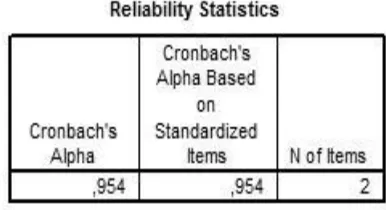
Based on the calculation of the reliability of the questionnaire obtained assessed for each variable are as follows:
Table 2. Test Reliability instruments Usability (X1)
Table 3. Reliability Test Results instruments (X2)
Table 4. Reliability Test Results instruments Service (X3)
Table 5. Reliability Test results of user satisfaction instrument (Y)
From the above calculation, all values under column Cronbach's Alpha of more than 0,600 which means that all the items studied variables are reliable or have a level of reliability is high (reliable), and the calculation is no longer QUOTE item variables excluded for not meeting criteria of reliability.
3.3. Anova
Table 6. Anova
From the above table is known that the calculated F value is 38.772 with a significance level of P-Value (Column Sig) = 0.000, this means that there is a highly significant effect of Usability, Information and Service together on User Satisfaction, because the value is less of the value of determination = 5% (Pv < ).
3.4. Regression Coefficient Test Results
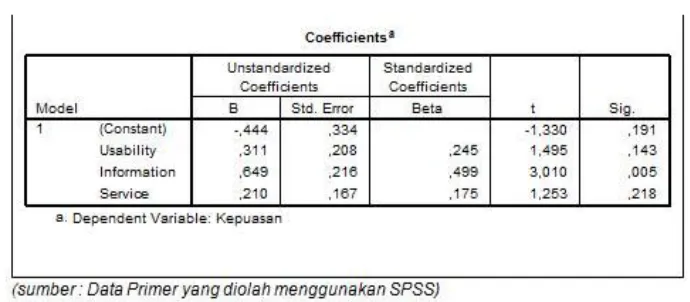
Table 7. Regression Coefficient Test Result
Based on the table above, since all the variables determining the significance level of P, < is set at 0.05 so from the regression model can be developed multiple linear regression equation as follows:
Ŷ = -0,444 + 0,311X1 + 0,649X2 + 0,210X3 + e
From the equation above it can be interpreted as follows, the value of -0.444 means that if Usability (X1), Information (X2), and Service (X3) is equal to zero then the performance will be worth -0.444.
X1 coefficient = 0.311 means that if Usability change the score by 1 unit Satisfaction will also undergo a change of 0.311 with the provision that the Information (X2) and Service (X3) is constant.
Coefficient X2 = 0,649 means that if Usability changes by 1 unit then the satisfaction score statistics will also unchanged at 0,649, with a note that Usability (X1) and Service (X3) is constant.
Ccoefficient X3 = 0.210 means that if the communication had a change of 1 unit of the statistical score performance will also change the value of 0.210, with a note that Usability (X1) and Competency Information (X2) is constant.
Next to be seen whether the influence of variables Usability, Information, and Service to the satisfaction of significant partial t-test will be used. Based on the above table obtained significance level ( = 5%) for Satisfaction Pv = 0.143 (P-value> ), This means that the partial Usability no significant effect on user satisfaction..
Information is the significance level to 0.005 (P-Value <), this means that the partial Usability significant effect on satisfaction, and Service with was 0.218 (P-Value>) also means that the partial service no significant effect on satisfaction.
3.5. Variabel Usability
Usability variable that is associated with quality website design and its use. Website Interface BDCTC. Based on the descriptive analysis in the table above was found that the more dominant respondents argued quite satisfied.
Also in line with 5.21 regression results that test and partial regression coefficients (t test) from Usability variable has a value that is not significant. This means that the usability variables have no direct relationship to variable customer satisfaction.
3.6. Variabel Information
Variable Information is a match between the information available with the existing goals. Users do not feel the information is useful and easy to understand. Based on the descriptive analysis in the table above that the more dominant respondents found information variables offered by the Website BDCTC have quite satisfied assessment..
Also in line with the regression results in the table above that the regression coefficients or partial test (t test) of the variable information shows the value significantly. This means that the variable information has a direct relation to variable customer satisfaction.
3.7. Variabel Service
Service is variable service perceived by the users for accessing websites such: admin does not have a quick response on the menu and contact quest book.
Based on the descriptive analysis in the table above, that more respondents think that the dominant variable service offered by Website BDCTC's had quite satisfied assessment
Also in line with the regression results in the table above that the regression coefficients or partial test (t test) of the variable Service showed insignificant value. This means that the variable Service does not have a direct relation to variable customer satisfaction.
All the variables that have been in if the Usability, Information and Service Information is the dominant variable is very influential to the satisfaction of the alumni of the user must update the menu BDCTC career / job opportunities every day, the number of visitors will increase BDCTC website.
VI. CONCULSION
Based on the research and discussion that has been described in the previous chapter, it can be concluded based on t test (partial) that the level of satisfaction of users of the Website BDCTC seen from 3 dimensions: Usability and Service has no significant effect on satisfaction, while at the Information to have significant impact against complacency. The third dimension of the most dominant influence is information.
VII. REFRENCES
Admin, 2010. Belajar Dan Berbagi Tips & Trik Web Dan Wap . Retrieved December 13, 2010, from:http://www.trik.wapgem.com/a/ciriwebygbaik.html
Al Fatta, Hanif, 2007. Analisis & Perancangan Sistem Informasi. Yogyakarta. Andi.
Barnes, S.J dan R. Vidgen 2000. WebQual : An Exploration of Web Site Quality. In Proceeding of the Eighth European Conference on Information Systems, Vienna July 3-5.
Drummerfan, 2010, Perbedaan Mekanisme, Proses, Tinjauan, Analisis, dan Evaluasi. Retrieved December 13, 2010, from http://drummerfan.wordpress.com/2012/10/13/perbedaan-mekanisme-proses-tinjauan-analisis-dan-evaluasi/.
Hartono, Jogiyanto 2000. Analisis dan Desain Sistem Informasi: Pendekatan Terstruktur Teori dan Praktek Aplikasi Bisnis. Yogyakarta, Andi.
Gerson, Richard, F, 2004, “Mengukur Kepuasan Pelanggan”, Jakarta, PPM.
Imam, Arif 2007, “Analisis Faktor-Faktor yang Mempengaruhi Kepuasan Pelanggan Online” Jurnal Manajemen dan Agribisnis, Vol 4 No. October 2, 2007.
Kuswadi, 2004. Cara Mengukur Kepuasan Karyawan, Jakarta. PT. Elex Media Kumputindo.
Loiacono, E. T., Watson, R. T., & Goodhue, D. L. 2002. A 12-factor quality super-model from a user’s perspective.American Marketing Association: Winter Marketing Educators’ Conference 13 (Austin, Texas: American Marketing Association, 2002): 432-438.
Manullang, Ida 2008 “Pengaruh Kualitas Pelayanan terhadap kepuasan pelanggan jasa penerbangan PT. Garuda Indonesia Airlines di Bandara Polonia Medan” Jurnal Pascasarjana Universitas Sumatera Utara.
]Nawangsari, Sri 2008, “Analisis Diskriptif Kepuasan Masyarakat Pengguna terhadap Layanan Situs Web Bank X”. Proceeding, Seminar Ilmiah Nasional Komputer dan Sistem Intelijen, August, 20-21 2008.
Rahmad, Hendra 2010 “Kualitas pelayanan website resmi milik Pemerintah kota Surakarta” Jurnal Universitas Sebelas Maret Surakarta.
Service. The Free Press Maxwell Macmillan Canada. Toronto.
STIE Perbanas, 2010, Kriteria website yang baik. Retrieved December 13, 2010, from http://ict.perbanas.ac.id/Article/Apa-kriteria-website-yang-baik.php.
Supranto, 2001, Pengukuran Tingkat Kepuasan Pelanggan Untuk Menaikkan Pangsa Pasar, Jakarta, Rineka Cipta.