Abstract—This research conducted a study on non-financial performance relationship with a financial performance. The framework used is the Balanced Scorecard. Non-financial performance is represented by employee satisfaction, service quality and customer satisfaction, while financial performance is represented by the profitability. In this research, the data collection is done by distributing questionnaires to 794 employees and customers in 55 restaurants and cafés in Surabaya-Indonesia which adopt the table service concept. The Partial Least Square for Multivariate Analysis is employed for processing the data. The result of this research is useful to be able to explore more deeply the relationship between each of the non-financial and the financial performance.
Index Terms—Employee Satisfaction, Profitability, Partial Least Square.
I. INTRODUCTION
Recently there is a tremendously rapid growth of restaurant dan café businesses in the world as eating out has
become part of daily human‟s life. Surabaya as the second
largest metropolitan city of Indonesia has become the center of business and commerce of Indonesia after Jakarta. Trading, hotel and restaurant industries have contributed around 38,96% to the Gross Regional Domestic Product of Surabaya in 2010 [1]. Whilst the rapid growth of the business is obvious, the competition in restaurant and café businesses have been very tight so far. In response to the high competition pressure and the dynamic market changes, many restaurants and cafés have made efforts to execute continuous improvement and necessary immediate changes in order not to be left behind the competition. Not only are restaurant and
café businesses expected to provide „good‟ food and
beverages but also the service delivery to the customers. In other words, restaurants dan cafés should provide both
„good‟ food and beverages and at the same time „good‟ or „satisfying‟ service delivery.
Based on the Balanced Scorecard (BSC) framework, the fundamental factor of service quality is employee satisfaction or learning-growth performance. In this case, service quality will influence customer satisfaction and then customer satisfaction will influence the restaurant or café profitability. This is the framework which is developed by Kaplan and
Manuscript received September 6, 2012; revised October 11, 2012. Devie and Josua Tarigan are with Business Accounting Program, Accounting Department, Petra Christian University ([email protected]).
Deborah Christine Widjaja is with Hospitality Management Program, Management Department, Petra Christian University. She holds the Certified Professional Human Resource (CPHR).
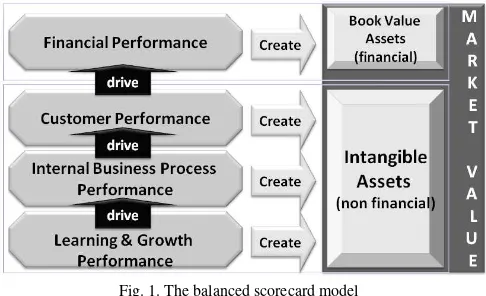
Norton in the concept of Balanced Scorecard. Some researches related to Balanced Scorecard have been done recently, such as one research done by Yee [2] entitled “The Impact of Employee Satisfaction on Quality and Profitability in High-Contact Service Industries”. Besides profitability factor, the performance of non-financial perspective (employee, service quality and customer satisfaction) is essential to be analyzed, because this non-financial performance will determine the market value of the business organization as shown in figure 1 below [3].
Fig. 1. The balanced scorecard model
This is the spirit of Balanced Scorecard in which employee growth, internal business processes, customer satisfaction, and profitability are considered as a four-balanced quadrant that drives organizational strategy initiatives. If there is one of the quadrants with less attention then the organization will lose the balance that will cause the organization unable to achieve the organization's strategy.
II. EMPLOYEE SATISFACTION AND PROFITABILITY A. Profitability (Financial Performance)
Profitability is the ability of an organization to generate profit in a certain period of time using capital or asset, either from the creditor or the shareholder himself [4]. Moreover, Warren [5] states that profitability is the ability of an organization to generate profit in a certain period of time by means of capital or asset. From the statements above and the research done by Yee [2], it can be presumed that there are several indicators which are useful for evaluating profitability of an organization, namely: revenue, asset and profit. Kieso and Wegandt [6] gives explanation that the revenue is "inflows or other additions to the common property of a unit or settlement of a liability (or a
The Relationship between Non-Financial Performance and
Financial Performance Using Balanced Scorecard
Framework: A Research in Cafe and Restaurant Sector
combination of both) during the period of delivery or production of goods, service delivery or other activity which is the primary operating of the unit. While assets are defined as resources controlled by the company as a result of past events and it is expected to produce economic benefits in the future for the company. Finally, profit is defined as all income earned by the company deducted with all expenses incurred to earn the income. In Balanced Scorecard framework, profitability is translated into financial perspective.
B. Employee Satisfaction (Learning and Growth Performance)
Job satisfaction (learning and growth) is a fundamental factor which determines profitability performance. Robbins [7] affirms that job satisfaction refers to the general attitude of an individual employee toward his job. Someone who has high job satisfaction is more likely to demonstrate positive attitude toward his job; whereas, someone who is not satisfied with his job is more likely to exhibit negative attitude toward his job. Moreover, Davis [8] reveals that job satisfaction refers to a collection of employee feelings on how pleasant or unpleasant his job is. Davis presented the employee satisfaction factor in his method called Job Descriptive Index (JDI). In this research, there are five indicators of job descriptive index, namely: the job itself, pay, supervision, co-workers, and promotions [2], which are employed to measure the feeling or attitude on satisfaction which is revealed by employees. What is meant by the job itself is the work done by the job holders daily; whether the work matches the educational backgrounds, the ability, interests and skills of the job holders [9]. Pay can be salary or wage. Salary is the fixed remuneration paid to employees periodically which has a definite assurance in its payment. While wage is remuneration paid to employees by referring to the treaty agreed upon payment. Each employee has different motive and expectation upon salary or wage that he or she receives. However, according to Cushway [10] most people would probably agree that employees will always find a fair salary or wage that is interpreted by the organization through a good payroll system. Moreover, supervision is the monitoring if the work plan has been done right or not. It is the process that ensures that the action is in accordance with the plans. Co-workers as a fourth indicator is defined as a level of relationship in which colleagues can demonstrate competence, friendliness, and mutual respect that allows the creation of a social harmony, a supportive work environment, which in turn makes a job more enjoyable [11]. Lastly, promotion according to Nitisemito [12] is a process of employee movement from one position to another position higher. In Balanced Scorecard, employee satisfaction measure is translated into learning & growth perspective.
C. Quality Services (Internal Business Process Performance)
Job satisfaction of employees will determine the service quality delivered by the restaurants or cafés to the customers. According to Kotler [13] service is an intangible product because it is produced by providing facilities supported by good skill and knowledge of the service provider so that it will produce quality service. Zeithaml [14] and Blumberg [15]
on Servqual concept clarify that service quality is essential to form the image and perception of the consumers. However,
good or bad perceptions are formed in the customers‟ mind
depending on how good or bad the employees deliver the service to the customers. In this case, the researchers use five Servqual dimensions developed by Zeithaml dan Parasuraman to measure quality services. Firstly, tangible is everything that can directly be seen, felt, and has physical form which includes the appearance of physical facilities, equipment or supplies, employees, and means of communication. Secondly, reliability is the ability to provide service that is accurate, timely, satisfactory, and reliable. Thirdly, responsiveness is the ability to assist customers by giving out the right service, fast, and responsive in providing services needed by the customer. Fourth, assurance includes the ability or knowledge, courtesy and trustworthiness of staff, so as to convince customers about the quality of services provided. Finally, empathy is the effort to find out and understand individual customer needs by providing excellent communication, caring attitude and attention to customers.
D. Customer Satisfaction (Customer Performance)
In BSC framework, customer satisfaction means performance in customer perspective. According to Kotler [11] “customer satisfaction is a person‟s feelings of pleasure or disappointment resulting from comparing a product perceived performance (or outcome) in relation to his or her
expectations”. On the other hand, Zeithaml [14] believes that customer satisfaction is a response to customer fulfillment which is a consideration of whether the product or service features provide a pleasant level of consumption fulfillment. Therefore, a company must be able to provide product or service which can fulfill the needs or wishes of customers so that customer satisfaction is accomplished. This is because customer satisfaction is one of the determinants of success or failure of a company, because consumers will be more inclined to return to transact with a company that provides the satisfaction than that of the company which does not give satisfaction. The context of customer satisfaction is not limited to customer service, but also products, as well as other external matters. Based on the definition, there are two measures for measuring customer satisfaction which are the general customer satisfaction feeling and the fulfillment of customer expectation about the restaurant.
III. RESEARCH METHODOLOGY A. Research Model
provide feedback to the boss through a commitment to provide better performance for the organization, which leads to higher service quality. Based on these studies, the first hypothesis is proposed:
H1: Employee satisfaction has a positive and significant influence on service quality.
Employees with high job satisfaction level will make customers happier so that it will give a positive influence on customer satisfaction level. On the contrary, employees who are not satisfied tend to exhibit their unpleasant emotion to customers as stated by Wansoo [17] and Brandford [18]. Besides, the underlying theory of employee satisfaction influencing customer satisfaction is the theory of emotional contagion according to Sutton and Rafaeli [19]. Emotional contagion is defined as "the tendency of a person to automatically mimic and synchronize expression, postures, and vocalizations with those of another person and, consequently, to coverage emotionally". Based on these studies, the second hypothesis is proposed:
H2: Employee satisfaction has a positive and significant influence on customer satisfaction.
The relationship between service quality and customer satisfaction is based on many researches as stated by Wang [20] dan Brady [21]. The researches describe that if
someone‟s evaluation on an activity shows that he has
reached the result as intended, the fulfillment of the intended result is accomplished and then it is followed by a response towards satisfaction. Moreover, theory used in the relationship between service quality and customer satisfaction is attitude theory propounded by Lazarus [22]. In this theory, it is stated that if an activity is judged to have reached the planned results, the fulfillment of the desired results are realized and followed by affective response that leads to satisfaction. Based on these studies, the third hypothesis is proposed:
H3: Service quality has a positive and significant influence on customer satisfaction.
There are several reasons why customer satisfaction has a positive impact on organization profitability. Firstly, customer satisfaction increases customer loyalty, influences customer intention to repurchase in the future as stated by Hallowell [23] dan Anderson [24]. Secondly, Reicheld and Sasser in Hallowell [23] reveal that very satisfied customers are willing to pay premium and less price-sensitive. It means that customers tend to pay the advantage they get and be tolerant with price increase which then will increase the economic performance of the organization. Based on these studies, the fourth hypothesis is proposed:
H4: Customer satisfaction has a positive and significant influence on company profitability.
Employee satisfaction will influence the service quality provided is one of the aspects of internal business process perspective. Good service quality will satisfy customers. Customer satisfaction is part of customer perspective. Customers who are satisfied with service quality provided will be more loyal to the company. This will increase company profitability. Company profitability is one of the aspects of financial perspective [25]. Based on these studies, the fifth hypothesis is proposed:
H5: Employee satisfaction has a positive and significant influence on company profitability.
Findings from a research show that companies that offer quality service will be able to achieve a higher growth than the average companies in the stock market [24]. This is because of quality improvement that enables the companies gain higher profit including market share by setting higher price than the competitors. Based on these studies, the sixth hypothesis is proposed:
H6: Service quality has a positive and significant influence on company profitability
B. Sampling and Statistical Testing
Population in this research is employees and customers of restaurants and café which are located at several big malls in Surabaya, such as: Galaxy Mall, City of Tomorrow, Plaza Surabaya, Pakuwon Trade Center, Plaza Tunjungan and Surabaya Town Square. The population is indefinite. In multivariate calculation, the number of samples are minimum 10 times more than the number of research variables. Therefore, the minimum samples of this research are 120 for both customers and employees. Moreover, the sampling method is using purposive sampling. This research employs in total 794 employee respondents and customer respondents. Several phases of data analysis and data validation are done such as: validity test, reliability test and other analysis using Partial Least Square (PLS). In this research, respondents were asked to indicate their agreement/disagreement with each item on a five-point Likert scale ranging from 1 for
“strongly disagree” to 5 for “strongly agree”. The confidence
interval degree is 95%.
IV. RESEARCH FINDINGS A. Data Analysis
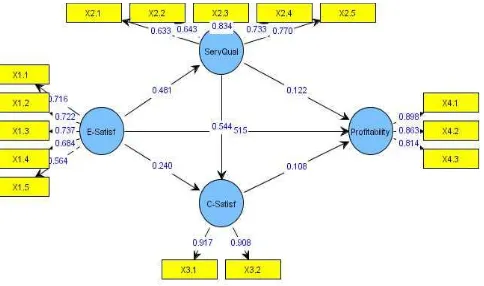
In analyzing the influence of job satisfaction of employees on restaurant and café profitability in Surabaya, several analysis tools are employed in PLS, such as: the outer model which comprises of convergent validity, composite reliability and also inner model. From the convergent validity, the result of the analysis shows that the validity and reliability levels are good in which all the questionnaire items have loading value above 0,5. The result of the research and the outer loading value of each variable are shown in figure 2 below.
The second part is the composite reliability. Composite reliability test the reliability value between blocks of indicators of constructs that shape it. Tabel I is the the output of composite reliability, in which the composite reliability is good if the value is above 0.70. Based on the output table, it is shown that the composite reliability value for employee satisfaction variable is 0.816, for service quality variable is 0.847, for customer satisfaction variable is 0.908, and for profitability variable is 0.894, where the four values are all greater than 0.70.
TABLEI:COMPOSITE RELIABILITY
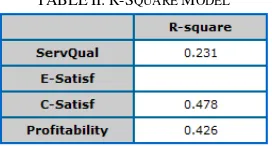
Third is Inner model or R-square Model which is the result can be seen in table 1 as follows. Goodness of fit in PLS can be seen from the Q2 value. The value of Q2 has the same meaning with the determination coefficient (R-square / R2) in regression analysis. The higher the R2, the more fit the model with the data. From the table above, it is known that the Q2 value is: Q2 = 1 – [ (1-0,2312) x (1-0,4782)x (1-0,4262) ] = 0,597 = 59,7%.
TABLEII:R-SQUARE MODEL
The last analysis is the result from the inner weight, which shows that the relationship among the variables is positive (original sample estimate). From the six kinds of relationship among the variables, it can be seen that there are two kinds of relationships which are not significant in which the t-statistic values are lower than 1,96. This applies for the relationship between ServQual and profitability (0.659) and customer satisfaction with profitability (0.685).
TABLEIII:INNER WEIGHT RESULT
B. Further Discussion
One of the goals of this research on Balanced Scorecard is to look in more detail the relationship condition between the perspectives that exist in the Balanced Scorecard. Then each of these relationships will be explored into a matrix with four
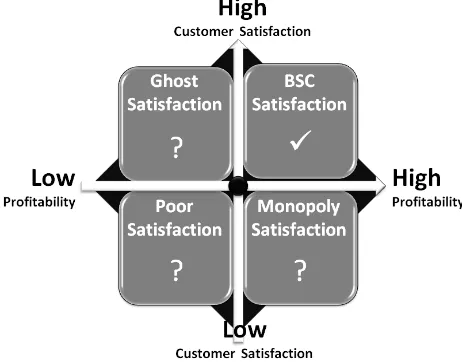
quadrants. So of the six relationships that exist in the Balanced Scorecard, it can be made 6 matrices and 24 quadrants. Of course the matrix or quadrants that we see in detail is the relationship in the Balanced Scorecard that is not proven based on hypothesis, in this case the relationship between SERVQUAL with Profitability, and Customer Satisfaction with Profitability. In the case of SERVQUAL and Profitability, it can be made a matrix as in figure 3 which produces four quadrants. The quadrant we need to consider in detail is the quadrant that has a question mark "?". The ideal quadrant which corresponds to the hypothesis is "BSC Quality" quadrant, in high SERVQUAL and high Profitability results. While Monopoly Quality is low SERVQUAL, but producing high Profitability. This condition only occurs under conditions of monopoly market, where customers do not have the option to choose. While Poor Quality is the condition when the SERVQUAL is low with low Profitability as well. In this condition, the organization needs to clean up because it has a low SERVQUAL. In this research, what happens is the condition of "Ghost Quality", meaning that the organization has been building high quality with high cost and ultimately lead to reduced Profitability. This is consistent with the conditions of most of the restaurant in Surabaya, where the industry is developing rapidly these days where competition is fierce which cause the restaurants competing to build the quality of the service. But the future is expected to come after a period of SERVQUAL development is done, where slowly the Profitability conditions will improve. Therefore, to assess this, the same research needs to be done in the next five years, to see the development of Profitability improvement of the restaurant industry.
Fig. 3. Matrix servqual-profitability
Monopoly Quality where Satisfaction is low but Profitability is high. This condition only occurs under conditions of monopoly market, where customers do not have the option to choose. Whereas Poor Satisfaction is when Satisfaction is low and Profitability is also low. In this condition, the organization needs to clean up because it has a low level of Satisfaction. In this research, what happens is the condition
of “Ghost Satisfaction”, meaning that the organization has
built high satisfaction with high cost and ultimately also lead to reduced Profitability. Similar to SERVQUAL condition, to assess this further, the same research needs to be done in the next five years, to see the development of Profitability improvement of the restaurant industry.
Fig. 4. Matrix customer satisfaction-profitability
V. CONCLUSION
Based on the data analysis, it can be concluded that out of six hypotheses, there are two hypotheses which are not proven (H5 and H6) because the relationship is not significant eventhough it is positive. Conceptually in BSC, it is proven that the relationship among variables or perspectives are positive. However, the level of significance between Servqual and Profitability, and Customer Satisfaction and Profitability are proven to be not significant. This is because some of the restaurants and cafés in the research are still building the quality to satisfy the customers. Nevertheless, the effort in building the quality give an impact to the cost increase that lessen the profitability.
REFERENCES
[1] Website of Surabaya City. Informasi Laporan Penyelenggaraan Pemerintahan Daerah Kota Surabaya tahun 2010. www.surabaya.go.id. [2] R. W. Yee, A. Yeung, and T. C. Cheng, “The Impact of Employee Satisfaction on Quality and Profitability in High-Contact Service Industries,”Journal of Operations Management, 2008.
[3] Devie and J. Tarigan, “Merancang Knowledge Management Model Dengan Balance Scorecard,” in Proc. Knowledge Management
Conference, Intitute Teknologi Bandung & Widyatama University,
2006.
[4] D. Van Meter and H. Van Carl, “The Policy Implementation Process: A Conceptual Framework,”Administration and Society, vol. 6, 1975. [5] C. S. Warren, J. M. Reeve and P. E. Fess, Accounting Principles,
South-Western, 2004.
[6] J. J. Weygandt, P. D. Kimmel and D. E. Kieso, “Financial Accounting: 2010 IFRS Update,” 6th Ed., International Student Version, John Wiley, 2010.
[7] S. P. Robbins, Organizational Behavior: Concept, Controversies and Applications, Prentice-Hall, 2001.
[8] K. Davis and J. Newstrom, Organizational Behavior: Human
Behaviour at Work, Mc Graw-Hill, 1997.
[9] R. E. Riggio, Introduction to Industrial and Organizational
Psychology, New York City Harper Collins Collagr Publishers, 2006.
[10] B. Cushway, Human Resource Managament, McGraw-Hill, 2006. [11] F. Luthans, Organizational Behavior, McGraw-Hill, 2005.
[12] A. Nitisemito, Manajamen Personalia, Jakarta: Ghalia Indonesia, 1992.
[13] P. Kotler and K. Keller, Marketing Management, Prentice Hall, 2007. [14] V. Zeithaml, A. Parasuraman and L. L. Berry, Delivering Quality
Service: Balancing Customer Perceptions and Expectations, The Free
Pers, 1990.
[15] D. F. Blumberg, Managing Service as a Strategic Profit Center, McGraw Hill, 1991.
[16] P. M. Blau, Exchange and Power in Social Life, John Wiley, 1964.
[17] K. Wansoo, “Customer‟s Responses to Customer Orientation of
Services Employees in Full-Services Restaurants: A Relational Benefits Perspective,”Journal of Quality Assurance in Hospitality &
Tourism, 2009.
[18] K. Brandford, Crant, and Philips, “How Suppliers Affect Trust with Their Customers: the Role of Salesperson Job Satisfaction and Perceived Customer Importance,”Journal of Marketing Theory and Practice, 2009.
[19] A. Rafaeli and R. I. Sutton, “Emotional contrast strategies as means of social influence: Lessons from criminal interrogators and bill collectors,”Academy of Management Journal, 1991.
[20] I.-M. Wang and C.-J. Shieh, “The Relationship between service quality and customer satisfaction: the example of CJCU Library,”Journal of
Information and Optimization Science, 2006.
[21] M. K. Brady and C. J. Robertson, “Searching for a Consensus on the Antecedent Role of Service Quality and Satisfaction: an Exploratory Cross-National Study,”Journal of Business Research. 2001. [22] R. S. Lazarus, Emotion and Adaptation, Oxford University Press, 1991.
[23] R. Hallowel, “The Relationship of Customer Satisfaction, Customer
Loyalty and Profitability: an Empirical Study,”International Journal
of Services Industry Management, 1996.
[24] E. Anderson, C. Fornell, and R. Rust, “Customer Satisfaction, Productivity, and Profitability: Differences Between Goods and Services,”Marketing Science, 1997.
[25] R. Kaplan and D. Norton, Strategy Maps: Converting Intangible Assets