The Rapid Assessment of
Student Health and Nutrition in Indonesia
Published by:
Education Sector Analytical and Capacity Development Partnership (ACDP) Agency for Research and Development (BALITBANG), Ministry of Education and Culture Building E, 19th Floor
Jl. Jendral Sudirman, Senayan, Jakarta 10270 Tel.: +62-21 5785 1100, Fax: +62-21 5785 1101 Website: www.acdp-indonesia.org
Secretariat email: secretariat@acdp-indonesia.org
Printed in April 2017
The Government of Indonesia (represented by the Ministry of Education and Culture, the Ministry of Religious Affairs and the Ministry of National Development Planning/ BAPPENAS, the Australian Agency for International Development (AusAID), the European Union (EU) and the Asian Development Bank (ADB) have established the Analytical and Capacity Development Partnership (ACDP) as a facility to promote policy dialogue and institutional and organizational reform of the education sector to underpin policy implementation and help reduce disparities in provincial and district education performance. The facility is an integral part of the Education Sector Support Program (ESSP) which consists of EU sector budget support with agreed arrangements for results-led grant disbursement, and earmarked policy and program-led AusAID sector development grant support consisting of a school infrastructure program, a nationwide district and school management development program and a program to accelerate the GOI’s accreditation of private Islamic schools. This report has been prepared with grant support provided by AusAID and the EU through ACDP.
The Consultants Who Prepared This Report Are:
Atmarita, MPH, Dr. PH
The views expressed in this publication are the sole responsibility of the authors and do not necessarily represent the views of the Government of Indonesia, the Government of Australia, the European Union or the Asian Development Bank.
The Rapid Assessment of
Student Health and Nutrition in Indonesia
EUROPEAN UNION KEMENTERIAN PENDIDIKAN
DAN KEBUDAYAAN
KEMENTERIAN AGAMA
The Rapid Assessment of
Acknowledgement
I would like to express my special appreciation and thanks to Ibu Nina Sardjunani, Mr. Subandi,
and Mrs. Suharti (Bappenas), Mr. Alan Prouty, and Mr. Basilius Bengoteku (ACDP, Ministry of
Education and Culture) for enabling me to do the rapid assessment of health and nutrition of
school-aged Indonesian children. I would also like to thank to Balitbangkes, Ministry of Health for
Table of Contents
The Rapid Assessment of Student Health and Nutrition, Indonesia ... i
Acknowledgement ... iii
Table of Contents ... iv
Acronyms and Abbreviations ... viii
Executive Summary ... ix
1. Introduction ... 1
2. Geographic and Demographic Background ... 2
3. The Child Rights and Education Profile ... 4
3.1
Birth Certificates
... 4
3.2
Education Profile
... 4
4. Conceptual Framework ... 7
5. School Aged Children Health and Nutrition ... 8
6. Discussion: Health and Nutrition Care for Indonesian Children ... 33
7. Conclusions and Recommendations ... 35
Appendix ... 36
References ... 39
List of Figures
Figure 1. Short and long term consequences of nutrition-gene-environment conditions in early life on relevant health and disease outcomes ... 7
Figure 2. Proportion of children 0-18 years having diarrhea last month gender, Riskesdas 2007
and 2013 ... 10 Figure 3. Proportion of children 0-18 years having diarrhea last month by residence, Riskesdas
2013 ... 10 Figure 4. Proportion of children 0-18 years having diarrhea last month by wealth quintiles,
Riskesdas 2013 ... 11
Figure 5. Proportion of children 0-18 years having diarrhea last month by province, Riskesdas
2007 and 2013 ... 11
Figure 6. Proportion of children 0-18 years having ARI last month by gender, Riskesdas 2007 and
2013 ... 12
Figure 7. Proportion of children 0-18 years having ARI last month by residence, Riskesdas 2013 .. 12
Figure 8. Proportion of children 0-18 years having ARI last month by wealth quintiles, Riskesdas
2013 ... 13
Figure 9. Proportion of children 0-18 years having ARI last month by province, Riskesdas 2007 and
2013 ... 14
Figure 10. Proportion of children 0-18 years ‘sick’*) last month by province, Riskesdas 2013 ... 14
Figure 11. Proportion babies with birth weight: 2010 and 2013 ... 17
Figure 12. Proportion of Low Birth Weight (<2500 gr) babies by province, Riskesdas 2010 and 2013
... 17
Figure 13. Proportion babies with birth length: Riskesdas 2013 ... 18
Figure 14. Proportion Babies with birth length <48 cm by province, Riskesdas 2013 ... 18
Figure 15. Proportion of babies with birth weight <2500 gram and birth length <48 cm by
province, Riskesdas 2013 ... 19
Figure 16. Proportion of children 12-23 months with complete basic immunization status:
Riskesdas 2007-2013 ... 20 Figure 17. Proportion of children 12-23 months with complete basic immunization by province,
Riskesdas 2007-2013 ... 20
Figure 18. Nutritional status for children 0-59 months: Riskesdas 2007-2013 ... 21
Figure 19. Nutritional status for boys and girls aged 0-59 months, Riskesdas 2007-2013 ... 22
Figure 20. Proportion of Indonesian children 0-59 months by nutritional status (composite of
weight and height): Riskesdas 2007-2013 ... 23
Figure 21. Prevalence of underweight (WFA<-2SD) for children 0-59 months by province, Riskesdas
2007-2013 ... 23
Figure 22. Prevalence of stunted (HFA<-2SD) for children 0-59 months by province, Riskesdas
2007-2013 ... 24
Figure 23. Prevalence of wasted (WFH<-2SD) for children 0-59 months by province, Riskesdas
Figure 24. Prevalence of underweight (WFA<-2SD) for children 0-59 months according to district
variation by province, Riskesdas 2013 ... 25
Figure 25. Prevalence of stunted (HFA<-2SD) for children 0-59 months according to district
variation by province, Riskesdas 2013 ... 25
Figure 26. Prevalence of wasted (WFH<-2SD) for children 0-59 months according to district
variation by province, Riskesdas 2013 ... 26
Figure 27. Proportion of children under-fives years with growth monitoring within the last 6
months, Riskesdas 2007-2013 ... 26
Figure 28. Proportion of children under-fives years with growth monitoring ≥ 4 times within the
last 6 months by province, Riskesdas 2007-2013 ... 27
Figure 29. Prevalence of stunted children 5-18 years by gender, Riskesdas 2013 ... 27
Figure 30. Prevalence of stunted children 5-18 years by gender and wealth quintiles, Riskesdas
2013 ... 28
Figure 31. Prevalence of wasted and overweight children 5-18 years by gender, Riskesdas 2013 ... 28
Figure 32. The change of mean height for Indonesian children 5-18 years compare to 2007 WHO
standards by gender, Riskesdas 2007-2013 ... 29
Figure 33. The change of mean height for Indonesian children 5-18 years compare to 2007 WHO
standards by gender and residence, Riskesdas 2013 ... 29
List of Tables
Table 1. Geography of Indonesia by Region, 2012 ... 2
Table 2. Numbers of children 0-19 years by age groups and gender: 2000-2035 ... 3
Table 3. Numbers of pre-school children 0-6 years, 2010-2012 ... 3
Table 4. Proportion of children 0-6 years with birth certificate information by gender, Susenas 2012 ... 4
Table 5. Proportion of children attending ECED programs by age groups and gender, Susenas 2012 ... 5
Table 6. Type of pre-school attended by age groups and gender, Susenas 2012 ... 5
Table 7. Proportion of School participation by age and gender, Susenas 2012 ... 6
Table 8. Proportion of pre-school children sick last month and average days of affected by age groups and gender, Susenas 2012 ... 8
Table 9. Proportion of school aged children sick last month and average days of affected by age and gender, Susenas 2012 ... 9
Table 10. Proportion of children 0-18 years ‘sick’*) last month by characteristics, Riskesdas 2013 ... 15
Table 11. Mean Nutrient intake by age and gender, Riskesdas 2010 ... 31
Table 12. Mean Nutrient intake (% to RDA) by age and gender, Riskesdas 2010 ... 31
Acronyms and Abbreviations
ARI : Acute Respiratory Infection
Bappenas : Badan Perencanaan Pembangungan Nasional
BCG : Bacillus Calmette–Guérin
BKB : Bina Keluarga Balita
BP Blood pressure
BPS : Badan Pusat Statistik
CBS Central Bureau of Statistics
CHO : Carbohydrate
DPT : Dipththeria, Pertussis, Tetanus
ECED : Early Childhood Education and Development
HB : Hepatitis B
HD Heart Disease
HFA : Height for Age
KB : Kelompok Bermain
LBW : Low Birth Weight
Balitbangkes : Badan Penelitian dan Pengembangan Kesehatan
MOH : Ministry of Health
NTT : Nusa Tenggara Timur
PAUD : Pendidikan anak usia dini Polindes : Pondok Bersalin Desa Poskesdes : Pos Kesehatan Desa
Puskesmas : Pusat Kesehatan Masyarakat Pustu : Puskesmas Pembantu
RDA : Recommended Daily Allowance
Riskesdas : Riset Kesehatan Dasar
Susenas : Survei Sosial Ekonomi Nasional
TK/BA/RA : Taman Kanak-kanak/Bustanul Athfal/Raudhatul Athfal
TPA : Tempat Penitipan Anak
UKS : Usaha Kesehatan Sekolah
UNESCO : United Nations Educational, Scientific and Cultural Organization
UNICEF : United Nations Children’s Fund
WFA : Weight for Age
WFH : Weight for Height
Executive Summary
The rapid assessment of student health and nutrition provides an overview of the current situation of Indonesian children under the age of 19 years. The number of Indonesian children age 0-19 years in 2014 totals about 91.6 million. Of this total 24 million are age 0-4 years, 23.1 million age 5-9 years, 22.4 million age 10-14 years, and 22.0 million age 15-15-9 years. The analyses presented in
this report are based on data from Riskesdas 2007, 2010, and 2013, the Population Census 2010,
and also Susenas 2012.
On average, 38.5 percent of children aged 0-6 years are sick for 3.9 days each month. Among school age children 7 to 18 years, the proportion of those who are sick starts with 28 percent for those of 7 years of age and declines to 17 percent for those who are 18 years of age. The most common of diseases affecting Indonesian children are diarrhea, acute respiratory infection, pneumonia, coughing, and pulmonary tuberculosis.
The next concern for Indonesian children is the high incidence of malnutrition, starting with malnourishment among infants. The prevalence of low birth weight babies varies across provinces from the lowest rate of 7.2 percent to the highest rate of 16.9 percent. Some 76 percent of Indonesian babies are born with normal birth length of 48 to 52 cm; however 20.2 percent are born below the standard (<48 cm). Nationally 4.3 percent babies are born with a combination of small weight (<2500 grams) and stunting (<48 cm).
The problem of malnutrition continues to the next ages, in 2013 only 36.8 percent of children
under 5 were considered normal in physical development. According to Riskesdas 2013, the
highest prevalence of types of malnutrition was stunting which amounted to 37.2 percent while 19.6 percent were classified as underweight, 12.1 percent wasting, and 11.9 percent overweight.
Data from Riskesdas 2013 indicates that many Indonesian children chronically fail to grow normally
starting from birth until they reach the age of 18 years. The mean height differences of Indonesian children compared to the 2007 WHO standards were 12.5 cm for boys and 9.8 cm for girls by the time they reach the age of 18 years. Stunting reflects chronic malnutrition among children and could be related to poverty as large differences between the poorest and richest quintiles in terms of the magnitude of stunting are found. Among the poorest the prevalence of stunting is almost two times higher than among the richest.
The direct cause of malnutrition is associated with both unbalanced and insufficient food intake. In addition, infection and malnutrition have been always associated with malnutrition, and the high incidence of stunting in Indonesia could be because of hunger combined with infectious diseases. This situtation is worsened when immunization does not cover all children while growth monitoring is not always carried out.
With all the problems facing Indonesian children, school health and nutrition initiatives become
very important investments that can be implemented through the Usaha Kesehatan Sekolah (UKS).
1.
Introduction
The rapid assessment of student health and nutrition provides an overview of the current situation of Indonesian children under the age of 19. The analyses presented in this report are based on existing data which have been used to identify factors which impact on child development. This analysis is a pre-requisite for further progress on the sectors involved in the Indonesian development agenda during the post MDGs period.
Progress in achieving future development goals depends on progress in improving the health and nutrition of Indonesian children. The current problem of stunting among Indonesian children is critical and requires serious attention otherwise the risk of morbidity and mortality as well as other consequences for child development will not be resolved.
WHO estimates that malnutrition directly and indirectly contributes to up to 45 percent of all child deaths, making children more vulnerable to severe diseases (WHO, 2013). In addition to contributing to child morbidity and mortality, stunting also carries significant adverse consequences for income poverty. Several studies have estimated that a one percent reduction in stunting is associated with a 1.4 percent increase in wages (World Bank, 2006). Moreover, malnutrition is also affecting development in terms of education and productivity. Stunted children usually are also anaemic which inhibits cognitive development, undermining school performance and long-term human productivity.
The objective of this rapid assessment is to advocate for greater attention to be committed by policy makers and involved sectors to address these serious health and nutrition issues of Indonesian children. This article provides an analysis of the magnitude and causes of child health and nutrition problems as well as recommendations for future interventions.
The analyses use existing data sourced from Riskesdas 2007, 2010 and 2013, Population Census
2.
Geographic and Demographic
Background
Indonesia is the largest archipelagic nation in the world, consisting of approximately 17,500 islands. There are five major islands: Sumatra, Java, Kalimantan, Sulawesi and Papua and also two
larger groups of islands which are Nusa Tenggara and the Moluccas. Table 1 shows the geography
of the seven major regions in Indonesia. Administratively up to December 2012, Indonesia consisted of 34 provinces, 410 districts, and 98 municipalities. About 80 percent of Indonesia’s territory is covered with water and the total land area is 1,910,716 square kilometers (Wikipedia,
2014).
Table 1. Geography of Indonesia by Region, 2012
Region Number of Area (Square Km) %
Districts Municipalities Min Max Sum
Sumatera 119 34 23 18,359 480,732 25.2
Jawa 85 34 10 5,782 129,383 6.8
Kalimantan 47 9 72 42,620 544,130 28.5
Sulawesi 65 11 68 13,041 188,487 9.9
Papua 40 2 537 44,071 416,047 21.8
Nusa Tenggara 37 4 26 7,000 73,051 3.8
Maluku 17 4 111 8,152 78,886 4.1
Indonesia 410 98 10 44,071 1,910,716 100.0
Based on the 2010 census conducted by the Central Bureau of Statistics (CBS), the Indonesian population was estimated to be 238.518 million people, making Indonesia the world’s fourth most populous country. Based on population projections, the total population will reach 305.652 million in 2035. Around 57 per cent of the population live on the island of Java, which is only 6.8 per cent
of the country’s total land area (BPS, 2013).
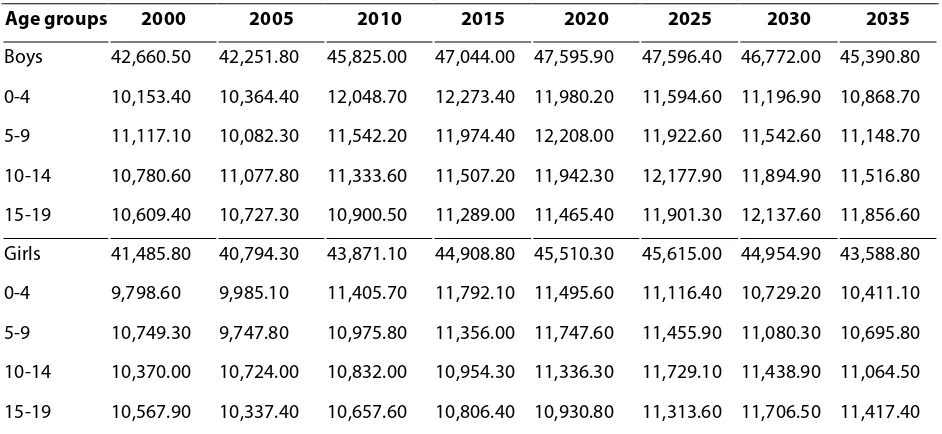
The number of children 0-19 years of age was almost 90 million in 2010, and this number is
projected to decline to 89 million by 2035. Table 2 presents the trend for boys and girls by age
groups from the year 2000 and the projections to the year 2035 (BPS, 2005; BPS 2013). Population
distribution by age group, gender, and province in 2014 is presented in Appendix - Table A1.
Table 2. Numbers of children 0-19 years by age groups and gender: 2000-2035
Age groups 2000 2005 2010 2015 2020 2025 2030 2035
Boys 42,660.50 42,251.80 45,825.00 47,044.00 47,595.90 47,596.40 46,772.00 45,390.80 0-4 10,153.40 10,364.40 12,048.70 12,273.40 11,980.20 11,594.60 11,196.90 10,868.70 5-9 11,117.10 10,082.30 11,542.20 11,974.40 12,208.00 11,922.60 11,542.60 11,148.70 10-14 10,780.60 11,077.80 11,333.60 11,507.20 11,942.30 12,177.90 11,894.90 11,516.80 15-19 10,609.40 10,727.30 10,900.50 11,289.00 11,465.40 11,901.30 12,137.60 11,856.60 Girls 41,485.80 40,794.30 43,871.10 44,908.80 45,510.30 45,615.00 44,954.90 43,588.80 0-4 9,798.60 9,985.10 11,405.70 11,792.10 11,495.60 11,116.40 10,729.20 10,411.10 5-9 10,749.30 9,747.80 10,975.80 11,356.00 11,747.60 11,455.90 11,080.30 10,695.80 10-14 10,370.00 10,724.00 10,832.00 10,954.30 11,336.30 11,729.10 11,438.90 11,064.50 15-19 10,567.90 10,337.40 10,657.60 10,806.40 10,930.80 11,313.60 11,706.50 11,417.40
Table 3. Numbers of pre-school children 0-6 years, 2010-2012
Age (in months)
SP 2010 Susenas 2012
Boys Girls Boys Girls
0-11 2,242,180 2,118,580 2,192,636 2,110,378 12-23 2,275,080 2,154,980 2,261,339 2,095,526 24-35 2,334,400 2,199,790 2,460,660 2,365,116 36-47 2,368,230 2,244,270 2,554,596 2,362,844 48-59 2,364,920 2,228,740 2,535,846 2,455,395 60-71 2,305,970 2,167,720 2,489,186 2,357,494 72-83 2,378,940 2,223,970 2,429,892 2,238,949
Total 16,269,720 15,338,050 16,924,155 15,985,702
3.
The Child Rights and Education Profile
3.1
Birth Certificates
Birth registration is an important measure for child protection. In Indonesia, a birth certificate is the first certificatory identification made in regards to the child’s civil and legal status. Every parent is required to register and to certify birth of their babies to the authorized Indonesian civil institution within the first sixty days of the birth of their child. Birth certificates help the government to track the country’s demographic statistics, health trends and differentials. Birth certificates also support the availability of information for more accurate planning and implementation of development policies and programs, particularly in the fields of health, education, and employment. (UNICEF, 2014)
In Indonesia, birth registration is not sufficiently prioritized by the government. From the Susenas
2012 (see Table 4), only approximately 50 percent boys and girls age 0-6 years have birth
certificates, and about 17 percent report they have but are unable to show it. (The proportions of
children 0-6 years with birth certificates by gender and province is presented in Appendix - Table
A2).
Table 4. Proportion of children 0-6 years with birth certificate information by gender, Susenas 2012
Age (in months)
Boys Girls
Yes, able to show it
Yes, unable to
show it
Don't have
Don't know
Yes, able to show it
Yes, unable to
show it
Don't have
Don't know
0-11 38.1 14.1 47.3 0.6 39.0 13.9 46.4 0.7
12-23 50.1 15.8 33.7 0.4 48.6 15.8 35.1 0.6
24-35 48.9 17.8 32.6 0.7 51.1 16.5 31.7 0.6
36-47 51.8 16.6 31.1 0.5 52.0 17.5 29.8 0.7
48-59 53.0 17.9 28.5 0.5 52.1 17.6 29.7 0.6
60-71 54.4 18.0 27.0 0.6 54.5 18.0 27.0 0.6
72-83 55.0 18.7 25.8 0.5 55.3 18.4 25.9 0.4
Total 50.4 17.1 32.0 0.5 50.5 16.9 32.0 0.6
3.2
Education Profile
that are used for ECED for children 0 to 6 years are Playgroups (KB), Day Care (TPA), official
kindergarten (TK/BA/RA), Integrated Pos PAUD with BKB and/or Posyandu, Private Pos PAUD (Table
6). From Susenas, the quality of services cannot be evaluated, such as: (i) the setting of child
development in Indonesia, (ii) how is an Indonesian child able to do and by what age, (iii) how many children enrolled in these services have better development outcomes (cognitive indicators).
Table 5. Proportion of children attending ECED programs by age groups and gender, Susenas 2012
Age (in months)
Boys Girls
Yes, not anymore
Yes, currently
enrolled
No Yes, not anymore
Yes, currently
enrolled
No
0-11 0.2 0.2 99.6 0.3 0.2 99.5
12-23 0.3 0.7 99.0 0.3 0.5 99.2
24-35 0.7 1.9 97.4 0.7 2.6 96.7
36-47 2.1 9.0 88.8 2.6 10.4 87.0
48-59 5.3 24.8 69.9 5.4 27.6 67.0
60-71 11.0 44.7 44.3 12.2 46.4 41.4
72-83 30.8 25.1 44.1 33.4 24.3 42.3
Total 7.3 15.7 77.0 7.9 16.5 75.6
Table 6. Type of pre-school attended by age groups and gender, Susenas 2012
Age (in months)
Boys Girls
TK/BA/ RA
Play Group
(KB)
TPA Pos PAUD*) Other Type of PAUD**) TK/BA/R A Play Group (KB)
TPA Pos PAUD*)
Other Type of PAUD**)
0-11 0.0 0.0 7.3 0.4 0.3 0.0 0.0 14.0 0.3 0.5
12-23 0.0 10.5 8.3 0.9 0.9 0.0 4.9 7.5 0.7 0.8
24-35 0.0 11.6 10.6 4.9 4.6 0.0 18.1 20.9 6.4 3.5
36-47 1.6 34.6 10.0 21.3 19.3 2.0 30.1 9.8 21.6 19.5
48-59 13.7 43.3 15.0 36.4 32.1 14.5 46.9 12.5 35.7 33.8
60-71 41.5 0.0 25.9 20.9 26.0 41.9 0.0 21.6 22.6 23.4
72-83 43.2 0.0 22.8 15.3 16.8 41.6 0.0 13.7 12.7 18.5
*) Integrated PAUD with BKB and Posyandu **) Private PAUD
There is an overlap in the data from Susenas 2012 on children aged 5 and 6 years attending school.
Table 7. Proportion of School participation by age and gender, Susenas 2012
Age (in years)
Boys Girls
Never/have not attended
school
Currently attended school
Not attending school anymore
Never/have not attended
school
Currently attended school
Not attending school anymore
5 95.9 4.1 0.0 94.5 5.5 0.0
6 51.5 48.5 0.0 48.1 51.9 0.0
7 4.4 95.3 0.3 3.4 96.4 0.1
8 1.1 98.7 0.2 1.0 98.8 0.2
9 1.0 98.7 0.3 0.7 99.0 0.3
10 0.8 98.8 0.4 0.8 98.9 0.3
11 0.6 98.4 1.0 0.6 98.7 0.7
12 0.6 96.8 2.6 0.7 97.2 2.2
13 0.8 94.2 5.1 0.8 95.6 3.6
14 0.8 89.2 10.1 0.7 92.0 7.3
15 0.8 82.2 17.0 0.8 84.5 14.6
16 0.7 78.0 21.3 0.6 80.7 18.7
17 0.9 63.2 35.9 0.9 63.3 35.8
18 0.9 38.6 60.5 0.9 37.0 62.0
4.
Conceptual Framework
Optimum fetal and child growth and development is influenced by several factors related to behavior, diet, and health. The importance of nutrition during pregnancy and early infancy in defining short-term health and survival has been well known. Barker’s hypothesis provides evidence that early nutrition has significant effects on later health and well-being. (Barker, 1998).
Barker’s hypothesis provides that….’The fetal origins of adult disease (FOAD) hypothesis is risk factors
from intrauterine environmental exposures affect the fetus’s development during sensitive periods, and increases the risk of specific diseases in adult life….’
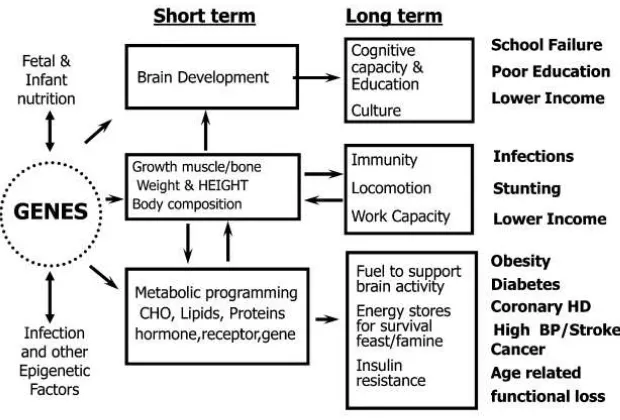
Figure 1 shows the short term and long term consequences of nutrition-gene-environment conditions in early life on relevant health and disease outcomes. In the short term, malnutrition has significant health consequences, increasing both mortality and morbidity, particularly due to infectious diseases such as diarrhea, measles, pneumonia, and malaria. In the long term, malnutrition has been associated with lower school performance, poorer attention in class, greater grade repetition, higher drop out of school, and lower graduation rates. Long-term consequences of malnutrition have been documented in terms of non-communicable diseases, such as obesity, diabetes, coronary heart disease, etc., lower earnings and family income, which affect men and women.
Figure 1. Short and long term consequences of nutrition-gene-environment conditions in early life on relevant health and disease outcomes
Source:Ricardo Uauy, et.al, 2011
This paradigm is true for Indonesia where all evidence demonstrates the double burden of nutrition related diseases, such as acute malnutrition coexisting with obesity and other chronic diseases (hypertension, diabetes, cancer, etc.).
5.
School Aged Children Health and
Nutrition
Indonesian children are very vulnerable, they are unhealthy and malnourished. Susenas 2012
provides information about whether in the last month complaints about fever, coughing, runny nose, asthma, diarrhea, recurrent headache, toothache, or others have affected daily life. The analysis puts those complaints together and labels them as ‘sick’ and also counts the average days
affected per month. The results are presented in Table 8 for pre-school aged children 0-6 years,
and Table 9 for school aged children 7-18 years of age.
Table 8. Proportion of pre-school children sick last month and average days of affected by age groups and gender, Susenas 2012
Age (in months)
Health complaints last month Average days sick Boys Girls Boys + girls
0-11 38.5 35.7 37.1 4.2
12-23 49.0 49.6 49.3 4.1
24-35 43.9 44.0 44.0 4.0
36-47 39.3 38.8 39.0 3.8
48-59 37.1 36.4 36.8 3.8
60-71 33.5 33.2 33.4 3.8
72-83 30.8 30.6 30.7 3.6
Total 38.7 38.2 38.5 3.9
On average, 38.5 percent of children 0-6 years old are sick for 3.9 days each month. Almost one half of children aged 12 to 23 months are sick for 4.2 days each month. The proportion of health complaints and the average days during which they are affected are decreased for older children. There is no significance difference by gender.
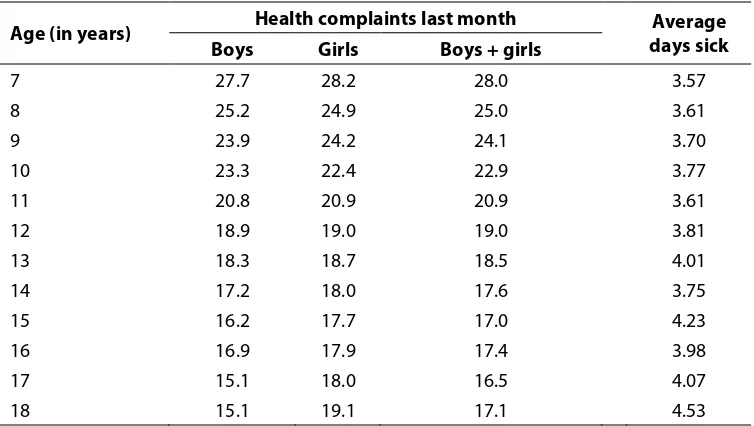
Table 9. Proportion of school aged children sick last month and average days of affected by age
and gender, Susenas 2012
Age (in years) Health complaints last month Average days sick Boys Girls Boys + girls
7 27.7 28.2 28.0 3.57
8 25.2 24.9 25.0 3.61
9 23.9 24.2 24.1 3.70
10 23.3 22.4 22.9 3.77
11 20.8 20.9 20.9 3.61
12 18.9 19.0 19.0 3.81
13 18.3 18.7 18.5 4.01
14 17.2 18.0 17.6 3.75
15 16.2 17.7 17.0 4.23
16 16.9 17.9 17.4 3.98
17 15.1 18.0 16.5 4.07
18 15.1 19.1 17.1 4.53
The trend in the health condition of children aged 0-18 years can be evaluated using data from
Riskesdas 2007, and 2013. The analysis is limited to the common communicable diseases, such as diarrhea, acute respiratory infection (ARI), pneumonia, coughing, and pulmonary tuberculosis. The
question about health condition in Riskesdas was asked by surveyors who are health staff,
including nurses, midwifes, or nutritionists. To classify the proportion of diseases, respondents were asked whether they are suffering for certain disease during the past one month or past two weeks or the past year identified by health personnel (MOH 2008, 2010, 2013).
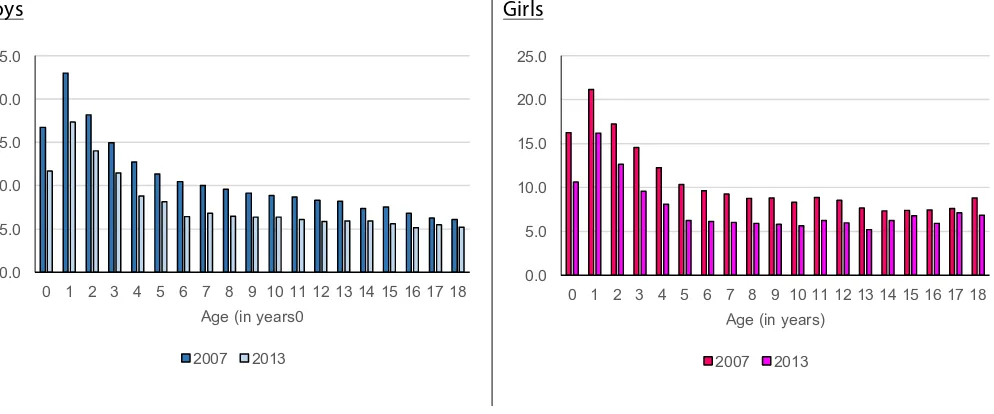
Diarrhea prevalence was determined by asking whether respondents have been diagnosed to
have diarrhea by health personnel in the past one month. Figure 2 presents the trend for diarrhea
from 2007 and 2013 for children 0 to 18 years by gender. The proportion of diarrhea was lower in 2013 as compared to 2007. The proportion reporting diarrhea for children 0-18 years varies with age, starting with a higher proportion for younger children and declining for older children, there are not significantly differences between boys and girls. In general, the incidence of diarrhea is
Figure 2. Proportion of children 0-18 years having diarrhea last month gender, Riskesdas 2007 and 2013
Boys Girls
Figure 3. Proportion of children 0-18 years having diarrhea last month by residence, Riskesdas 2013
Figure 4 and Figure 5 present the proportion of diarrhea by wealth quintiles and also by provinces. The occurrence of diarrhea is 1.7 times greater for children who are in lowest quintile compared to children in highest quintile (10.4 percent and 6.1 percent, respectively). For some age groups, such as for ages 5, 7, 8, 9, 10, 11, and 13 years, the occurrence of diarrhea is more than 2 times for children who are in lowest quintile as compared to those in the highest quintile.
0.0 5.0 10.0 15.0 20.0 25.0
0 1 2 3 4 5 6 7 8 9 10 11 12 13 14 15 16 17 18
Age (in years0
2007 2013
0.0 5.0 10.0 15.0 20.0 25.0
0 1 2 3 4 5 6 7 8 9 10 11 12 13 14 15 16 17 18
Age (in years)
2007 2013
0.0 4.0 8.0 12.0 16.0 20.0
0 1 2 3 4 5 6 7 8 9 10 11 12 13 14 15 16 17 18
Age (in years)
Figure 4. Proportion of children 0-18 years having diarrhea last month by wealth quintiles, Riskesdas 2013
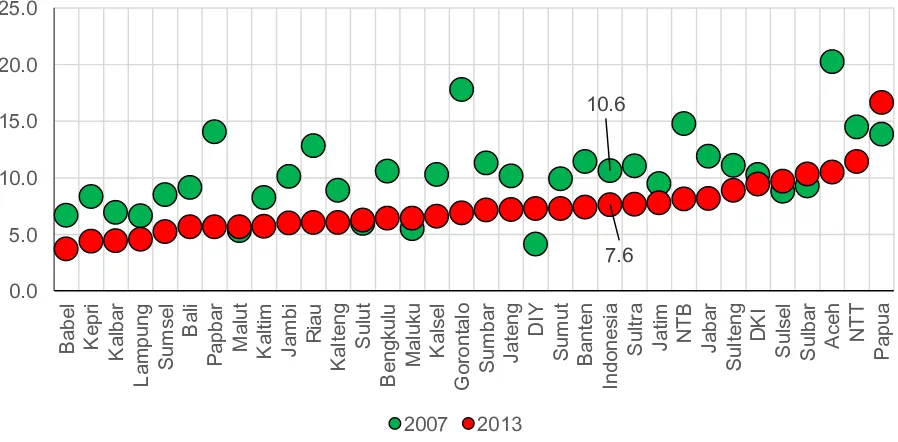
Figure 5. Proportion of children 0-18 years having diarrhea last month by province, Riskesdas 2007
and 2013
By province, the occurrence of diarrhea among children 0-18 years declined from 2007 to 2013 (10.6% to 7.6% respectively). There are some provinces, such as DI Yogyakarta, Maluku Utara, Sulawesi Utara, Sulawesi Selatan, and Sulawesi Barat, where the incidence of diarrhea is increasing, while in two provinces the incidences have declined very significantly (Gorontalo and Aceh). The second common communicable disease for children is acute respiratory infections (ARIs).
Riskesdas has not classified ARIs into upper or lower tract infections. Respondents were asked whether they have ever been diagnosed by health personnel to have ARIs in the last one month. Figure 6, 7, 8 and 9 present the prevalence of ARIs among children 0-18 years old by gender, residence, wealth quintiles, and provinces.
0.0 5.0 10.0 15.0 20.0 25.0
0 1 2 3 4 5 6 7 8 9 10 11 12 13 14 15 16 17 18
Age (in years)
Figure 6 presents the trend for ARIs from 2007 and 2013 for children 0 to 18 years of age by gender. In general, the proportion of children having ARIs had similar levels both in 2007 and in 2013 (declining slightly from 30.5% in 2007 to 29.9% in 2013). The proportion reporting ARIs for children 0-18 years of age varies with age, starting with a higher proportion for younger children and declining for older one, the proportions are slightly higher among girls. The highest prevalence occurred among children aged one year old (almost 45%). And the prevalence of ARIs
is similar for both children whether they live in rural or urban areas (Figure 7).
Figure 6. Proportion of children 0-18 years having ARI last month by gender, Riskesdas 2007 and
2013
Boys Girls
Figure 7. Proportion of children 0-18 years having ARI last month by residence, Riskesdas 2013
0.0 5.0 10.0 15.0 20.0 25.0 30.0 35.0 40.0 45.0 50.0
0 2 4 6 8 10 12 14 16 18
2007 2013
0.0 5.0 10.0 15.0 20.0 25.0 30.0 35.0 40.0 45.0 50.0
0 1 2 3 4 5 6 7 8 9 101112131415161718
2007 2013
Figure 8 and Figure 9 presented the proportions of ARIs by wealth quintiles and also by provinces. The occurrence of ARIs is 6.1 percent higher among children who are in the lowest quintile as compared to children in the highest quintile (32.4 percent and 26.3 percent, respectively). By province, the occurrence of ARIs among children 0-18 years of age declined slightly (only a 0.6 percent reduction) from 2007 to 2013. There are some provinces, such as Jawa Timur, Sulawesi Utara, Sulawesi Barat and Papua, where the occurrence of ARIs is increasing, while in some provinces it has declined very significantly: Bengkulu, Bangka Belitung, Kep. Riau, Gorontalo, Maluku Utara, and Papua Barat.
Riskesdas provides rather complete information about communicable diseases, including information on the incidence of communicable diseases among Indonesian children. To understand what level, the assessment tried to make a composite profile of the most common communicable diseases of Indonesian children, such as diarrhea, ARIs, pneumonia, coughing and pulmonary tuberculosis. All respondents were asked whether they have ever been diagnosed by health personnel to have to have these illnesses in the last month.
Figure 8. Proportion of children 0-18 years having ARI last month by wealth quintiles, Riskesdas
2013
0.0 10.0 20.0 30.0 40.0 50.0
0 1 2 3 4 5 6 7 8 9 10 11 12 13 14 15 16 17 18
Age (in years)
Figure 9. Proportion of children 0-18 years having ARI last month by province, Riskesdas 2007 and 2013
Figure 10 presents the results concerning the proportion of Indonesian children who were sick during the past one month. Nationally, about 38.4 percent of children aged 0-18 years were detected as being sick. The prevalence ranged from the lowest of 27 percent in Riau to the highest of 54.1 percent in NTT. There are 11 out of 33 provinces that have prevalences above the national average, and most of them are provinces in Java with large populations including: Jawa Timur, Jawa Tengah, DKI, Banten and DI Yogyakarta.
Figure 10. Proportion of children 0-18 years ‘sick’*) last month by province, Riskesdas 2013
*) Composite of ARI, Diarrhea, Pneumonia, coughing, pulmonary tuberculosis
àlast month ever suffered and
30.5 29.9 0.0 10.0 20.0 30.0 40.0 50.0 Ma lu t Ka lb a r Ja m b i Ria u Su m u t Lam pung S u m se l Su lb a r B e n g ku lu Su lt ra Go ro n ta lo Ke p ri Su lt e n g Ba li M a lu ku S u lse l Su lu t Ka lt im Ja b a r Su m b a r Ka lt e n g Pa p b a r NT B In d o n e si a Ba b e l Ba n te n Ja te n g DK I K a lse l DI Y A ce h Pa p u a Ja ti m NT T 2007 2013 27.0 38.4 54.1 0.0 10.0 20.0 30.0 40.0 50.0 60.0 Ria u Lam
pung Jam
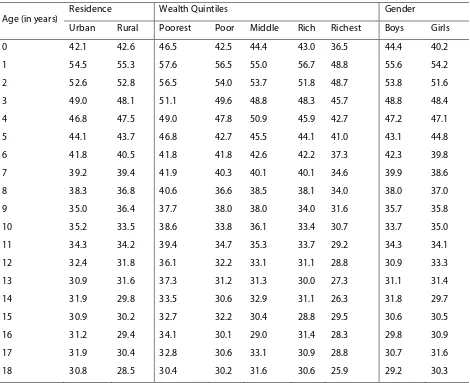
who are living in rural areas. There are differences in prevalence for children in the lowest consumption quintile who are likely to have higher incidences as compared to those in the highest quintile of consumption. The difference varied from the lowest (3.2%) to the highest (10.2%).
Table 10. Proportion of children 0-18 years ‘sick’*) last month by characteristics, Riskesdas 2013
Age (in years) Residence Wealth Quintiles Gender
Urban Rural Poorest Poor Middle Rich Richest Boys Girls
0 42.1 42.6 46.5 42.5 44.4 43.0 36.5 44.4 40.2
1 54.5 55.3 57.6 56.5 55.0 56.7 48.8 55.6 54.2
2 52.6 52.8 56.5 54.0 53.7 51.8 48.7 53.8 51.6
3 49.0 48.1 51.1 49.6 48.8 48.3 45.7 48.8 48.4
4 46.8 47.5 49.0 47.8 50.9 45.9 42.7 47.2 47.1
5 44.1 43.7 46.8 42.7 45.5 44.1 41.0 43.1 44.8
6 41.8 40.5 41.8 41.8 42.6 42.2 37.3 42.3 39.8
7 39.2 39.4 41.9 40.3 40.1 40.1 34.6 39.9 38.6
8 38.3 36.8 40.6 36.6 38.5 38.1 34.0 38.0 37.0
9 35.0 36.4 37.7 38.0 38.0 34.0 31.6 35.7 35.8
10 35.2 33.5 38.6 33.8 36.1 33.4 30.7 33.7 35.0
11 34.3 34.2 39.4 34.7 35.3 33.7 29.2 34.3 34.1
12 32.4 31.8 36.1 32.2 33.1 31.1 28.8 30.9 33.3
13 30.9 31.6 37.3 31.2 31.3 30.0 27.3 31.1 31.4
14 31.9 29.8 33.5 30.6 32.9 31.1 26.3 31.8 29.7
15 30.9 30.2 32.7 32.2 30.4 28.8 29.5 30.6 30.5
16 31.2 29.4 34.1 30.1 29.0 31.4 28.3 29.8 30.9
17 31.9 30.4 32.8 30.6 33.1 30.9 28.8 30.7 31.6
18 30.8 28.5 30.4 30.2 31.6 30.6 25.9 29.2 30.3
*) Composite of ARI, Diarrhea, Pneumonia, coughing, pulmonary tuberculosis
àlast month ever suffered and diagnosed by health personnel from ARI, diarrhea, pneumonia, coughing, pulmonary tuberculosis
Box 1. Definition of Terms
Low birth weight (LBW) is defined as a birth weight of live born infant of less than 2,500 grams regardless of gestational age.
Stunting refers to chronic malnutrition and is defined by an abnormally low height relative to a group of children of the same age and sex who have grown up under conditions that do not restrict growth. Stunted growth is a primary manifestation of malnutrition during fetal development brought on by the malnourished mother. Stunting provides a cumulative record of past and present growth restrictions affecting a child’s length; it is commonly due to inadequate nutrition compounded with frequent infections, such as diarrhea, pneumonia, etc. The classification is based on height for age (HFA) as % of median reference value with the cut off points less than – 2 Z-score.
Wasting is sometimes referred to as acute malnutrition because it is believed that episodes of wasting have a short duration. Wasting can be caused by an extremely low energy intake, nutrient losses due to infection. The classification is based on weight for height (WFH) as % of median reference value with the cut off points less than – 2 Z-score.
Underweight is a term describing a human whose body weight is considered too low to be healthy. The classification is based on weight for age (WFA) as % of median reference value with the cut off points less than – 2 Z-score.
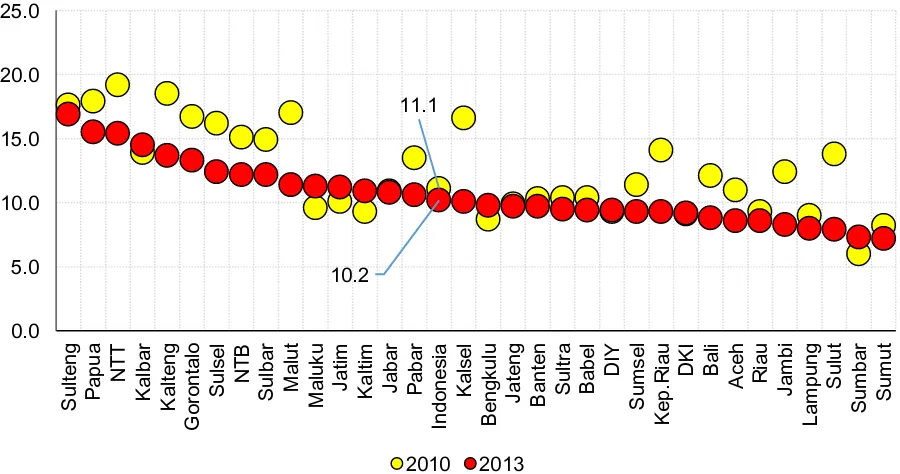
Riskesdas collects information on children under five who have a written health record or the mother’s recall. The assessment here was based on children under five who have a health card. Figure 11 shows the proportion of babies based on their size at birth for the years 2010 and 2013. The prevalence for LBW was slightly declined from 11.1 percent in 2007 to 10.2 percent in 2013. More babies at a normal weight (85 percent), and 4.8 percent babies with birth weight over 4000 grams.
The prevalence of LBW is varied from the lowest 7.2 percent in Sumatera Utara to the highest 16.9 percent in Sulawesi Tengah. There are 18 out of 33 provinces that have prevalence below the national average. There are some provinces, such as NTT, Kalimantan Tengah, Kalimantan Selatan, Sumatera Selatan, Kepulauan Riau, Sulawesi Utara, and Maluku Utara where the prevalence of LBW is decreasing very significantly, while some provinces stay the same, even increased, such as
Figure 11. Proportion babies with birth weight: 2010 and 2013
Figure 12. Proportion of Low Birth Weight (<2500 gr) babies by province, Riskesdas 2010 and 2013
Figure 13 shows that 76.4 percent of Indonesian babies were born with a normal birth length of 48 to 52 centimeters, however 20.2 percent were born below the standard (<48 cm), and 3.3 percent born with birth length >52 cm. The variation of prevalences among provinces of babies
born with birth length below standard is very wide (Figure 14) from the highest (NTT) 28.7% to
the lowest (Bali) 9.6%. 11.1% 82.5% 6.4% 10.2% 85.0% 4.8% 0.0% 20.0% 40.0% 60.0% 80.0% 100.0%
<= 2.500 gr >2500 - 3999 gr > 4.000 gr
Figure 13. Proportion babies with birth length: Riskesdas 2013
Figure 14. Proportion Babies with birth length <48 cm by province, Riskesdas 2013
Figure 15 presents the proportion of babies born with birth weight <2500 grams and birth length <48 cm by province. Nationally, 4.3 percent of babies are born with combination of small size and stunting. There are 14 provinces above the national average with the highest proportion of 7.6 percent (Papua), and Maluku has the lowest prevalence (<1%).
20.2 76.4 3.3 0.0 20.0 40.0 60.0 80.0 100.0
<48 cm 48 - 52 cm > 52 cm
Figure 15. Proportion of babies with birth weight <2500 gram and birth length <48 cm by
province, Riskesdas 2013
The occurrence of infection by various diseases can be prevented by universal immunization of children, the six vaccines for preventable diseases include tuberculosis, diphtheria, whooping cough, tetanus, polio, and measles are crucial in reducing infant and child mortality. According to WHO guidelines, children are considered fully immunized when they have received one dose of the vaccine against tuberculosis (BCG), three doses each of the DPT and polio vaccines, one dose of measles, and four doses of the hepatitis B (HB) vaccine.
Riskesdas 2007, 2010, and 2013 collected information on immunization coverage for children under-five from the child’s health card or the maternal and child health book. The enumerator copied the immunization dates directly into the questionnaires. The analysis of immunization coverage is based on children age 12-23 months who had completed BCG, 3 doses DPT and polio, measles, four doses of HB. This age group was selected because they are the youngest cohort of children who have reached the age by which they should be fully immunized.
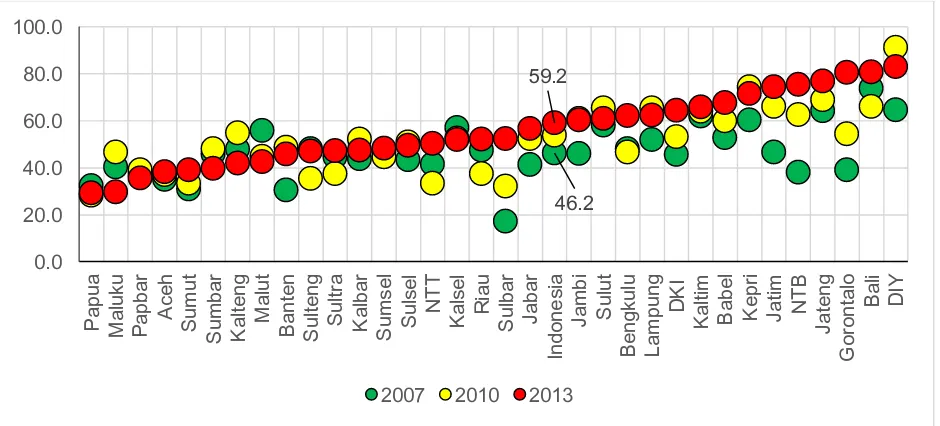
Figure 16 presents the trend in the proportion of children 12-23 months of age who are fully immunized. Nationally, it has increased from 2007 to 2013 from 41.6 percent to 59.2 percent, however there are still 8.7 percent children who have never been immunized. By province, the range was quite wide from the lowest 29.2 percent in Papua to the highest 83.1 percent in DI Yogyakarta. However, almost all provinces show the tendency of increasing coverage of basic complete immunization from 2007 to 2013, except Maluku, Maluku Utara, Kalimantan Tengah,
Sumatera Barat (Figure 17).
0.8 4.3 7.6 0.0 2.0 4.0 6.0 8.0 10.0 M a lu ku B e n g ku lu A ce h Su lt ra K a lse l Su m b a r Go ro n ta lo Ma lu t Pa b a r Ka lt e n g Ria u Ja m b i Su lu t Ke p .R ia u Ba li Lam
pung Jab
Figure 16. Proportion of children 12-23 months with complete basic immunization status: Riskesdas 2007-2013
Figure 17. Proportion of children 12-23 months with complete basic immunization by province, Riskesdas 2007-2013
After birth weight and immunization, the next issue is malnourishment in Indonesia which is affecting more than 50 percent of children 0-18 years of age. The highest prevalence is stunting, or chronic malnutrition, measured as height for age (HFA), which occurs when a child fails to grow to
be the expected height or length compared to a healthy child of the same age. The latest Riskesdas
(2013) reported that almost four out of ten children under 5 were stunted (37.2%). The second problem is underweight, measured as weight for age (WFA), and is considered as both acute and chronic malnutrition. The prevalence of underweight for children under 5 was 19.6 percent. The third issue is wasting versus overweight, measured as weight for height (WFH). Wasting (<-2 SD
41.6 49.2 9.1 53.8 33.5 12.7 59.2 32.1 8.7 0.0 10.0 20.0 30.0 40.0 50.0 60.0 70.0
Complete Not complete Never
2007 2010 2013
46.2 59.2 0.0 20.0 40.0 60.0 80.0 100.0 Pa p u a M a lu ku Pa p b a r A ce h Su m u t Su m b a r Ka lt e n g Ma lu t Ba n te n Su lt e n g Su lt ra Ka lb a r S u m se l S u lse l NT T K a lse l Ria u Su lb a r Ja b a r In d o n e si a Ja m b i Su lu t B e n g ku lu Lam pung DK I Ka lt im Ba b e l Ke p ri Ja ti m NT B Ja te n g Go ro n ta lo Ba li DI Y
Figure 18. Nutritional status for children 0-59 months: Riskesdas 2007-2013
As explained in the previous paragraphs about low birth weight and length of birth below standard, actually malnutrition starts before birth for children in Indonesia. Starting with 20.2
percent stunted when they are born (Figure 13), and continue classified as stunted for age 0-5
months, up to 48-59 months. Figure 19 shows the nutritional status (underweight, stunted,
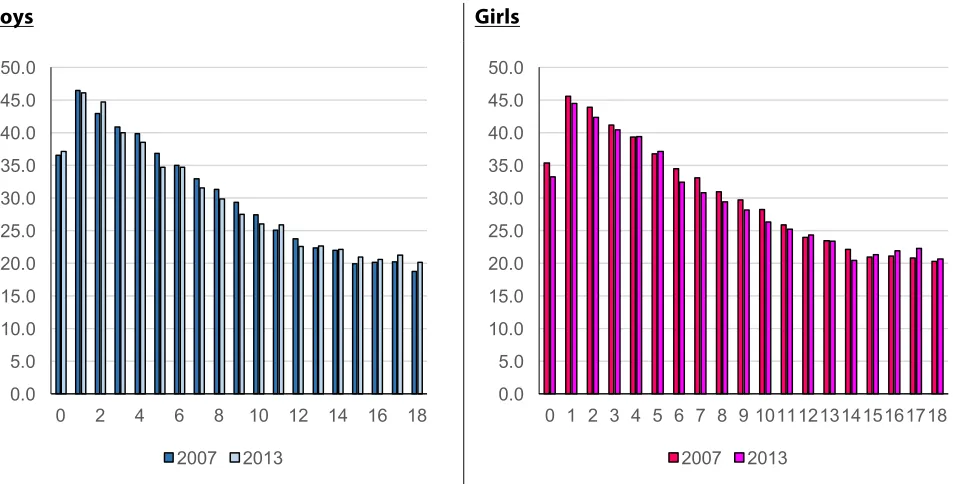
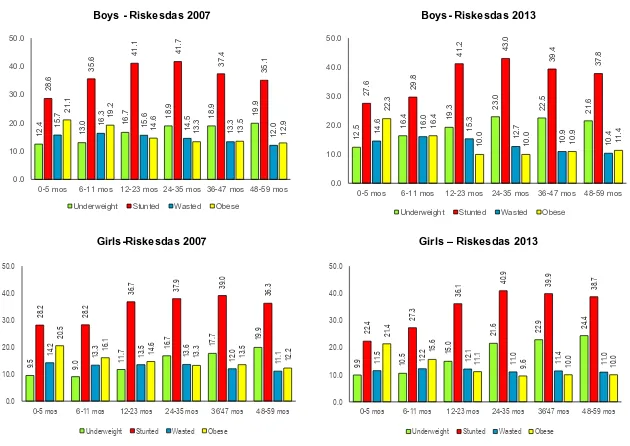
wasted, and overweight/obese) for children 0-59 months by gender for the years 2007 and 2013. Children after 2 years of age tend to regain weight, as evidenced by decreased rates of wasting for older children. The highest prevalence of wasting among children 1 to 2 years may be associated with infection rates that are likely high (see previous figures for diarrhea and ARI), and could be partly attributable to poor feeding practices and increasing the risk of infection. The prevalence of stunting for both boys and girls is increased by age and peak at 24-35 months (about 40%). However, boys were more likely to be stunted than girls for almost all ages (0-5 months to 36-47 months).
Overall, as mentioned before, and also presented in Figure 20, only 48.6 percent of Indonesian
children are classified as normal for the year 2013. It was increased from 45.9 percent in the year 2007 to 49.1 percent in 2010, but declined in year 2013. It was increasing stunted-wasted from 2.1 percent (2010) to 2.5 percent (2013), as well as obese children from 3.9 percent (2007) to 5.1 percent (2013).
The prevalence of underweight, stunting, and wasting among children under 5 varies significantly
by province. The distribution and trends from 2007-2013 can be seen in Figures 21, 22, and 23.
The prevalence of underweight is increasing from 18.4 percent in 2007 to 19.6 percent in 2013. It varies from the lowest in Bali (13.2%) to the highest in NTT (33.1%). The tendency of increasing prevalence is occurred almost for all provinces, except Kalimantan Tengah, NTB, Kalimantan Timur, and Bangka Belitung. The same situation for stunting, nationally the prevalence was 36.8 percent (2007) declined to 35.6 percent (2010), but increased again to 37.2 percent (2013). The prevalence of stunting was highest in NTT (51.7%), even though it declined from 58.4 percent in 2010. The lowest one was in Kepulauan Riau (26.3%), and seems to stay the same at that level from 2007, as well as 2010. And there were only 13 provinces where the prevalence of stunting was below the national level.
The only declining trend was found in the prevalence of wasting, from 13.6 percent (2007) to 12.1 percent (2013). This declining prevalence of wasting is assumed to result from food supplementation that has distributed among the poor during the period of 2007 to 2013. However, as usual the large difference in wasting among provinces also occurred from the lowest 8.8 percent in Bali to the highest 18.7 percent in Kalimantan Barat. In general, it showed declining prevalence of wasting in almost all provinces.
5.4 13.0 18.8 18.0 6.2 7.4 12.2 4.9 13.0 18.5 17.1 6.0 7.3 14.0 5.7 13.9 18.0 19.2 5.3 6.8 11.9 0.0 5.0 10.0 15.0 20.0 25.0
<-3SD -3SD to -2SD <-3SD -3SD to -2SD <-3SD -3SD to -2SD >2SD
WFA HFA WFH WFH
Figure 19. Nutritional status for boys and girls aged 0-59 months, Riskesdas 2007-2013
Boys - Riskesdas 2007 Boys- Riskesdas 2013
Girls-Riskesdas 2007 Girls – Riskesdas 2013
12.
4
13.
0 16.
7 18.9 18.9 19.
9 28. 6 35. 6 41. 1 41. 7 37. 4 35. 1 15. 7 16. 3 15. 6 14. 5 13. 3 12. 0 21. 1 19. 2 14. 6 13. 3 13. 5 12. 9 0.0 10.0 20.0 30.0 40.0 50.0
0-5 mos 6-11 mos 12-23 mos 24-35 mos 36-47 mos 48-59 mos Underweight Stunted Wasted Obese
12. 5 16. 4 19. 3 23. 0 22. 5 21. 6 27. 6 29. 8 41. 2 43. 0 39. 4 37. 8 14. 6 16. 0 15. 3 12. 7 10. 9 10. 4 22. 3 16. 4 10. 0 10. 0 10. 9 11. 4 0.0 10.0 20.0 30.0 40.0 50.0
0-5 mos 6-11 mos 12-23 mos 24-35 mos 36-47 mos 48-59 mos Underweight Stunted Wasted Obese
7 16.
7
17.
7 19.9
28. 2 28. 2 36. 7 37. 9 39. 0 36. 3 14. 2 13. 3 13. 5 13. 6 12. 0 1 20. 5 16. 1 14. 6 13. 3 13. 5 12. 2 20.0 30.0 40.0 50.0 5 15. 0 21. 6 22. 9 24. 4 22. 4 27. 3 36. 1 40. 9 39. 9 38. 7 5 12. 2 12.
1 0 4 0
21.
4
15.
6
1 0 0
Figure 20. Proportion of Indonesian children 0-59 months by nutritional status (composite of weight and height): Riskesdas 2007-2013
Figure 21. Prevalence of underweight (WFA<-2SD) for children 0-59 months by province, Riskesdas 2007-2013 0.0 20.0 40.0 60.0 80.0 100.0
2007 2010 2013
2.3 2.1 2.5
29.1 25.3 27.4
7.4
7.6 6.8
11.4
11.1 9.6
45.9 49.1 48.6
3.9 4.8 5.1
Stunted-wasted Stunted-normal Stunted-obese
Normal-wasted Normal-normal Normal-obese
18.4 19.6 0.0 10.0 20.0 30.0 40.0 Ba li DK I Ba b e l Ke p .R ia u Ja b a r DI Y Su lu t Ka lt im Ba n te n Ja te n g S u m se l B e n g ku lu Lam
pung Jati
m In d o n e si a Ja m b i Su m b a r Pa p u a Su m u t Ria u Ka lt e n g Su lt ra Su lt e n g Ma lu t S u lse l NT B Go ro n ta lo A ce h Ka lb a r K a lse l M a lu ku Su lb a r Pa b a r NT T
Figure 22. Prevalence of stunted (HFA<-2SD) for children 0-59 months by province, Riskesdas 2007-2013
Figure 23. Prevalence of wasted (WFH<-2SD) for children 0-59 months by province, Riskesdas 2007-2013
Figures 24, 25 and 26 present the district variations in terms of prevalence of underweight, stunting, as well as wasting for children under age 5 in 2013. These figures present the disparity of malnourished prevalence for children under 5 years among districts within each province. For the prevalence of underweight as shown in Figure 24, large differences occurred in Sulawesi Barat,
36.8 37.2 0.0 10.0 20.0 30.0 40.0 50.0 60.0 70.0 Ke p .R ia u DI Y DK I Ka lt im Ba b e l Ba li Ba n te n Su lu t Ja b a r Ja ti m S u m se l Ja te n g Ria u In d o n e si a Ja m b i Ka lb a r Go ro n ta lo Su m b a r B e n g ku lu Pa p u a M a lu ku S u lse l Ma lu t Su lt e n g Ka lt e n g A ce h Su m u t Su lt ra Lam
pung Kalse
l Pa b a r NT B Su lb a r NT T
2007 2010 2013
13.6 12.1 0.0 5.0 10.0 15.0 20.0 25.0 Ba li Su lt e n g DI Y Su lu t DK I Ba b e l Su lb a r Ja b a r S u lse l Ja te n g Ja ti m Su lt ra Ka lt im Go ro n ta lo Lam pung NT B In d o n e si a Ma lu t Ke p .R ia u Ka lt e n g S u m se l Su m b a r K a lse l Ja m b i Ba n te n Pa p u a B e n g ku lu Su m u t Pa b a r NT T Ria u A ce h M a lu ku Ka lb a r
Figure 24. Prevalence of underweight (WFA<-2SD) for children 0-59 months according to district variation by province, Riskesdas 2013
Figure 25. Prevalence of stunted (HFA<-2SD) for children 0-59 months according to district variation by province, Riskesdas 2013
Figure 26. Prevalence of wasted (WFH<-2SD) for children 0-59 months according to district variation by province, Riskesdas 2013
One of the reasons why the nutritional status of children under 5 has not improved, perhaps because of declining coverage of children coming to the Posyandu for regular monitoring of their growth. Figure 27 gives the evidence about the proportion of children under 5 years with growth monitoring within the last 6 months from 2007 to 2013. More children (34.3%) have never come to Posyandu, and only 44.6 percent children have come more than 4 times at the last 6 months. Monthly monitoring is very important to evaluate a child’s growth, if it is deteriorating then there is still the opportunity for improvement.
Figure 28 presents the trends of growth monitoring ≥ 4 times within the last 6 months for children under 5 years of age by province from 2007 to 2013. It varies from the lowest in Sumatera Utara (only 12.5%) to the highest in DI Yogyakarta (79%). Almost all provinces showed a declining coverage, except NTB and Jawa Timur.
Figure 27. Proportion of children under-fives years with growth monitoring within the last 6 months, Riskesdas 2007-2013
45.4
29.1
25.5 49.4
26.9
23.8 44.6
21.1
34.3
Figure 28. Proportion of children under-fives years with growth monitoring ≥ 4 times within the last 6 months by province, Riskesdas 2007-2013
With all problems with children under 5, malnutrition continues to the older ages from 5 to 18 years. Figure 29 presents the prevalence of stunted children 5-18 years by gender according to Riskesdas 2013. It shows that the peak was 40.2 percent for boys age 13 years old, and 35.8 percent for girls age 11 years old. One can explain that they were born 11-13 years ago when crisis happened from their mother who gets pregnant in the years from 1998 to 2000.
Figure 29. Prevalence of stunted children 5-18 years by gender, Riskesdas 2013
As stated before that stunting is chronic malnutrition which result in a child failing to grow because of several factors that may relate to poverty. Figure 30 presents evidence that large differences in stunting occur between the poorest and the richest in terms of the magnitude of stunting. It is interesting to note that even among the richest quintile that the prevalence of stunting still exists, it could be related to nutrition knowledge and behavior.
45.4 44.6 0.0 20.0 40.0 60.0 80.0 100.0 Su m u t B e n g ku lu Pa p u a S u m se l Lam pung Ria u Ka lt e n g Ja m b i Su lt e n g Su lt ra K a lse l S u lse l Ka lb a r Pa p b a r Ke p ri A ce h Su lu t Su lb a r M a lu ku Ba n te n Ma lu t Ka lt im Ba b e l Su m b a r In d o n e si a Ba li Go ro n ta lo DK I Ja b a r NT T Ja te n g Ja ti m NT B DI Y
2007 2010 2013
29. 0 27. 7 27. 6 28.
1 30.8 32.
3 35.1 37. 7 40.2
36.
7
35.
9
36.
5 38.9
37. 4 27. 5 25. 5 25.
1 27.8 30. 7 33.
7 35.8
34. 9 34. 1 32. 8 29. 7 26. 0 23.
3 26.2
0.0 10.0 20.0 30.0 40.0 50.0
5 6 7 8 9 10 11 12 13 14 15 16 17 18
%
Figure 30. Prevalence of stunted children 5-18 years by gender and wealth quintiles, Riskesdas 2013
Overall, the prevalence of wasting in 2013 among children 5 to 18 years is almost the same level with children under 5 years of age, it’s about 11 percent. Figure 31 shows that the peak is among children at age 11 years for girls and at age 12 years for boys. The prevalence of wasting is higher among boys than girls. As mentioned before wasting is the condition of acute malnutrition, as an effect of less daily food intake. The prevalence of wasting is higher among boys and may relate to their physical activity which is usually more active than girls.
On the other hand, overweight for children age 5 to 18 years has not been too high compared with stunting and wasting, except for age 5 to 10 years (about 10 to 11%). The prevalence of overweight children is declining for children age 11 to 18 years. The same pattern with wasting, the prevalence of overweight is more likely higher among boys than girls for age 5 to 14 years, then stays at the same level for ages 15 to 18 years.
Figure 31. Prevalence of wasted and overweight children 5-18 years by gender, Riskesdas 2013
Wasted (WFH<-2SD) Overweight (WFH>+2SD)
0.0 10.0 20.0 30.0 40.0 50.0 60.0
5 6 7 8 9 10 11 12 13 14 15 16 17 18
Age (in years)
Boys
Poorest Richest
0.0 10.0 20.0 30.0 40.0 50.0 60.0
5 6 7 8 9 10 11 12 13 14 15 16 17 18
Age (in years)
Girls
Poorest Richest
0.0 4.0 8.0 12.0 16.0 20.0
Comparing Indonesian children with the 2007 WHO standards (WHO, 2007) for mean height as presented in Figures 32 and 33, it is clear that the difference is very wide when they reach age 18 years meaning the Indonesian children chronically fail to grow which is evidence that they were born also from stunted mothers.
Figure 32. The change of mean height for Indonesian children 5-18 years compare to 2007 WHO standards by gender, Riskesdas 2007-2013
Figure 33. The change of mean height for Indonesian children 5-18 years compare to 2007 WHO standards by gender and residence, Riskesdas 2013
The mean height difference to the 2007 WHO standards in 2013 was about 12.5 cm for boys age 18 and 9.8 cm for girls at the same age. These gap differences relatively reduce compared to the 2007 mean height for the same age for boys as well as for girls, or it has improved in mean height for Indonesian children. The differences in mean height by residence as shown in Figure 33, boys who
100.0 110.0 120.0 130.0 140.0 150.0 160.0 170.0 180.0 190.0
5 6 7 8 9 10 11 12 13 14 15 16 17 18
Me a n H e ig h t (c m)
Age (in years) Boys
Reference 2007 2010 2013
100.0 110.0 120.0 130.0 140.0 150.0 160.0 170.0 180.0 190.0
5 6 7 8 9 10 11 12 13 14 15 16 17 18
Me a n H e ig h t (c m)
Age (in years) Girls
Reference 2007 2010 2013
100.0 110.0 120.0 130.0 140.0 150.0 160.0 170.0 180.0 190.0
5 6 7 8 9 10 11 12 13 14 15 16 17 18
Me a n H e ig h t (i n c m)
Age (in year) Boys
Reference Urban Rural
100.0 110.0 120.0 130.0 140.0 150.0 160.0 170.0 180.0 190.0
5 6 7 8 9 10 11 12 13 14 15 16 17 18
Me a n H e ig h t (i n c m)
Age (in year) Girls
live in urban are more likely taller 2.7 cm than boys who are live in rural area when they reach age 18 year, and for girls, the difference is 1.7 cm between urban and rural.
The intergenerational influences is one explanation for this condition. Riskesdas 2007 and 2010 show the evidence for the prevalence of stunting among women at reproductive ages 15-49 years which was about 10 percent (the mean height <145 cm) or about 30 percent (the mean height <150 cm). The condition is getting worse when the pregnancy occurs at younger ages (<20 years).
The direct cause of malnutrition is associated with food intake as a result of unbalanced, insufficient of less intake cumulatively, and also infections and malnutrition have always been associated. When children do not have enough food intake for a long time, they will become severely malnourished and associated with poor immune response to infection. Severe malnutrition, especially in young children can lead to death. Chronic malnutrition refers to lower intake of nutrients than the body needs for a long period of time. The occurrence of stunting in Indonesia could be because of hunger, combined with infectious diseases as explained in the previous section.
Table 11. Mean Nutrient intake by age and gender, Riskesdas 2010
Age (in years)
Boys Girls
Energy CHO Protein Fat Fiber Energy CHO Protein Fat Fiber Kkal (gram) (gram) (gram) (gram) Kkal (gram) (gram) (gram) (gram) 0 843.6 107.1 26.0 30.7 1.1 804.3 104.9 25.8 29.2 1.0 1 1289.2 175.4 47.7 46.1 2.7 1201.3 161.1 43.7 42.6 2.7 2 1558.3 210.9 57.8 53.9 3.6 1485.9 201.0 55.8 50.7 3.6 3 1510.7 206.7 54.9 51.3 4.1 1461.5 200.9 53.6 49.4 3.9 4 1456.5 203.9 52.9 47.8 4.4 1341.0 188.0 47.7 43.9 4.3 5 1362.0 195.2 47.6 42.8 4.6 1291.5 183.5 44.7 41.6 4.6 6 1287.8 185.3 45.3 39.9 4.8 1263.2 182.0 44.0 39.8 4.8 7 1281.3 188.0 44.4 38.7 5.1 1260.5 180.6 44.1 39.5 5.0 8 1328.9 193.7 45.2 40.7 5.3 1268.0 182.2 44.5 39.4 5.2 9 1292.5 189.6 45.8 40.0 5.3 1282.6 186.2 44.4 39.9 5.5 10 1319.5 195.0 44.5 39.4 5.6 1264.8 185.4 43.9 38.5 5.4 11 1349.9 200.3 46.5 40.2 5.7 1288.7 188.2 45.1 39.3 5.6 12 1355.4 198.9 46.8 41.6 5.9 1308.2 190.6 44.9 39.9 5.8 13 1384.1 206.7 47.0 40.0 5.9 1287.3 188.2 45.1 39.6 5.7 14 1390.5 209.7 46.4 39.7 6.1 1276.9 187.9 44.6 37.6 5.9 15 1459.7 219.9 49.5 42.3 6.6 1280.1 187.4 44.9 39.0 5.8 16 1459.5 219.8 49.3 41.7 6.5 1303.5 189.8 45.9 40.2 6.0 17 1526.6 234.1 51.0 41.9 6.8 1280.9 186.6 44.9 38.5 5.9 18 1494.6 229.2 48.9 41.5 6.4 1303.3 189.6 45.3 39.6 6.1
Table 12. Mean Nutrient intake (% to RDA) by age and gender, Riskesdas 2010
Age (in years)
Boys Girls
Energy CHO Protein Fat Fiber Energy CHO Protein Fat Fiber 0 116.4 130.6 144.4 85.4 10.6 110.9 128.0 143.4 81.1 10.4 1 114.6 113.2 183.4 104.8 17.1 106.8 103.9 168.3 96.8 16.6 2 138.5 136.1 222.5 122.4 22.2 132.1 129.7 214.7 115.1 22.2 3 134.3 133.4 211.3 116.5 25.9 129.9 129.6 206.3 112.2 24.3 4 91.0 92.7 151.1 77.1 19.8 83.8 85.4 136.3 70.8 19.6 5 85.1 88.7 136.0 69.1 20.7 80.7 83.4 127.7 67.0 20.8 6 80.5 84.2 129.4 64.4 21.9 78.9 82.7 125.6 64.3 21.9 7 69.3 74.0 90.6 53.8 19.6 68.1 71.1 90.0 54.9 19.4 8 71.8 76.3 92.3 56.5 20.5 68.5 71.7 90.8 54.7 19.9 9 69.9 74.7 93.4 55.6 20.3 69.3 73.3 90.5 55.4 21.0 10 62.8 67.5 79.4 56.2 19.3 63.2 67.4 73.1 57.4 19.4 11 64.3 69.3 83.0 57.4 19.8 64.4 68.4 75.2 58.6 20.1 12 64.5 68.8 83.5 59.4 20.2 65.4 69.3 74.9 59.5 20.6 13 55.9 60.8 65.3 48.1 17.0 60.6 64.4 65.4 55.8 19.1 14 56.2 61.7 64.5 47.8 17.5 60.1 64.4 61.9 53.0 19.7 15 59.0 64.7 68.7 51.0 18.8 60.2 64.2 62.4 54.9 19.4 16 54.6 59.7 74.6 46.9 17.7 61.3 65.0 77.9 56.6 20.0 17 57.1 63.6 77.3 47.1 18.4 60.3 63.9 76.1 54.2 19.8 18 55.9 62.3 74.0 46.7 17.4 61.3 64.9 76.8 55.8 20.3
According to Riskesdas 2013, the proportion of children who have ever smoked continues to increase by age. It starts at age 10 for boys, or perhaps younger which can be seen at Table 13 that 0.4 percent of boys aged 10 years are classified as ex-smokers. The proportion of daily smokers among boys increases with age from 0 percent of 10 year olds to 28.7 percent of 18-year olds. Overall, almost half (43.9 %) of boys age 18 are smokers.
Table 13. Proportion smoking among children 10-18 year by gender, Riskesdas 2013
Age (in years)
Boys Girls
Daily smokers
Occasional Smokers
Ex-Smokers
Not smokers
Daily smokers
Occasional Smokers
Ex-Smokers
Not smokers
10 0.0 0.1 0.4 99.4 0.0 0.0 0.0 100.0
11 0.1 0.7 0.7 98.6 0.0 0.0 0.0 99.9
12 0.3 1.0 0.9 97.8 0.0 0.0 0.0 99.9
13 1.0 2.2 2.0 94.8 0.0 0.1 0.0 99.9
14 4.0 5.2 2.7 88.1 0.0 0.1 0.1 99.7
15 8.6 9.8 3.7 77.9 0.0 0.1 0.2 99.6
16 15.1 13.3 3.6 68.0 0.1 0.2 0.2 99.5
17 22.8 15.4 4.2 57.5 0.1 0.3 0.3 99.2
6.
Discussion: Health and Nutrition Care
for Indonesian Children
Most health and nutrition services for children in Indonesia are provided in health facilities by the local government. The core interventions usually focus only on maternal care and children under 5 years of age, including health promotion, growth monitoring and promotion, nutrition education, counseling during antenatal and postnatal services, and breastfeeding practices. The services reach communities through health facilities, such as Polindes, Poskesdes, Pustu, and Puskesmas, and also Posyandu or Pos PAUD. However, weaknesses in the health system and issues associated with institutional capacity to cover all children 0-18 years of age require increases in staffing and better distribution of facilities and staff.
The national policies on the school health program (Usaha Kesehatan Sekolah/UKS) have been developed since the 1950s, and in the 1970s a task force for education and health was formed to implement health at the primary school, and in 1984 a school health policy was established memorandum of understanding (MOU) that involved four ministries (education, health, religious affairs, and home affairs), continued with revised MOU in 2003. However, currently this UKS program is not sustainable or many units do not operate optimally.
UKS should be revitalized for the purpose of improving the quality of education and student learning achievement by strengthening healthy life skills of students and preventing school children from illness such as diarrhea, or acute respiratory diseases, and other infectious diseases. Actually, the major activities of the UKS program have been set completely to make children physically healthy, including such activities as: i) health education (little doctors, and hand washing campaign); ii) health services at school-UKS room (height and weight measurements, healthy canteen, immunization, deworming, iron tablets for girls, health check, referral to health center/Puskesmas or hospital); and iii) healthy school environment (improving school sanitation facilities, access to safe and clean water, greening of schools).
Another program which should also be provided and maintained is the food supplementation program. Indonesian children who attend the school, are usually deficit in nutrients intake, providing healthy food to children will improve their capacity to learn. As explained before, the deficit in nutrient intake starts at age 7 and continues to age 18. A program providing healthy meals for school age children is a must to help prevent hunger and malnourishment.
Food supplementation for school age children is an expensive program. However, each district could source more foods locally and provide complimentary educational activities to students that emphasize food, farming, and nutrition. With the current condition that almost 40 percent of all Indonesian children are stunted, chronically malnourished and unhealthy, the nationwide program is needed to enrich children’s bodies and minds. Besides, this program may also support local economies where foods are produced to supply school canteens.
number of low birth weight babies. Improving health and nutrition at school age is an important policy for the short-term as well the long-term programs.
Responsibility for delivery of program to improve children health and nutrition should be shared among the central government, provinces, and districts with an important taken by district governments. Policy, strategy, standard and guidelines can be provided by the central government, the provinces are responsible for planning and quality assurance, while districts manage the resources and program implementation that addresses local needs.
Another issue that needs attention is a high risk group for school age girls, especially for those start entering the vulnerable child bearing years. For Indonesia, girls start their reproductive age at 10 years or younger. Girls are the key to health of future generations. It is important to ensure that girls are well nourished and healthy. From the previous paragraph, 20 to 30 percent of Indonesian girls are stunted and they will also need iron supplementation before their reproductive years begin. Schools can provide the program that can easily reach th