Jejak Vol 8 (2) (2015): 215-228. DOI: http://dx.doi.org/10.15294/jejak.v8i2.6172
JEJAK
Journal of Economics and Policy http://journal.unnes.ac.id/nju/index.php/jejak
The Analysis on Leading industries in Central Java Province
Setyani Irmawati1
1Semarang State University, Indonesia
Permalink/DOI: http://dx.doi.org/10.15294/jejak.v8i2.6172
Received: Juli 2015; Accepted: Agustus 2015; Published: September 2015
Abstract
The purpose of this research is for identifying the types of industriesthat become leading industries in Central Java Province. The methods, used are LQ (SLQ and DLQ) and Shift Share. The result of this research shows that the the leading industries in Central Java Province are beverage industry, tobacco processing industry, textile industry, apparel industry, wood industry, printing industry, furniture industry and other processing industries.In the future, the development of the industry should not only focus on the leading industries but also onnon-leading industries, so that the non leading industries will not be left behind.
Keywords: Leading Industry, SLQ, DLQ, Shift Share
How to Cite: Irmawati, S. (2016). The Analysis on Leading industries in Central Java Province. JEJAK: Jurnal Ekonomi Dan Kebijakan, 8(2), 215-228. doi:http://dx.doi.org/10.15294/jejak.v8i2.6172
© 2015 Semarang State University. All rights reserved Corresponding author :
Address: Kampus Unnes Sekaran, Semarang 50229 E-mail: [email protected]
INTRODUCTION
According to Kusumantoro (2009: 104), sectoral strategic development policy is a policy of development in the industrial sector. The sector is seen as a sector that has a high level of productivity, so that the advantages will be obtained a high added value. Therefore, the purpose of creating economic welfare of society can be more quickly realized by developing the sector.
However, not all regions have the potential in the sector of that particular regional economy. Development should be based on the potential of each region so that the basic purpose of such development, which is the creation of the society’s welfare, can be achieved. Sushil (2010).
According to Alisjahbana (2014: 11) in her study "Policy Direction and Strategy to Accelerate Development of Eastern Indonesia in 2014", the economic corridor that has potential and as a driver of national industry is the Java corridor. This is because many growing industries in the corridor. Based on the data from the Central Bureau of Statistics of the Republic of Indonesia (2014: 1), 83% of industry in Indonesia are in Java, while the rest are outside Java.
Based on Table 1, note that the Central Java province has great potential in the manufacturing sector, although still inferior to West Java and East Java province which has higher value of Gross Domestic Product (GDP) in manufacturing industry. Manufacturing industry has great potential in Central Java province which is supported by the high number of industries in the province.
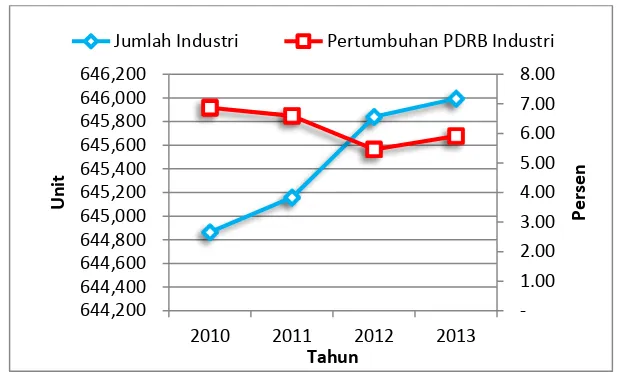
Based on Figure 1, the number of industries in Central Java province continues to increase from year to year during the period 2010 - 2013. During that period, new industries in Central Java province continue to grow and become one of the factors driving the increase in the GDP of the industry.
However, when viewed in greater detail, when the number of industries that continue to rise even GDP growth in the manufacturing industry in Central Java province is declining. The decline tends to indicate that the performance of the sector is likely to decline from year to year. Even in 2012, when the number of industries has significant increase, the decline is significant too. This performance indicates that an increasing number of industries are not always followed by an increase in performance
.
Tabel 1.
The PDRB value of Manufacture Industries in Java from 2009
–
2013 (in million
Rupiah)
Provinsi 2009 2010 2011 2012 2013
Source: The Central Statistics Agency of Central Java Province (2012 – 2014) Figure 1. The comparison of PDRB growth and the number of manufacturing industry in
Central Java 2010 – 2013
Based on these problems, there is a need for the identification of the types of industry that is a leading industry in Central Java province, an immidiate action also needs to be taken to trigger the increase in the performance of manufacturing industry. Because according to Tarin (2007: 28), there is a need to boost growth in a sector basis (leading) to encourage the growth of a region. This is because the growth will encourage the growth of other sectors, namely the non-base. The purpose of this study is to identify the types of industries in Central Java province which are the leading industries.
According to Tarin (2007: 28), the theory of economic basis (economic base theory) basing its view that the pace of economic growth of a region is determined by the magnitude of the increase in exports from the region. In this case, the economic activities grouped on base and events non-base ativities. Only the non-base activity that can encourage regional economic growth, while non-base ativities can only be used to meet local consumption needs.
In its development, it is necessary to boost growth in a base sector to encourage the growth of a region. This is because the growth will encourage the growth of other sectors, namely the non base. The basic sector is a sector that sell their products outside of their territory or activities that bring in money from outside of the region.Wyld (2010)
According to Tarin (2007: 79), Ricardo proves that when there are two countries that trade with each other and each country concentrated on exporting goods to the country that has a comparative advantage, the two countries will get the benefit. The comparative advantages of a commodity for a country or region is that the commodity is relatively superior to other commodities in the region.
The theory of comparative advantage is put forward by John Stuart Mill in Nopirin (2010: 11), who states that a country will produce and then export a commodity that has the comparative advantage of the total of a commodity that can be produced more cheaply and importing commodities that have
1.00 2.00 3.00 4.00 5.00 6.00 7.00 8.00
644,200 644,400 644,600 644,800 645,000 645,200 645,400 645,600 645,800 646,000 646,200
2010 2011 2012 2013
Per
sen
Unit
Tahun
a comparative disadvantage, namely the commodity whose production process requires a large cost. This theory basically states that the value of a commodity is determined by the amount of labor that has gone into producing the goods. The more energy that has gone into producing these commodities, the more expensive the value of the commodity.
According to Tarin (2007: 81), competitive advantage analyses an area's ability to market its products outside the region/ overseas/ global market. The competitive advantage of seeing whether the products can be sold in the global market profitably.
Michael E. Porter in halwani (2005: 36) in his famous book, The Competitive Advantage of Nations, 1990, suggests a direct correlation between the two factors of production (abundant natural resources and cheap human resources) owned by the state and utilized as a competitive advantage in international trading, many countries have a number of very large workforce but have backward international trade competitiveness. So if the wage level is relatively cheap, it is strongly correlated with the low motivation to work hard and excel. The final result, Porter mentions that the role of government is to support the improvement of competitiveness in addition to the available factors of production.
A country's industrial success in international scale is generally backed by four attributes, namely a good production conditions factor, demand and domestic high quality requirements, upstream or downstream of advanced and intense domestic competition. Ray (2012). The competitive advantage that is only supported by one or two attributes alone usually will not be able to survive, because all four of these
attributes interact positively on the country's success in improving competitiveness. Besides opportunities, the role of government is also a significant additional variables such as the application of antitrust policy, regulation, deregulation, or the condition of the consumer. Simranjeet (2015).
If you want to win the competition, there are five forces that must be taken into consideration which includes: (1) The character of the competition among competitors. If the competition faced is offensive, most likely the industry is less attractive and less profitable. (2) The threat of the new-comers competitors. If other companies can easily enter the industry, the industry capacity will be enlarged and the price will go down, so that the profits being enjoyed would be jeopardized. (3) The threat of substitute products or services. If a customer has many options to satisfy their needs for products and services produced, then the profitability of the industry will be threatened. (4) The bargaining position of suppliers. A situation where the industry can move from one supplier to another easily. (5) Bargaining position of consumers. If the consumer is stronger than the industry, then the industry will issue a larger overhead.
they are not superior and do not have either comparative or competitive potentials.
A research by Kusumantoro (2009) on "Disparities and Specialties of Manufacturing Industry in Regencies/ Cities in Central Java" shows that the identification of specialized industry that generate industrial activity in Central Java province that stands out are the food and beverage industry, textile industry, wood industry, items made of wood and wicker, chemical industries and goods from chemicals.
Research by Habibullah (2009) on "Industry Concentration in Rich and Poor States in Malaysia: Location Quotient and Shift Share Analyses" is based on annual data from 1970 and 2000 period, and the results of the analysis of LQ and shift share showed that the poor areas (Kedah, Perlis and Kelantan) marked the main economic activities are concentrated in the agricultural sector, while the rich areas (Penang, Selangor and Wilayah Persekutuan), showed that their manufacturing sector is a major contributor to economic growth.
Research by Quintero (2005) on "Regional Development: An Economic Base Study and Shift-Share Analysis of Hays County, Texas" shows results that Hays County has a strong and diverse economy with a strong base in the group of retail, construction, manufacturing, and industrial health services. Although the national economy shows a slowdown in manufacturing, this area experienced significant growth in Hays County.
Research by Iseki and Jones (2014) on "Analysis of Firm Location and Relocation Around Maryland and Washington, DC Metro Rail Station" indicates that the LQ analysis identified five industries (finance, insurance and real estate (FIRE), professional services, arts and entertainment , health, as well as
accommodation and food services) have a strong presence within 0.5 miles distance walk from the network 66 WMATA Metro station in Washington DC and Maryland, while some of the industry is also identified as an industry with high growth around transit stations in several other studies.
RESEARCH METHODS
This type of research is a quantitative study. This research analyzes quantitative data to identify the types of industry that is a leading industry in the province of Central Java. The variables used and analyzed in this study include: The output value of each type of industry in Central Java province: the output value of each type of large and medium industries in Central Java province using the code based on the Standard Industrial Classification of Indonesia (ISIC) 2 digit time series in 2007 - 2012. The output value of every type of industry in Indonesia: the output value of each type of large and medium industries in Indonesia by ISIC 2-digit code in time series in 2007-2012.
The data used in this research is secondary data. Secondary data were used, among others, the output value of each industry in Central Java province and the output value of each industry in Indonesia in time series from 2007 - 2012. The data obtained from the Central Statistics Agency of Central Java Province and the Indonesian Bureau of Statistics.
Location Quotient (LQ) is a method to determine the leading sectors in a region by comparing the role of a sector in a region with the role of the sector at a broader level. LQ analysis resulted in a sector that has a comparative advantage in the areas being analyzed.
According to Warpani (1980: 68), Static Location Quotient (SLQ) analysis is an analysis beginning to know the benefits of a region in specific sector activities. Basically, this technique illustrates a relative comparison between the ability of a sector in the analyzed areas by the ability of the same sector in the wider region. Variables that can be used as a measure to generate SLQ coefficients can be the amount of labor, the value of production, as well as other variables. SLQ value can be measured by using the following formula:
The analysis requirements of comparative advantage through SLQ is when the value of SLQ> 1 then the industry has the comparative advantage. If the SLQ value <1 then the industry does not have a comparative advantage.
According to the Directorate General of Agriculture (2015: 12), the advantage of SLQ analysis is that it is a simple analytical tool. It can show the economic structure of a province rather than the national. The
weakness is, the result of static analysis only provides a snapshot at one point in time, which means that the sector being featured this year is not necessarily going to be the dominant sector in the future, and vice versa. According to the Directorate General of Agriculture (2015: 13), SLQ analysis weakness can be overcome if the rate of growth of a sector in the provinces being studied can be compared to the growth rate of the sector at the national level, namely the method of Dynamic Location Quotient (DLQ). According to Kuncoro (2012: 134), DLQ is a
DLQij : industry i potential index in Central Java Province of all industries in Indonesia
i development in Indonesia
The results of DLQ value can be interpreted as follows. If the DLQ> 1, then the potential for industry i development in the province of Central Java is faster than the same industry in Indonesia. However, if the DLQ <1, then the potential for industry i development in the province of Central Java is lower than in Indonesia.
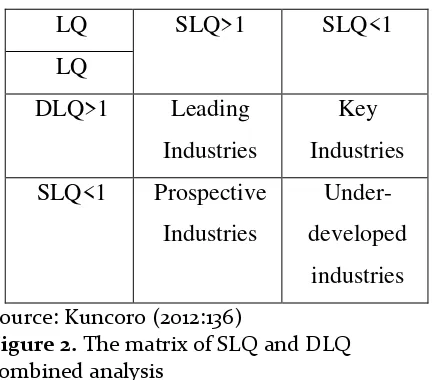
The combination of SLQ and DLQ values used as criteria in determining whether the industries are classified as superior, prospective, pledge, or lagging.
LQ
SLQ>1
SLQ<1
Shift Share Analysis is an analytical tool that can be used to know which economic sectors are included in the sector that have a competitive advantage or to compete with similar sectors in other regions and sectors that do not have a competitive advantage by seeing the value of Cij on the results. The sector is said to have a competitive advantage if the sector is able to compete with the same sector in other areas.
Cij value can be measured by using the following formula:
Cij :competitive value component
The analysis requirements of comparative advantage through SS is when the value of Cij showed positive figures, the commodity has competitive advantages. If Cij values indicate negative numbers then these commodities do not have a competitive advantage.
RESULTS AND DISCUSSION
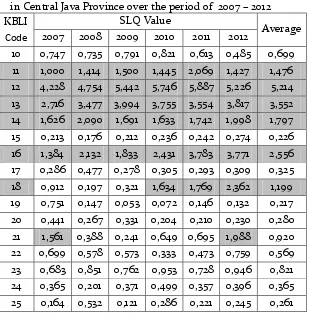
industry in the years 2007 - 2012. An industry has a comparative advantage when the value of SLQ> 1. While the industry does not have a comparative advantage when the value of SLQ <1.
According to the following table 2, not all industries in Central Java province has a comparative advantage in 2007- 2012. There are 8 types of industries that have a comparative advantage, namely the beverage industry, the tobacco manufacturing industry, textile industry, apparel industry, wood industry, printing industry, furniture industry and other manufacturing industries. These industries are classified as superior because they have an average value of SLQ> 1. They have high output value and their growth rates are higher than the national average leading these industries to have a comparative advantage.
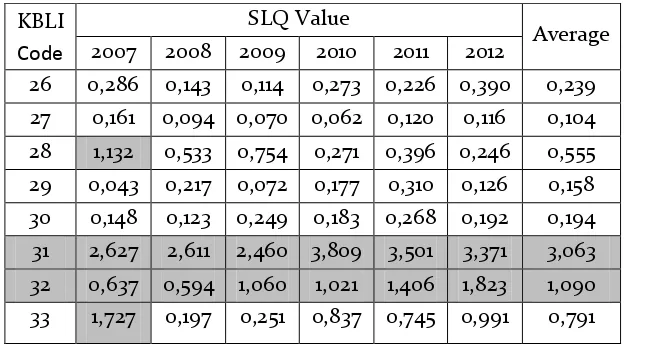
While 16 other industries do not have comparative advantage, namely the food
industry, leather industry, paper industry, coal industry, chemical industry, pharmaceutical industry, rubber industry, non-metal mining, basic metal, non-machines metal goods, electronics, electrical equipment, machinery, vehicles, other transport equipment industries, and repair and installation of machinery and equipment. These industries are not superior because it has an average value of SLQ <1. these industries have a low output value and its growth rate is lower than the national average. According to the Directorate General of Agriculture (2015: 13), SLQ analysis results are only static, so it can not estimate the possible changes that will happen in the future. To overcome these weaknesses, the Dynamic Location Quotient (DLQ) method is used. If the DLQ value ≥ 1, then an industry is the leading industry in the future, while if the value of DLQ <1, it indicates otherwise.
Table 2. The results of SLQ Analysis of Industries in Central Java Province over the period of 2007 – 2012 KBLI
Code
SLQ Value
Average 2007 2008 2009 2010 2011 2012
KBLI Code
SLQ Value
Average 2007 2008 2009 2010 2011 2012
26 0,286 0,143 0,114 0,273 0,226 0,390 0,239 27 0,161 0,094 0,070 0,062 0,120 0,116 0,104 28 1,132 0,533 0,754 0,271 0,396 0,246 0,555 29 0,043 0,217 0,072 0,177 0,310 0,126 0,158 30 0,148 0,123 0,249 0,183 0,268 0,192 0,194 31 2,627 2,611 2,460 3,809 3,501 3,371 3,063 32 0,637 0,594 1,060 1,021 1,406 1,823 1,090 33 1,727 0,197 0,251 0,837 0,745 0,991 0,791
Source: Central Statistics Agency of Central Java and Indonesia Indonesia (2007 – 2012), the data is tabulated by the researcher.
Tabel 3. Hasil Analisis DLQ Industri di Provinsi Jawa TengahTahun 2007 –
2012
KBLI Code
Types of Industry DLQ Value 10 food industry 0,570 11 beverage industry 1,252
12 tobacco processing
industry 1,085 13 textile industry 1,233 14 apparel industry 1,079
15 leather and shoes
industry 1,126 16 wood industry 2,390 17 paper industry 0,947 18 printing industry 2,273
19 coal and oil mining
industry 0,155
20 chemical substance
industry 0,459
21 pharmaceutical
industry 1,117
22 rubber and plastic
industry 0,953
23 non-metal mining
industry 1,215 24 Basic metal industry 0,952
KBLI Code
Types of Industry DLQ Value
25 non-machine metal goods industry 1,313
26 Computers, electronics
and optics industry 1,196
27 Electrical Equipment
industry 0,636
28 Machinery and
equipments industry 0,190 29 Vehicles industry 2,588 30 Transport industry 1,135 31 Furniture industry 1,126
32 Other manufacturing
industries 2,511
33 Installation and repair
service Industry 0,504 Source: Central Statistics Agency of Central Java and Indonesia(2007 – 2012), the data is
tabulated by the researcher.
tobacco processing industry, textile industry, apparel industry, leather industry, wood industry, printing industry, pharmaceutical industry, metal mining industry, non-machine metal goods industry, electronics industry, motor vehicles, transport equipment other industrial funiture , and other processing industries.
Meanwhile, nine types of industries that do not fit the group does not have the potential to become a leading industry in the future include the food industry, paper industry, coal industry, chemical industry, rubber industry, basic metal industry, electrical equipment, machinery, and repair and installation of machinery and equipment. This is because the DLQ value in these industries are worth less than 1. These industries have a small possibility to be able to become a leading industry in the future because of its growth potential is lower than the potential growth of the same industry at the national level.
According to Kuncoro (2012: 134), the combined analysis results of SLQ and DLQ can produce grouping the types of industries that have comparative advantages.
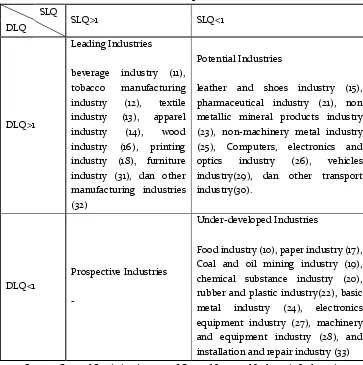
The merger resulted in the grouping of industries into four categories, namely the leading industry, the potential industry, prospective industries, and under-developed industry. The results of combined analysis of SLQ and DLQ can be seen in figure 3.
Based on the combined analysis of SLQ and DLQ, there are eight types of leading industry, 7 types of potential industry, and 9 types of under-developed industry. The types of industry that is a leading industry in Central Java province, among others, the beverage industry, the tobacco manufacturing industry, textile industry, apparel industry, wood industry, printing industry, furniture industry and other manufacturing industries. This is because in addition to the fact that
these industries excel at present, also has the potential to become a leading industry in the future. They are characterized by the value of SLQ and DLQ whic is >1.
While the types of industry that are potential industries in Central Java province, among others, the leather and shoes industry, pharmaceutical industry, non metallic mineral products industry, non-machinery metal products industry, the electronics industry, the motor vehicle industry, and other transportation equipment industries. This is because although the industries are not the leading industry at the present time, they have the potential to become leading industries in the future and are characterized by the value of SLQ <1 and DLQ> 1.
Hile the types of industry that became under-developed industries in Central Java province, among others, the food industry, paper industry, coal industry, chemical industry, rubber industry, basic metal industry, electrical equipment industry, machinery industry, repair and installation of machinery and equipment industry. This is because these industries are industries that do not excel in the present and does not have the potential to become a leading industry in the future. They are characterized by the value of SLQ and DLQ which are less than one.
industry, the tobacco manufacturing industry, textile industry, apparel industry, wood industry, printing industry, furniture industry and other manufacturing industries. However, these industries are only classified based on their comparative advantage and not based on their competitive advantage. Thus, their competitive advantage nedds to also be analysed to be able to know with certainty about the kind of leading industry that has had two advantages at once.
Based on the analysis in Table 4 below, the entire leading industry that has been classified on the analysis of LQ also has a competitive advantage represented by positive Cij. Therefore, it can be said that the industry is a leading industry when it has two advantages at once, both comparative advantage and competitive advantage. While the industry is classified as a potential industry also has a competitive advantage because of the Cij value on these industries is positive.
SLQ
SLQ>1 SLQ<1
DLQ
DLQ>1
Leading Industries
beverage industry (11), tobacco manufacturing industry (12), textile industry (13), apparel industry (14), wood industry (16), printing industry (18), furniture industry (31), dan other manufacturing industries (32)
Potential Industries
leather and shoes industry (15), pharmaceutical industry (21), non metallic mineral products industry (23), non-machinery metal industry (25), Computers, electronics and optics industry (26), vehicles industry(29), dan other transport industry(30).
DLQ<1
Prospective Industries
-
Under-developed Industries
Food industry (10), paper industry (17), Coal and oil mining industry (19), chemical substance industry (20), rubber and plastic industry(22), basic metal industry (24), electronics equipment industry (27), machinery and equipment industry (28), and installation and repair industry (33) Source: Central Statistics Agency of Central Java and Indonesia Indonesia
Thus, the industry has the potential to become a leading industry in the future and be able to compete with the same industry of other regions. While the industry is classified as an under-developed, three of them namely paper industry, rubber and plastics industry, as well as basic metal industry has a competitive advantage which means that although the resulting output has not been able to export either in the present or in the future, the products of these industries are
possibly competitive when compared with the products from the same industry of other regions in Indonesia. While other underdeveloped industry does not have a competitive advantage because of the Cij value on these industries is negative. Thus, in addition to the fact that this industry has been unable to export at present time and possibly in the future, the industry can not compete with the same industry from other regions.
Table 4. The Comparison of LQ and Shift Share analysis for Industries in central Java in 2007 – 2012
KBLI Code SLQ Average DLQ Cij Criteria
10 0,699 0,570 -1.612.706.195.560 Under-developed
11 1,476 1,252 48.339.645.032 Leading
12 5,214 1,085 861.012.633.923 Leading
13 3,552 1,233 954.075.888.316 Leading
14 1,797 1,079 142.367.610.862 Leading
15 0,226 1,126 23.514.069.328 Under-developed
16 2,556 2,390 851.809.413.283 Leading
17 0,325 0,947 4.758.585.279 Under-developed
18 1,199 2,273 175.420.225.254 Leading
19 0,217 0,155 -29.388.215.168 Under-developed
20 0,280 0,459 -584.586.753.612 Under-developed
21 0,920 1,117 71.018.065.177 Under-developed
22 0,569 0,953 28.650.993.708 Under-developed
23 0,821 1,215 152.274.097.833 Under-developed
24 0,365 0,952 7.180.029.181 Under-developed
25 0,261 1,313 60.497.673.295 Under-developed
26 0,239 1,196 31.216.170.154 Under-developed
27 0,104 0,636 -44.213.397.956 Under-developed
28 0,555 0,190 -265.582.967.243 Under-developed
29 0,158 2,588 115.455.434.768 Under-developed
30 0,194 1,135 26.611.500.080 Under-developed
31 3,063 1,126 95.391.705.941 Leading
32 1,090 2,511 138.858.428.280 Leading
CONCLUSION
The conclusion of this study are the types of industry that is a leading industry in Central Java province, among others, the beverage industry, the tobacco manufacturing industry, textile industry, apparel industry, wood industry, printing industry, the furniture industry, as well as other processing industries. The advice given in this study was the development of the industry focused on the leading industry in Central Java province in order to raise the economic growth in Central Java. However, non-featured industrial development should also be increased so that these industries are not getting left behind and become a leading industry in the future.
REFERENCES
Alisjahbana, Armida S. (2014). Arah Kebijakan dan Strategi Percepatan Pengembangan Kawasan
Timur Indonesia. Manado: Kementerian Perencanaan Pembangunan Nasional/Badan Perencanaan Pembangunan Nasional.
Badan Pusat Statistik Provinsi Banten. (2014). Provinsi Banten Dalam Angka 2014. Pada: http://banten.bps.go.id/index.php?hal=publikas i_detil&id=21. Diunduh pada 17 Desember 2014. Badan Pusat Statistik Provinsi DKI Jakarta.(2014a).
Provinsi DKI Jakarta Dalam Angka 2014. Pada: http://jakarta.bps.go.id/index.
php?bWVudT0xOTAwJnBhZ2U9cmFrYnVrdQ= =. Diunduh pada 17 Desember 2014.
Badan Pusat Statistik Provinsi Jawa Tengah. (2007).
Statistik Industri Manufaktur Besar Sedang Jawa Tengah 2007 Buku I. Semarang: Badan Pusat Statistik Provinsi Jawa Tengah
Badan Pusat Statistik Provinsi Jawa Timur. (2014a). Provinsi Jawa Timur Dalam Angka 2014. Pada: http://jatim.bps.go.id/index.
php?hal=publikasi_detil&id=57. Diunduh pada 17 Desember 2014.
Badan Pusat Statistik Republik Indonesia.(2014).
Statistik Industri Besar dan Sedang 2007. Jakarta: Badan Pusat Statistik Republik Indonesia Direktorat Jenderal Industri Agro. (2015). Peraturan
Direktur Jenderal Industri Agro Nomor 20/IA/PER/3/2015 Tentang Petunjuk Teknis
Pelaksanaan Kegiatan Melalui Dana Dekonsentrasi Pengembangan Industri Agro Unggulan Daerah Direktorat Jenderal Industri Agro Tahun 2015. Jakarta: Direktorat Jenderal Industri Agro.
Habibullah, Muzafar Shah dan Alias Radam. (2009). Industry Concentration in Rich and Poor States in Malaysia: Location Quotient and Shfit Share Analyses.ICFAI Journal of Industrial Economics. 6(1): 56 – 65.
Halwani, R. Hendra. (2005). Ekonomi Internsional dan Globalisasi Ekonomi Edisi Kedua. Bogor: Ghalia Indonesia.
Iseki, Hiroyuki dan Robert P. Jones (2014). Analysis of Firm Location and Relocation Around Maryland and Washington, DC Metro Rail Station. for a Presentation. College Park: University of Maryland.
Kuncoro, Mudrajad. (2012). Perencanaan Daerah: Bagaimana Membangun Ekonomi Lokal, Kota, dan Kawasan?. Jakarta: Salemba Empat.
Kusumantoro.(2009). Disparitas dan Spesialisasi Industri Manufaktur Kabupaten/Kota di Jawa Tengah.JEJAK. 2(2), 104 – 113.
Nopirin.(2010). Ekonomi Internasional Edisi 3. Yogyakarta: BPFE-Yogyakarta.
Ray, Sarbapriya. 2012. Economic Performance Of Indian Automobile Industry: An Econometri Appraisal.Business Intelligence Journal January, 2012 Vol.5 No.1
Sushil, Kumar Jabir Ali, (2010),"Indian agri-seed industry: understanding the entrepreneurial process", Journal of Small Business and Enterprise Development, Vol. 17 Iss 3 pp. 455 - 474
Simranjeet, Kaur Sunil Kumar Z. F. Bhat Arvind Kumar , (2015), "Effect of pomegranate seed powder, grape seed extract and tomato powder on the quality characteristics of chicken nuggets", Nutrition &Food Science, Vol. 45 Iss 4 pp. 583 - 594
Quintero, James Paul. (2007). Regional Development: An Economic Base Study and Shift-Share Analysis of Hays County, Texas. Applied Research Project.Partial Fulfillment for the Requirements for the Degree of Master of Public Administration.Texas: Texas State University. Tarigan, Robinson. (2007). Ekonomi Regional Teori dan
Aplikasi (Edisi Revisi). Jakarta: Bumi Aksara. Thahir, Septian. (2013). Telaah Subsektor Industri Kecil
Bantul, 2005 – 2012. Yogyakarta: Universitas Gadjah Mada.
Warpani, Suwardjoko. (1980). Analisis Kota dan Daerah. Bandung: Penerbit Institut Teknologi Bandung. Wyld, David C. 2010. The cloudy future of government